
Mechanism of microcrack zone formation in rock samples of various lithological types under triaxial stress state fracture conditions
- 1 — Ph.D., Dr.Sci. Director of Research Institute “Deep Metageology” Empress Catherine ΙΙ Saint Petersburg Mining University ▪ Orcid ▪ Scopus
- 2 — Ph.D. Head of Laboratory Empress Catherine ΙΙ Saint Petersburg Mining University ▪ Orcid ▪ Scopus
- 3 — Senior Researcher Empress Catherine ΙΙ Saint Petersburg Mining University ▪ Orcid
- 4 — Leading Engineer Empress Catherine ΙΙ Saint Petersburg Mining University ▪ Orcid
- 5 — Ph.D. Associate Professor Empress Catherine ΙΙ Saint Petersburg Mining University ▪ Orcid
- 6 — Leading Engineer Empress Catherine ΙΙ Saint Petersburg Mining University ▪ Orcid
- 7 — Postgraduate Student Empress Catherine ΙΙ Saint Petersburg Mining University ▪ Orcid
Abstract
Study of fracture mechanics in heterogeneous rocks, including crack initiation and propagation, has practical applications for geocontrol and identification of fracture zones in hydrocarbon well extraction. The features of microcrack zone formation depending on the type of rock heterogeneity under triaxial stress state conditions are considered. The research was conducted using an MTS 815 servo-hydraulic testing frame integrated with a Milne DAQ acoustic emission system (Itasca International Company, UK). The paper presents the fracture results of samples of various lithological types manufactured from cores of post-magmatic rocks. Fine-grained samples with gneissic and banded textures, as well as a coarse-grained sample with massive texture, were tested. During the tests, acoustic emission (AE) was recorded using 12 piezoceramic sensors. To describe the geometry of the fracture zone, the coordinates of AE event hypocenters were calculated, then the configuration of hypocenters distribution was analyzed using a tomography procedure (layer-by-layer construction of AE event density maps), and the angles β between the direction of the macrocrack and the axial stress σ1 were determined. To interpret the failure evolution, trends of the b-factor and AE activity were calculated, the intervals of critical behavior of which were correlated with the localization and tomography data. After testing the samples, the types of their deformation and the mechanism of destruction with the phenomenon of dilatation were revealed. It is established that for the considered types of sample inhomogeneities, various microcrack structures are formed under the same volumetric loading conditions. In fine-grained rock of gneissic texture, a linear distribution of AE hypocenters is formed, indicating the formation of microcracks along the direction of layering. For the fine-grained rock with banded texture, the hypocenter distribution is characterized by the formation of distinct clusters, reflecting areas of the most intensive fracturing. In the coarse-grained massive texture sample, a volumetric distribution of hypocenters is observed, manifesting dilatancy properties and the formation of an extensive microcrack network.
The work was carried out within the framework of the State assignment FSRW-2024-0008.
Introduction
The advancement of fracture mechanics and the identification of open fracturing in rocks of varying lithological types and structures, based on laboratory methods for determining fracture system parameters that affect the productivity of oil and gas as well as geothermal reservoirs, is a relevant research direction with practical significance for enhancing the efficiency of well-based hydrocarbon production [1, 2]. Alongside the determination of the physical and mechanical properties of rocks, it is necessary to investigate the structural and textural features of rock masses and their influence on fluid saturation in well placement areas. To increase the efficiency of oil and gas wells in the hydrocarbon production, a comprehensive assessment of the properties of the formation is carried out, including the determination of natural fracturing of the formation, tectonic disturbances, and core studies are also carried out [3, 4]. It is noted in [5, 6] that the main indicators of reservoir fluid saturation are karst formation, zones of cracks and fault zones. The permeability of fractured reservoirs depends most on the orientation of the fracture systems and disturbances relative to the main stresses [7]. To clarify the reservoir properties of the deposit, the structure of the distribution of lithotypes by reservoir volume is analyzed [8].
During deep drilling [9, 10], it is necessary to take into account not only the effect of increasing the strength of rocks by increasing the all-round pressure, but also the orientation of the inhomogeneities with respect to the maximum main stress. It was shown in [11-13] that the heterogeneous structure of arock mass has a significant effect on its mechanical characteristics, in particular, on strength limit. Process modeling has established that during virtual compression, the maximum deviation of strength values from the average reaches 60 % when the angle of inclination of the system of inhomogeneities in the form of cracks changes relative to the horizontal plane from 0 to 75°.
The experimental study of the physical and mechanical properties of rocks and their degree of fracturing is carried out using laboratory testing methods involving extensometers and servo-controlled testing machines [14-16]. To investigate the influence of the heterogeneous rock structure on strength characteristics, numerical modeling methods based on discrete grain-based elements (GBM) are being developed [17, 18]. Among laboratory methods, the acoustic emission (AE) technique [19-21] is gaining increasing relevance, used for real-time study of the formation and evolution of defect structures, as well as the influence of heterogeneities on strain localization under mechanical loading.
The fracture of solids is accompanied by the formation of an acoustic field caused by the emission of elastic waves during crack formation [22-24]. The informational content of the acoustic field in studying the fracture process implies the existence of unambiguous relationships between the characteristics of the radiation source (a propagating crack), the properties of the object under study (rock), and the parameters of the AE [25-27]. Since acoustic emission arises from the rupture of bonds at the crack tip, accompanied by the instantaneous release of strain potential energy when the local material strength limit is exceeded, the radiated energy depends on the crack size and the magnitude of local stress [28]. From the onset of crack initiation to the formation of a macroscopic fracture, the scale of the process varies from the destruction of mineral grains in the rock to the coalescence of microcracks into a main rupture. The formation of a microcrack zone during brittle fracture triggers the dilatancy process [29-31].
Research methods
The study of rock sample behavior under a triaxial stress state was conducted using an MTS 815 servo-hydraulic testing system integrated with a Milne DAQ acoustic emission system (Itasca International Company, UK). The technical specifications of the MTS 815 system allow for the application of a confining pressure of up to 80 MPa and an axial load on the sample of up to 4600 kN. The MTS 815 system comprises a load frame, a triaxial compression chamber, confining and pore pressure intensifiers, controllers, and a software package for automatic loading control, as well as for data acquisition and processing from the load cell and deformation sensors. The samples were tested under a confining pressure of 40 MPa.
Examples of the fracture of three samples of different lithological types, manufactured from post-magmatic rock cores, are considered. Figure 1 shows photographs of the samples before testing: two fine-grained samples with gneissic (A) and banded (B) textures, and one coarse-grained sample with massive texture (C). The gneissose texture of sample A is oriented at an angle of 50-60° to the core axis. The banded texture of sample B is defined by heterogeneities aligned with the maximum principal stress (at an angle of 0-5° to the sample axis).
AE signal acquisition was performed by the Milne DAQ data acquisition system in triggered mode. The main triggering and recording parameters were controlled via the Milne Leach software module: signal sampling frequency – 10 MHz; number of samples per signal – 2048 samples; band-pass filter for signal processing – 100-1200 kHz; dynamic range – 5 V; trigger threshold per channel – 80-100 mV.
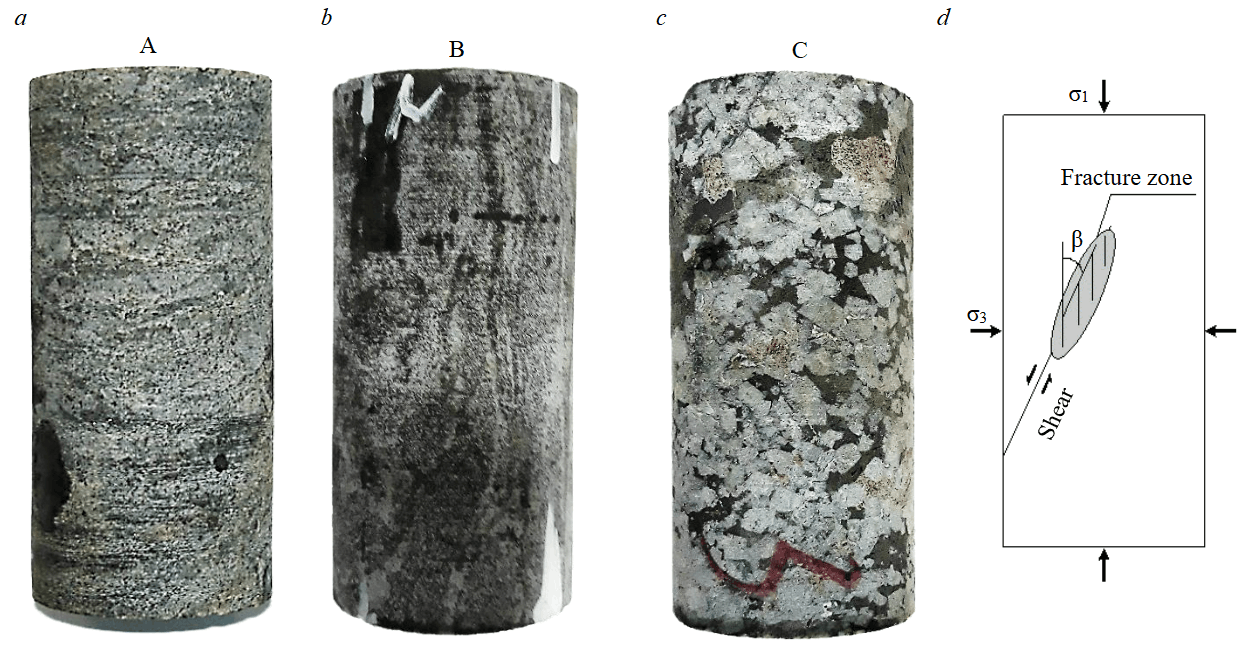
Fig.1. Samples before testing: a – fine-grained gneissic texture A; b – fine-grained banded texture B; c – coarse-grained massive texture C; d – schematic of rock sample loading and fracture
The samples were made in the form of cylinders 125 mm high and 50 mm in diameter. The side and end surfaces of the sample were sealed using a rubber shell. 12 acoustic emission sensors were installed on the side surface of the sample. The sample was then placed in a three-axis compression chamber, in which a lateral pressure of σ3 equal to 40 MPa was created with mineral oil. After that, the sample was loaded with an axial load σ1 at a speed of 0.01 mm/min.
The coordinates of the AE hypocenters and the construction of event density maps were calculated using the ASC InSite Seismic Processor software (Itasca International Company. 2019, v 3.15, UK). The wave velocities used in calculating the coordinates were measured by ultrasound before testing each sample. As a result, for samples A and B, the wave velocities were set in the calculation as Vp = 3517 m/s and Vs = 1691 m/s, and for sample C – Vp = 4767 m/s and Vs = 3150 m/s. To determine the arrival times of the P-wave for each channel of the AE event, the function of automatically determining the time of the first entry of the signal, built into the InSite Seismic Processor, was used.
Figure 1, d shows a general scheme illustrating the process of consolidated rocks destruction under conditions of all-round pressure [32]. This model was developed by the authors based on the analysis of AE event location data in samples of Westerly granite and analytically described stress fields of expanding microcracks [33]. According to the model, the origin of a macrofracture begins with the formation of a fracture preparation zone as a result of the unstable interaction of separation microcracks in the area of their critical concentration. Stress fields related to shear along the fracture enhance the opening of microcracks in the fracture preparation area, thereby transferring the process of formation of new microcracks to unstable and making the transition to macrofracture. In this case, the rupture spreads in a plane forming an angle β = 20-30° to the axis of maximum compression stress σ1.
To determine the geometry of the fracture zone, the configuration of the distribution of AE event hypocenters was analyzed. The AE event density maps were calculated, the shape of which described the fracture structure and estimated the angle β between the direction of the macrofracture and the axial stress σ1 (Fig.1, d). To clarify the nature of the fracture, the results of the location were compared with the fracture geometry, which was visually revealed by the predominant direction of macroscopic cracks on the surface of the tested samples.
To illustrate the energy of AE events, the magnitude ML values corresponding to the color diagrams were displayed on the distributions of their hypocenters. The magnitude was determined using a function built into the InSite Seismic Processor program for each location event as the logarithm of the average of the number of sensors, the product of the standard deviation of each event signal by the distance between the corresponding sensor and the event source:
where n – the number of AE sensors; dm – the distance between the sensor mand the source; – the standard deviation of the signal along the channel m.
The b-factor and AE activity were used to interpret the fracture evolution. In accordance with the Guttenberg – Richter law [34], the b-factor was determined as follows:
where – the number of AE events with an amplitude greater than А1; – the number of AE events with an amplitude greater than А2 (А2>А1).
The signal values, the maximum of all recorded signals for each AE event, were compared with the amplitudes A1 and A2. The b-factor changes in such a way that an increase in the number of high-amplitude events causes a decrease in the b values for the specified time intervals of a certain test. Thus, the b-factor acquires the meaning of the probability of a critical condition of the rock – the lower the b value, the more likely the condition is close to brittle fracture.
When constructing trends of the b-factor and AE activity, the method of a sliding time window of variable duration was used, which sequentially moved along the time axis of each test. The window duration was chosen in such a way as to ensure sufficient trend resolution, and at the same time statistically significant estimates of the b-factor and AE activity. The calculation of the b-factor and AE activity was performed using a computer application developed by the authors.
Results
In order to analyze the structure of the zone of microcracks formed during loading, tomography was performed for all samples, which consists in layer-by-layer construction of event density maps. The resolution of the density maps, thickness, and orientation of the layers were set in such a way as to identify the most characteristic features of the microcrack structure for each sample.
The event density of sample A was calculated for 2.5 mm thick layers with a resolution of 33×83. Figure 2 shows the locations of AE event hypocenters, an event density map, and a photo after testing for this sample. It can be seen that the main cluster of events has a linear shape located at an angle β = 51° to the axis of the sample (Fig.2, a, upper part of the sample). When comparing the distribution of hypocenters of events (Fig.2, a) with the photo of the sample after testing (Fig.2, c), it can be concluded that this direction corresponds to the main fracture formed in the form of a macrofracture (a light trace on the sample).
The event density of sample B was calculated for 5 mm thick layers with a resolution of 20×50. Figure 3 shows the locations of AE event hypocenters, event density maps, and a sample after testing [35]. It can be seen from Fig.3, a that the crack formation structure differs significantly from Sample A of the gneissic texture. It is characterized by a volumetric distribution with a tendency to localize hypocenters. Using the tomography procedure, two distinct spherical clusters were identified at levels differing in height (Fig.3, b, c). At the same time, the macrofracture, as can be seen in Fig.3, d, formed as a rectilinear rupture with an angle β of approximately 21°. This angle lies in the range of values predicted in [32] for brittle fracture.
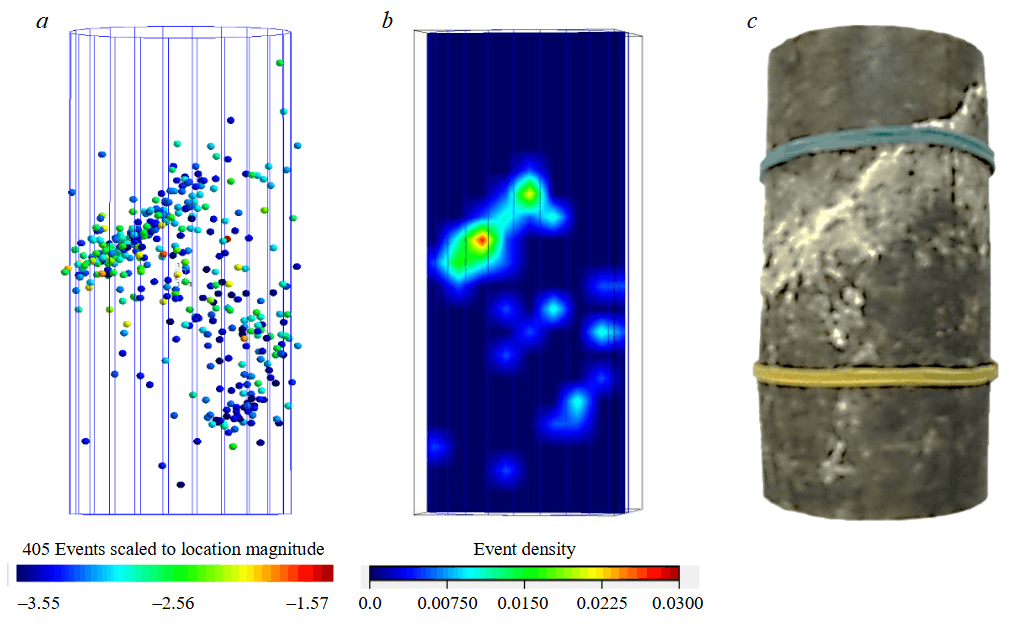
Fig.2. Analysis of the microcrack zone for a fine-grained sample A of gneissic texture (strength limit 467 MPa): a – distribution of AE event hypocenters for the entire test time; b – event density map; c – sample after testing
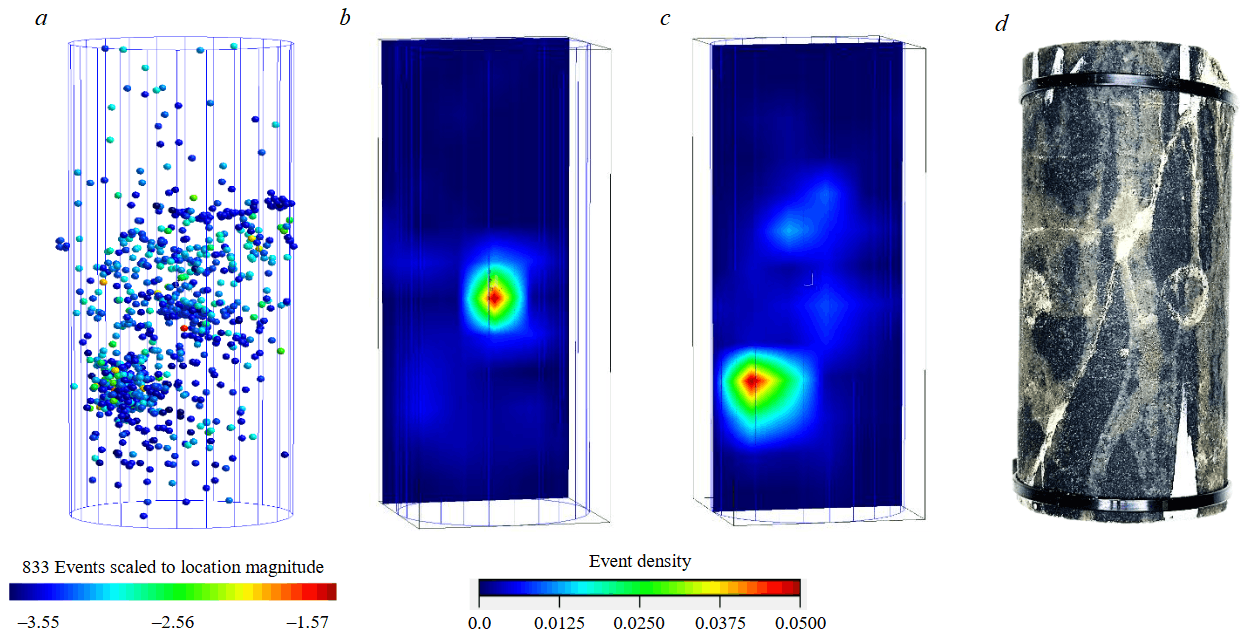
Fig.3. Analysis of the microcrack zone for a fine-grained sample B of a banded texture (strength limit 520 MPa): a – distribution of AE event hypocenters over the entire test period; b – event density map revealing the first cluster; c – event density map revealing the second cluster; d – sample after testing
The event density of sample C was calculated for 2.5 mm thick layers with a resolution of 22×55. Figure 4 shows the locations of AE event hypocenters, event density maps, and a sample after testing. The distribution of hypocenters is most scattered here (Fig.4, a) compared to the previous samples. At the same time, the detailed location results reveal two characteristic clusters with the highest event density compared to previous samples (Fig.4, b, c). It can be seen from Fig.4, d that the macro-fracture was formed in the form of a smooth curved line. An analysis of the evolution of the fracture process over time, the parameters of which are the activity and the AE b-factor, showed that this macrofracture curve can be roughly decomposed into two straight lines (Fig.5). These lines are identified sequentially if the hypocenter distributions are plotted separately for the events of the first peak of activity corresponding to the interval 4100-5100 s in Fig.6, and for the events of the main peak of activity for the interval 9800-10,600 s.
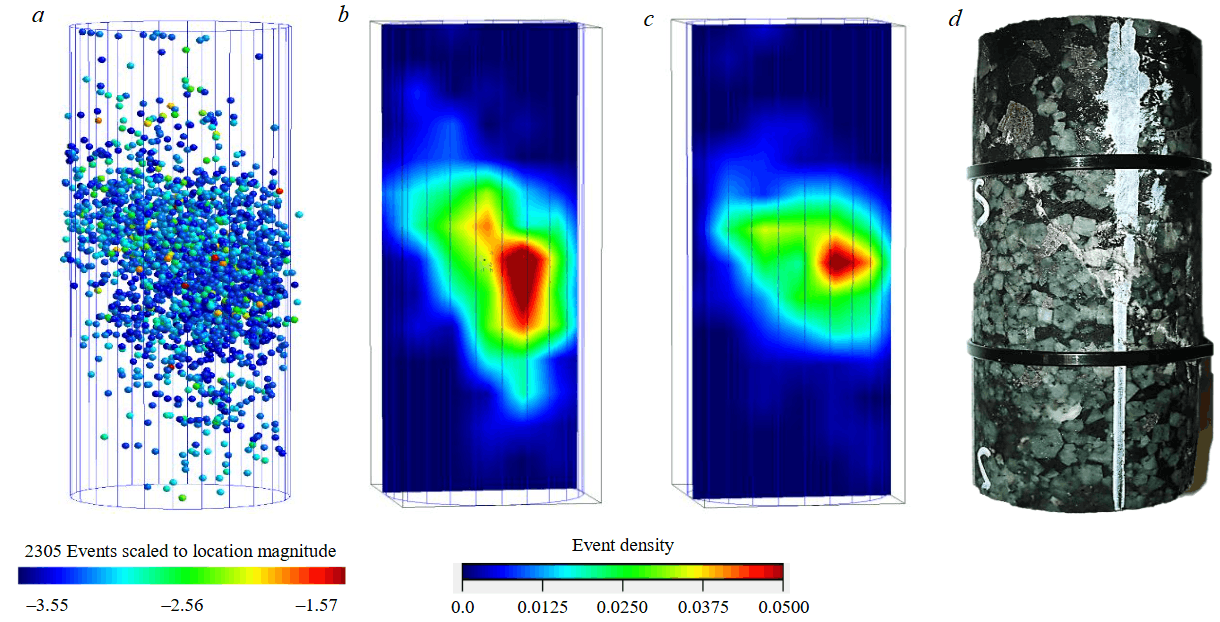
Fig.4. Analysis of the microcrack zone for coarse-grained sample C of massive texture (strength limit 341 MPa): a – distribution of AE event hypocenters for the entire test time; b – event density map, first cluster; c – event density map, second cluster; d – sample after testing
Thus, according to the distributions of AE hypocenters, a visual assessment was made of the prevailing direction of source placement for the stage of the intermediate surge of AE activity and for the main peak associated with destruction. The angle of inclination β for the line corresponding to the stage of the first peak is 34.6° (see Fig.5, a), and for the line of the second peak – 44.5° (see Fig.5, b). One can imagine the development of fracture in such a way that the fracture zone seems to unfold counterclockwise over time, this leads to a smooth curvature of the resulting fault line. This kind of turn can also be noted on the density maps (see Fig.4, b, c) of the distributions of the total number of events over the entire test period. Density maps correspond to two layers that display the distribution in different areas of the sample.
To analyze the process of crack formation over time, the activity trends and the AE b-factor were calculated. Figure 6 shows the results of calculating the activity and b-factor for sample C in a massive texture. Moreover, the activity is plotted for all location events recorded during the test, and the b-factor is only for the intervals in the area of the first and second peaks of activity. Next, the average value of the b-factor was calculated for these intervals, indicated as a level by the green line in Fig.6. This representation of information most clearly reveals the signs of uncritical and critical crack formation processes. The uncritical process of macrofracture formation corresponds to the stable state of the sample and does not lead to catastrophic destruction. In Fig.6, such a formation is designated as a sub-fracture. It is characterized by a peak of activity equal to 3.26 N/s and an average value of the b-factor in the range of 1.3. The critical process of macrofracture formation corresponds to the unstable state of the sample and leads to catastrophic destruction, characterized by a maximum value of activity and a sharp stress drop. Here, the peak of activity is 4.98 N/s, and the average value of the b-factor in this interval corresponds to 1.1. Thus, criteria of stable and unstable state in the process of cracking are identified for this sample. The stable state is characterized by a lower peak of activity and a higher average value of the b-factor. At the same time, the crack formation proceeds intensively already at a load of 59 % of the strength limit. In this interval, a sub-fracture forms at an angle β equal to 34.6° (see Fig.5, a). The unstable state leading to brittle fracture is characterized by a large peak of activity and a lower average value of the b-factor. At the same time, the fracture angle β increases to 44.5° (see Fig.5, b).
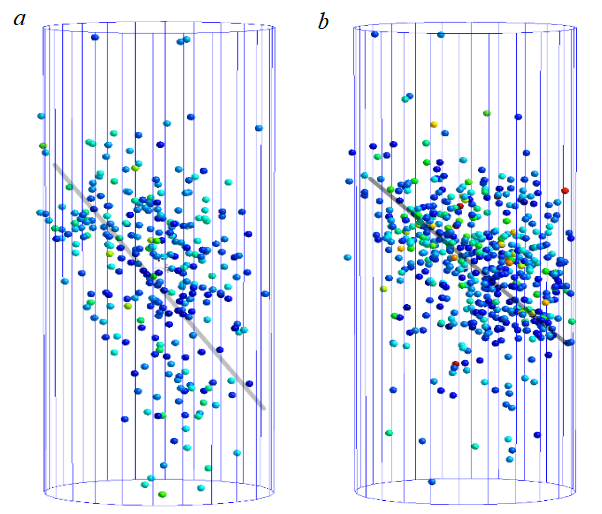
Fig.5. Decomposition of the resulting fault for sample B into two predominant directions: a – according to the distribution of hypocenters of events corresponding to the sample 4463-4767 s on the time axis, the area of the first peak of AE activity; b – according to the distribution of hypocenters of events corresponding to the sample 10,334-10,619 s on the time axis, the area of the second peak of AE activity
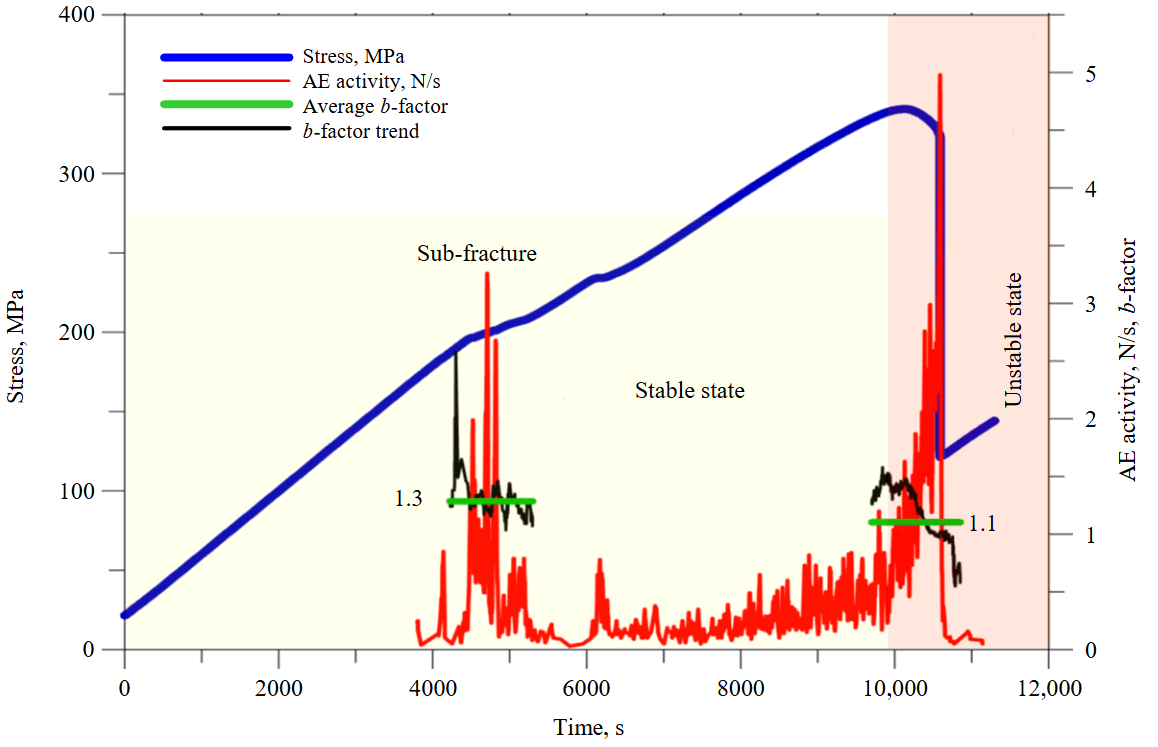
Fig.6. Trends of AE activity and b-factor for sample C in comparison with the loading curve
Discussion of results
The paper considers the features of microcrack zone formation depending on the type of rock heterogeneity. Samples A and B are characterized by textural heterogeneity: sample A has a reticulated structure (gneissic texture oriented at 50-60° to the maximum principal stress), while sample B has a banded structure (with banded heterogeneities aligned parallel to the maximum principal stress). Sample C is characterized by compositional heterogeneity, related to the uneven distribution of grains of different minerals. Using the acoustic emission source location method, it was established that these types of heterogeneity form different microcrack structures under identical loading conditions.
The destruction of sample A occurs due to the formation of a macrofracture at an angle of 51° to the axis of the sample (see Fig.2), close to the orientation of the gneissic texture. The location procedure clearly reveals the linear structure of the hypocenter distribution associated with the macrofracture (see Fig.2, a). Tomography revealed two more characteristic linear clusters of hypocenters of lower density in the lower part of the sample, located parallel to the main one (see Fig.2, b). It is obvious that they also belong to the slip sites formed by layering. Thus, it can be concluded that in sample A, the fracture is determined by the layered texture of the rock, which, under given orientation and loading conditions, causes a plastic deformation mechanism.
The fracture zone in sample B is formed in a completely different way (see Fig.3). Hypocenters have a volumetric distribution (see Fig.3, a), but with pronounced clusters (see Fig.3, b, c). Clusters are approximately described by a spherical shape. Presumably, the nature of their formation is associated with an intensive process of destruction in places of banded inclusions. The fault has the form of a strictly diagonal crack forming an angle β equal to 21°. According to the model [32], macrofracture is characterized as brittle.
Based on the activity trend (Fig.6) and the complex loading curve for sample C, the process of forming the resulting macrofracture can be divided into two stages. Given the correspondence between the events of the first activity peak stage (Fig.6) and the predominant orientation of the first line (see Fig.5, a), we assume that a sub-fracture developed during this loading interval. This sub-fracture did not lead to macroscopic failure or loss of sample stability. The angle β for this sub-fracture is estimated at 34.6°. During the interval corresponding to the second activity peak, the formation of a catastrophic fracture occurs, characterized by crack formation at an angle of 44.5° (see Fig.5, b). This counterclockwise rotation of the macrofracture during the fracture process can be physically interpreted as a decrease in the internal friction angle and deformation modulus, which can be observed on the loading curve (Fig.6) after the first activity peak. The rock becomes fractured, and its strength properties change. Studies of the strength properties of various rocks have been conducted, for example, in works [36, 37]. The distribution of events accumulated over the entire test duration has the form of a highly dispersed cloud, from which the direction of the resulting fracture cannot be discerned (see Fig.4, a). This indicates a distinct manifestation of the dilatancy property with the formation of an extensive microcrack network.
Conclusion
Laboratory investigations of the deformation and fracture processes of rock samples with various lithological types under a triaxial stress state, conducted using an MTS 815 servo-hydraulic testing system integrated with a Milne DAQ acoustic emission system, enabled the study of crack initiation and propagation over time, as well as trends in acoustic emission activity and the b-factor.
As a result, it is established:
- Under identical triaxial loading conditions, samples of different lithological types (gneissic, banded, and massive textures) form distinct microcrack structures and fracture mechanisms.
- In fine-grained samples with gneissic texture, fracture occurs through the formation of a macrofracture at an angle of 51° to the sample axis, closely aligned with the gneissic foliation. This is accompanied by the development of a plastic deformation process.
- In fine-grained samples with banded texture, fracture proceeds via the formation of a diagonal fracture, accompanied by the development of two distinct clusters. The macrofracture angle here is 21° relative to the sample axis, and the process is characterized as brittle.
- In coarse-grained samples with massive texture, fracture develops in two stages of acoustic emission activity. During the first activity peak, a sub-fracture forms at an angle β = 34.6°, which does not lead to complete failure. During the second peak, a fault forms at an angle β = 44.5°, accompanied by an extensive microcrack network. Dilatancy properties are manifested in this process.
Further experimental studies are planned under thermobaric conditions simulating great depths (up to 10 km) using a series of samples to improve the reliability of the tests and identify patterns of their destruction.
References
- Tananykhin D., Korolev M., Stecyuk I., Grigorev M. An Investigation into Current Sand Control Methodologies Taking into Account Geomechanical, Field and Laboratory Data Analysis. Resources. 2021. Vol. 10. Iss. 12. N 125. DOI: 10.3390/resources10120125
- Zhukov V.S., Kuzmin Yu.O. Experimental evaluation of compressibility coefficients for fractures and intergranular pores of an oil and gas reservoir. Journal of Mining Institute. 2021. Vol. 251, p. 658-666. DOI: 10.31897/PMI.2021.5.5
- Bosikov I.I., Klyuev R.V., Gavrina O.A. Analysis of geological-geophysical materials and qualitative assessment of the oil and gas perspectives of the Yuzhno-Kharbizhinsky area (Northern Caucasus). Geology and Geophysics of Russian South. 2021. Vol. 11. N 1, p. 6-21 (in Russian). DOI: 10.46698/VNC.2021.36.47.001
- Petrakov D.G., Kupavykh K.S., Kupavykh A.S. Experimental study of elastic-plastic properties of oil reservoir rocks with account of saturation. Construction of oil and gas wells on land and sea. 2020. N 3 (327), p. 33-38 (in Russian). DOI: 10.33285/0130-3872-2020-3(327)-33-38
- Glassley W.E. Geothermal Energy. Renewable Energy and the Environment. CRC Press, 2010, p. 320. DOI: 10.1201/EBK1420075700
- Krumbholz J.F., Krumbholz M., Wadas S.H., Tanner D.C. Characterisation of the fracture- and karst-controlled geothermal reservoir below Munich from geophysical wireline and well information. Geothermal Energy. 2024. Vol. 12. N 9. DOI: 10.1186/s40517-024-00286-6
- Kashnikov Yu.A., Shustov D.V., Yakimov S.Yu. Consideration of the geomechanical state of a fractured porous reservoir in reservoir simulation modelling. Journal of Mining Institute. 2025. Vol. 271, p. 42-52.
- Putilov I.S., Vinokurova E.E., Guliaeva A.A. et al. Conceptual Geological Modelling based on Lithological and Petrographic Studies (The Case of the Permo-Carboniferous Deposit of the Usinskoye Field). Perm Journal of Petroleum and Mining Engineering. 2020. Vol. 20. N 3, p. 214-222 (in Russian). DOI: 10.15593/2712-8008/2020.3.2
- Dvoynikov M.V., Sidorkin D.I., Kunshin A.A., Kovalev D.A. Development of Hydraulic Turbodrills for Deep Well Drilling. Applied Sciences. 2021. Vol. 11. Iss. 16. N 7517. DOI: 10.3390/app11167517
- Kucherov V.G., Bessel V.V. Challenges and risks of deep and super deep drilling. Burenie i neft. 2020. N 3, p. 12-16 (in Russian).
- Protosenya A.G., Verbilo P.E., Karasev M.A. Research of the mechanical characteristics’ anisotropy of apatite-nepheline ores block rock mass. International Journal of Mechanical Engineering and Technology. 2018. Vol. 9. Iss. 11, p. 1962-1972.
- Trushko V.L., Protosenya A.G., Verbilo P.E. Predicting strength of pillars in fractured rock mass during development of apatite-nephelinic ores. ARPN Journal of Engineering and Applied Sciences. 2018. Vol. 13. N 8, p. 2864-2872.
- Verbilo P.E., Iovlev G.A., Belyakov N.A. Parameter selection for the Hoek-Brown model with softening of rock mass based on laboratory experiments on rock samples and discrete numerical simulations of jointed rock mass. Mining Informational and Analytical Bulletin. 2025. N 2, p. 57-77 (in Russian). DOI: 10.25018/0236_1493_2025_2_0_57
- Ilyinov M.D., Petrov D.N., Karmanskiy D.A., Selikhov A.A. Physical simulation aspects of structural changes in rock samples under thermobaric conditions at great depths. Mining Science and Technology. 2023. Vol. 8. N 4, p. 290-302. DOI: 10.17073/2500-0632-2023-09-150
- Tongwen Jiang, Wei Yao, Xiongwei Sun et al. Evolution of anisotropic permeability of fractured sandstones subjected to true-triaxial stresses during reservoir depletion. Journal of Petroleum Science and Engineering. 2021. Vol. 200. N 108251. DOI: 10.1016/j.petrol.2020.108251
- Kozyrev A.A., Kuznetcov N.N., Shokov A.N. Rockburst hazard assessment of hard rocks in the Zhdanovskoe deposit (Kola Peninsula). Russian Mining Industry. 2022. N 6, p. 75-82 (in Russian). DOI: 10.30686/1609-9192-2022-6-75-82
- Hofmann H., Babadagli T., Jeoung Seok Yoon et al. A grain based modeling study of mineralogical factors affecting strength, elastic behavior and micro fracture development during compression tests in granites. Engineering Fracture Mechanics. 2015. Vol. 147, p. 261-275. DOI: 10.1016/j.engfracmech.2015.09.008
- Karasev M.A., Petrushin V.V., Rysin A.I. The hybrid finite/discrete element method in description of macrostructural behavior of salt rocks. Mining Informational and Analytical Bulletin. 2023. N 4, p. 48-66 (in Russian). DOI: 10.25018/0236_1493_2023_4_0_48
- Dresen G., Kwiatek G., Goebel T., Ben-Zion Y. Seismic and Aseismic Preparatory Processes Before Large Stick–Slip Failure. Pure and Applied Geophysics. 2020. Vol. 177. Iss. 12, p. 5741-5760. DOI: 10.1007/s00024-020-02605-x
- Damaskinskaya E.E., Hilarov V.L., Nosov Yu.G. et al. Defect structure formation in quartz single crystal at the early stages of deformation. Physics of the Solid State. 2022. Vol. 64. Iss. 4, p. 451-457. DOI: 10.21883/PSS.2022.04.53500.262
- Hilarov V.L., Damaskinskaya E.E. Modeling of fracture and acoustic emission in pol-ycrystalline solids with the discrete elements method. Physics of the Solid State. 2022. Vol. 64. Iss. 6, p. 664-669. DOI: 10.21883/PSS.2022.06.54369.295
- Davidsen J., Goebel T., Kwiatek G. et al. What Controls the Presence and Characteristics of Aftershocks in Rock Fracture in the Lab? Journal of Geophysical Research: Solid Earth. 2021. Vol. 126. Iss. 10. N e2021JB022539. DOI: 10.1029/2021JB022539
- Sheng-Qi Yang, Jing Yang, Zong-Long Mu et al. Experimental Study on Mechanical Behavior, Fracture Characteristics, and Acoustic Emission Damage Characteristics of Sandstone Under Triaxial Multistage Stress Disturbance. Rock Mechanics and Rock Engineering. 2024. Vol. 57. Iss. 10, p. 8633-8655. DOI: 10.1007/s00603-024-03994-4
- Jianfeng Liu, Yang Wu, Junjie Liu et al. Acoustic emission evolution and fracture mechanism of rock for direct tensile failure. International Journal of Rock Mechanics and Mining Science. 2025. Vol. 185. N 105974. DOI: 10.1016/j.ijrmms.2024.105974
- Boese C.M., Kwiatek G., Plenkers K. et al. Performance Evaluation of AE Sensors Installed Like Hydrophones in Adaptive Monitoring Networks During a Decametre-Scale Hydraulic Stimulation Experiment. Rock Mechanics and Rock Engineering. 2023. Vol. 56. Iss. 10, p. 6983-7001. DOI: 10.1007/s00603-023-03418-9
- Rasskazov M.I., Tereshkin A.A., Tsoi D. I. et al. Assessment of geomechanical behavior of rock mass by the data of seismic monitoring with acoustic sensing at rockburst-hazardous deposits. Mining Informational and Analytical Bulletin. 2021. N 12-1, p. 167-182 (in Russian). DOI: 10.25018/0236_1493_2021_121_0_167
- Loseva E., Lozovsky I., Zhostkov R. Refining Low Strain Pile Integrity Testing for Minor Flaw Detection with Complex Wavelet Transform. Civil Engineering Journal. 2024. Vol. 10. N 10, p. 3194-3207. DOI: 10.28991/CEJ-2024-010-10-05
- Shuting Miao, Peng-Zhi Pan, Arno Zang et al. Laboratory Shear Behavior of Tensile- and Shear-Induced Fractures in Sandstone: Insights from Acoustic Emission. Rock Mechanics and Rock Engineering. 2024. Vol. 57. Iss. 8, p. 5397-5413. DOI: 10.1007/s00603-024-03780-2
- Davis R.O., Selvadurai A.P.S. Plasticity and Geomechanics. Cambridge University Press, 2002. 287 p. DOI: 10.1017/CBO9780511614958
- Jie Li, Mingyang Wang, Kaiwen Xia et al. Time-dependent dilatancy for brittle rocks. Journal of Rock Mechanics and Geotechnical Engineering. 2017. Vol. 9. Iss. 6, p. 1054-1070. DOI: 10.1016/j.jrmge.2017.08.002
- Stanchits S., Yarushina V., Sabitova A. et al. Dilatancy in Shale During a Creep Monitored by Volumetric Deformation, Acoustic Emission, and Ultrasonic Transmission Techniques. 85th EAGE Annual Conference & Exhibition. 2024. Vol. 2024, p. 5. DOI: 10.3997/2214-4609.202410540
- Reches Z., Lockner D.A. Nucleation and growth of faults in brittle rocks. Journal of Geophysical Research: Solid Earth. 1994. Vol. 99. Iss. B9, p. 18159-18173. DOI: 10.1029/94JB00115
- Pollard D.D., Segall P. Theoretical displacements and stresses near fractures in rock: with applications to faults, joints, veins, dikes, and solution surfaces. Fracture Mechanics of Rock. Academic Press, 1987, p. 277-349. DOI: 10.1016/B978-0-12-066266-1.50013-2
- Gutenberg B., Richter C.F. Frequency of earthquakes in California. Bulletin of the Seismological Society of America. 1944. Vol. 34. N 4, p. 185-188. DOI: 10.1785/BSSA0340040185
- Trushko V.L., Rozanov A.O., Saitgaleev M.M. et al. Acoustic emission criteria for analyzing the process of rock destruction and evaluating the formation of fractured reservoirs at great depths. Journal of Mining Institute. 2024. Vol. 269, p. 848-858.
- Stavrogin A.N., Protosenya A.G. Rock Deformation and Fracture Mechanics. Мoscow: Nedra, 1992, p. 224.
- Kozyrev A.A., Kasparyan E.V., Kuznetcov N.N., Shokov A.N. Analysis of the hard rock failure conditions in dynamic form under triaxial compression. Naukosfera. 2020. N 11 (2), p. 77-85 (in Russian). DOI: 10.5281/zenodo.4309363