
Assessment of reliability parameters for workshop power supply circuits in mining enterprises with single-transformer substations under various redundancy methods
- 1 — Postgraduate Student Kazan State Power Engineering University ▪ Orcid
- 2 — Ph.D., Dr.Sci. Professor Kazan State Power Engineering University ▪ Orcid
Abstract
With the increasing complexity of electrical equipment in mining enterprises, the development and analysis of methods to enhance the reliability of technical devices within power supply systems are becoming increasingly relevant. This article focuses on assessing the reliability parameters of workshop network circuits in mining enterprises equipped with single-transformer substations operating at 10 and 0.4 kV, considering various redundancy methods. Research objective is to evaluate the reliability parameters of different redundancy methods for power supply circuits in facilities with transformer substations at medium voltage (MV) and low voltage (LV), with respect to low-voltage switchgear consumers in mining operations. Research target is the power supply system of an auxiliary production workshop at a mining enterprise (Kemerovo). The study examines the following network reliability parameters: probability of failure-free (normal) operation, P(t); probability of failure occurrence, Q(t); failure flow rate, ωcircuit; time between failures (TBF), ТTBF. The analysis covers the following circuit configurations: without redundancy; with redundancy at MV; with redundancy at LV; with dual redundancy (at both MV and LV). Estimation results indicate that the TBF for the nonredundant circuit is 2.04 times lower than for the LV redundancy circuit, 2.11 times lower than for the MV redundant circuit, and 2.8 times lower than for the dual redundant circuit. Redundancy proves to be a technically and economically justified method for improving the P(t) parameter of the facility’s power supply system. The obtained results can be integrated into power supply system design (to optimize structural circuits and select rational redundancy methods for components), maintenance program development (to develop justified maintenance and repair schedules), reliability monitoring system development (to enable continuous monitoring of equipment status in mining enterprise workshops).
None
Introduction
With the increasing complexity of process and electrical equipment in mining enterprises, the development and analysis of methods to enhance the reliability of technical devices within power supply systems (PSS) become topical issues. The reliability of PSS equipment operation can be assessed both at early stages (design, reconstruction) and after equipment commissioning [1-3]. A necessary condition for obtaining valid results in reliability parameter estimations is ensuring compliance with methodological and informational error requirements [4]. It is known that electrical equipment components of workshop PSS in mining enterprises can be either repairable after failure or non‑repairable [5].
Ensuring the reliability and failure‑free operation of electrical installations is achieved by complying with regulated storage conditions, normal operating modes, and requirements for maintenance and repair [6, 7].
The relevance of this issue stems from the continuous growth in electricity consumption at mining and dressing enterprises, coupled with the increasing complexity of structural and topological characteristics of PSS. This complexity manifests itself in a growing number of circuit elements and increa-singly intricate functional interconnections between them. These factors create prerequisites for deve-loping new methodologies to estimate the reliability of complex, highly interconnected systems [8, 9]. In particular, study [10] focuses on analysing the key reliability parameters and performance indicators of electrical equipment at industrial facilities in Kazan.
Methodological foundations for reliability analysis of electrotechnical complexes applied to load nodes involve developing algorithms to determine probabilities of failure occurrence and that of failure-free system operation [11-13]. As structural interconnections between elements become more complex, traditional methods of transforming design circuits into series-parallel or parallel-series configurations become inapplicable [14-16].
Specific features are inherent to “bridge” [17] and “double bridge” circuit types, for which the rules of series-parallel or parallel-series reliability circuit transformations do not apply. For such cases, special analysis methods are required, including logical-probabilistic methods, graph theory, matrix calculation methods, and numerical simulation via the Monte Carlo method [18, 19]. A promi-sing direction is the development of combined algorithms that integrate analytical approaches and mathematical modelling. This is especially relevant for complex, multi-level PSS at mining enterprises.
The development of electrical system equipment necessitates improving the reliability of electrical installations and PSS as a whole [20]. This objective is achieved through refining design methods using software solutions as well as developing new types of electrical installations. An analysis of failure causes and defects in low-voltage equipment at mining enterprises reveals that ~40-45 % of total failures result from design errors, 20 % from manufacturing errors, 30 % are caused by harsh operating conditions, unacceptable operating modes, or improper maintenance, ~5-7 % are due to natural wear and equipment aging [9, 21].
The literature presents the following methods for assessing reliability parameters of single-transformer substations: development of a system model that integrates economic indicators and failure characteristics [22, 23]; method for evaluating the reliability of power supply to consumers, enabling electricity quality management based on network equipment condition data [24]; quantitative risk assessment method for power supply interruptions using Bayesian networks, which identifies factors affecting power system reliability [25]; implementation of automatic blocking in distribution networks through node optimization, along with reliability analysis of power supply in distribution networks by blocks [26]; creation of a comprehensive reliability management model for accurate prediction of power system behaviour [27]; optimization of PSS maintenance schedules, accompanied by analysis of reliability parameters for distribution network components [28, 29]; statistical method for power system reliability assessment, accounting for operational conditions through Monte Carlo simulation and development of probabilistic reliability models [30, 31].
Energy and resource conservation are among the priority tasks [32, 33] in managing energy-intensive mining production. Measures aimed at improving energy efficiency and conservation, which are being implemented in PSS of mining enterprises [34, 35], can be conventionally categorized into the following areas: electrical networks; electric drives; monitoring and accounting of electricity consumption [36, 37].
Research objective is to assess the reliability parameters of various redundancy methods for power supply circuits in PSS of facilities with transformer substations operating at medium voltage (MV) and low voltage (LV), with respect to low‑voltage switchgear consumers in mining enterprises [38-40]. Scientific novelty of the proposed method introduces development and construction of a reliability logic diagram that accounts for each type of equipment, simplification of the diagram in accordance with reliability theory, incorporating statistical data on probabilistic characteristics of each component, as well as estimation of the total failure flow rate and failure‑free operation time for the circuit that differs from existing methods by explicitly considering elements of the 0.4 kV network, including low‑voltage switching devices. Research target is the PSS of an auxiliary production workshop at a mining enterprise (Kemerovo).
Methods
The study examines the following types of electrical circuits:
- Without redundancy.
- With LV redundancy (by installing a 0.4 kV bypass jumper).
- With MV redundancy (by installing disconnectors, S), without LV redundancy.
- With dual redundancy at both MV and LV levels.
Analysis of failure statistics leads to the conclusion that the reliability parameters of the circuit conform to the exponential distribution law [5].
The key reliability indicators for PSS circuit elements include:
- failure flow rate
defined by the probability of failure occurrence Q(t, Δt) in the time interval t, Δt;
- probability of failure‑free (normal) operation
- probability of failure occurrence;
- time between failures
Discussion
The study examines the reliability parameters of four possible variants of circuit redundancy.
Diagram of the network section without redundancy (Fig.1, a). Figure 1, b, c shows the structural reliability diagram without redundancy and its transformation. All elements are connected in series, and the failure of any one element leads to loss of operability of the entire system. The efficiency of such a circuit depends, firstly, on the initial state parameters and, secondly, on the probabilistic sequence of element (node) failures.
Failure flow rate for the power supply source-to-load circuit (Fig.1, b, c) for the nonredundant circuit section:
The failure flow rate of the cable line ωL10kV (SKl-10 kV) depends on its length and is estimated based on the specific parameter per 1 km: ωL1 = 0.01(100 m/1000 m) = 0.001 failures/year.
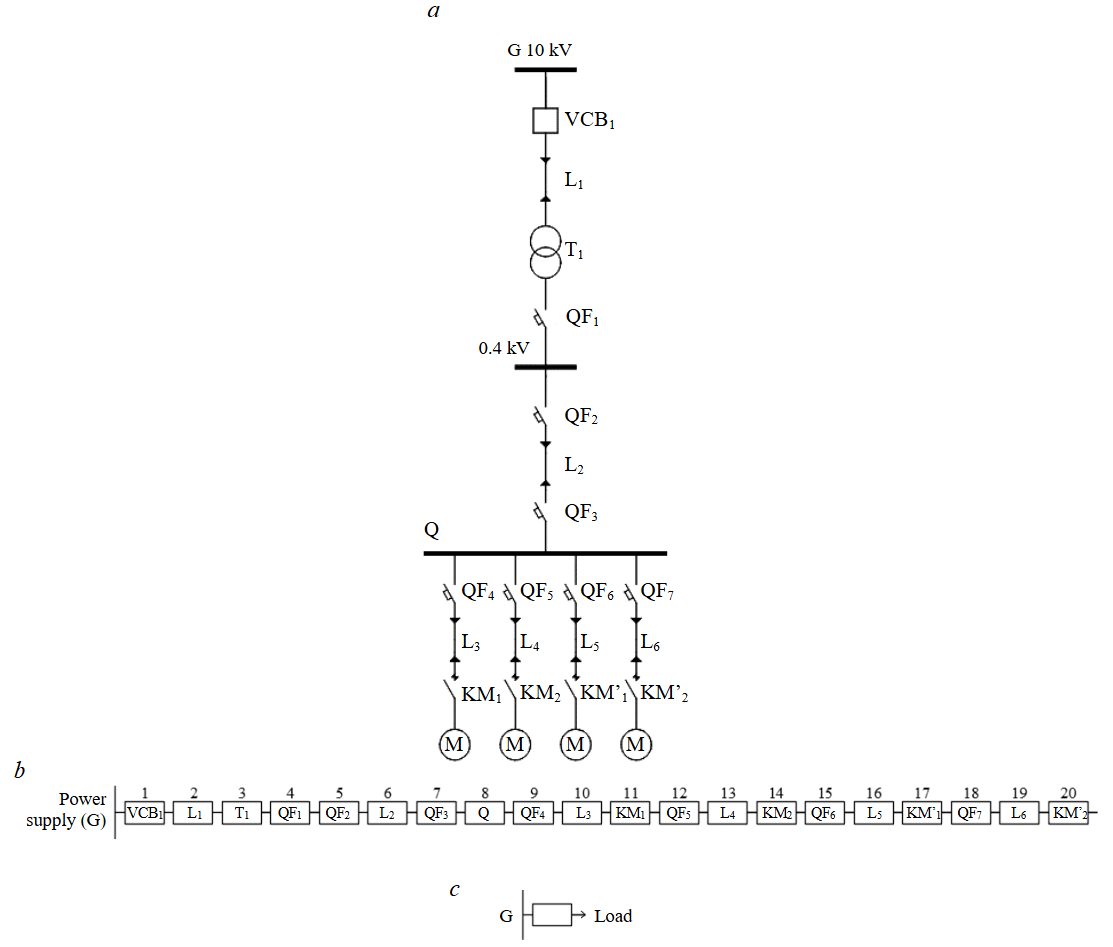
Fig.1. Diagram of a network section without redundancy (a), logical reliability diagram without redundancy (b), and its transformation
The failure flow rate of the ωL0.4kV cable line (AVVG-0.4 kV) is estimated similarly:
- for L2
ω = 0.026 (10 m/100 m) = 0.0026 failures/year;
- for L3...L6
ω = 0.026 (5 m/100 m) = 0.0013 failures/year.
Table 1 presents the basic and estimated characteristics of the equipment (Fig.1, a), based on an analysis of product catalogues from companies manufacturing high-voltage electrical equipment and apparatus: Vysokovoltnyy Soyuz LLC; Unkomtech Trading House LLC (cable and wiring products); ELTECHKOM LLC (high-voltage equipment); KEAZ JSC (electrical pro-ducts); “Absolutenergo” (electrical products); EXPERT CABLE (cable and wiring products).
Table 1
Specifications of the equipment and estimation results for the failure flow rate ω of the circuit elements
|
Elements |
Grade, manufacturer |
ω, failures/year |
|
VCB1 |
VRS-10, Vysokovoltnyy Soyuz LLC |
0.015 |
|
L1 |
SKl-10kV, cross-section 70 mm2, length 100 m, Unkomtekh Trading House LLC |
0.001 |
|
T1 |
TM-1600/10/0.4, ELTECHKOM LLC |
0.015 |
|
QF1, QF2, QF3 |
VA51-39, Kursk Electrical Equipment Plant JSC (KEAZ) |
0.051 |
|
QF4, QF5, QF6, QF7 |
VA51-35, KEAZ JSC |
0.051 |
|
Q |
ShRS-1, “Absolutenergo” |
0.001 |
|
L2 |
AVVG-0.4 kV, cross-section 16 mm2, length 10 m, EXPERT CABLE |
0.026 |
|
L3, L4, L5, L6 |
AVVG-0.4 kV, cross-section 4 mm2, length 5 m, EXPERT CABLE |
0.0013 |
|
KM1, KM2 |
PML-1100, KEAZ JSC |
0.095 |
|
KM’1, KM’2 |
KT-6000, KEAZ JSC |
0.098 |
Thus,
Diagram of a network section with LV redundancy (with a 0.4 kV bypass jumper) (Fig.2). Redundancy is a method for increasing the reliability of electrical installations, based on replacing a failed unit with a backup one. The main redundancy methods:
- Element-level (component-level) – redundancy of individual system components (transformers, circuit breakers, cable lines, etc.).
- Group (modular) – redundancy of functional equipment groups (transformer, circuit breaker, cable line).
- General (system-wide) redundancy – full duplication of the PSS.
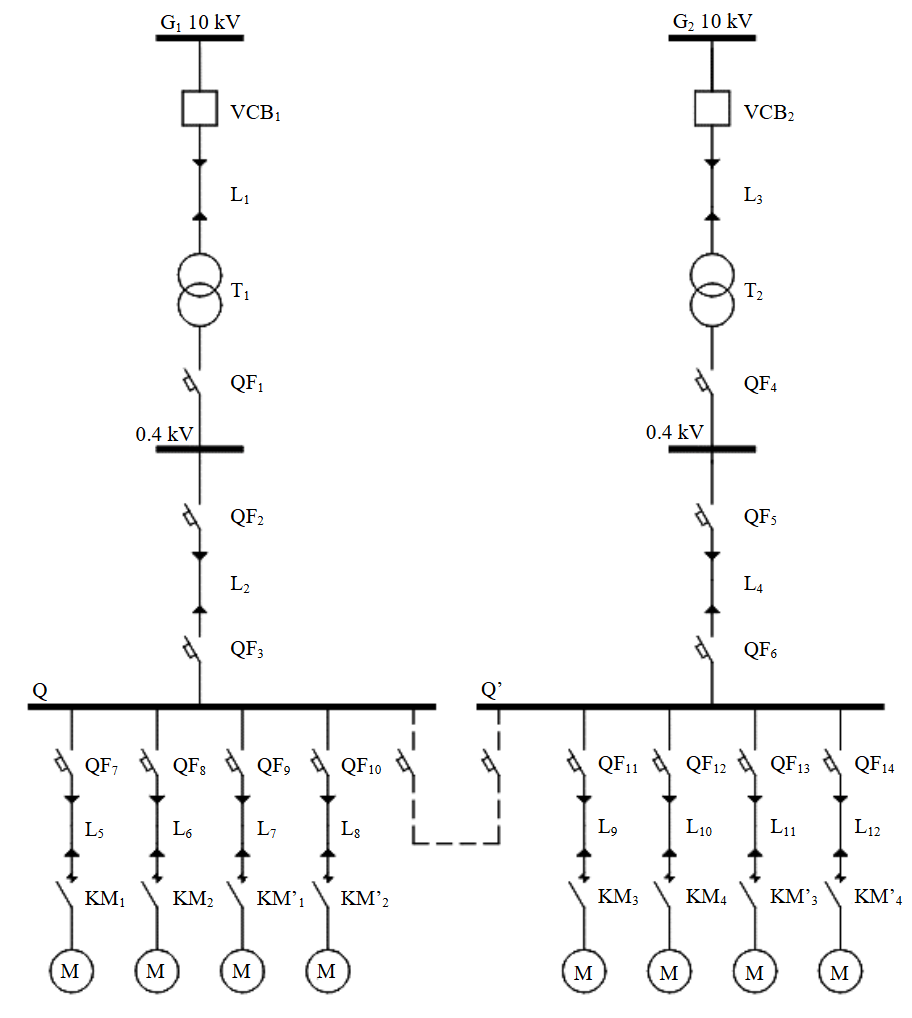
Fig.2. Diagram of a network section with LV redundancy
For the electrical supply circuit of the first bus section with an installed LV 0.4 kV bypass jumper (b/jump) (Fig.2), the reliability logic diagram consists of two series operational circuits connected in parallel by the b/jump element (Fig.3).
The first stage involves transforming the series branches (Fig.3, b).
The failure flow rate for the G1-b/jump circuit is:
The failure flow rate for the G2-b/jump circuit is
The bypass jumper includes two automatic circuit breakers and a 0.4 kV cable line. The failure flow rate of the b/jump is:
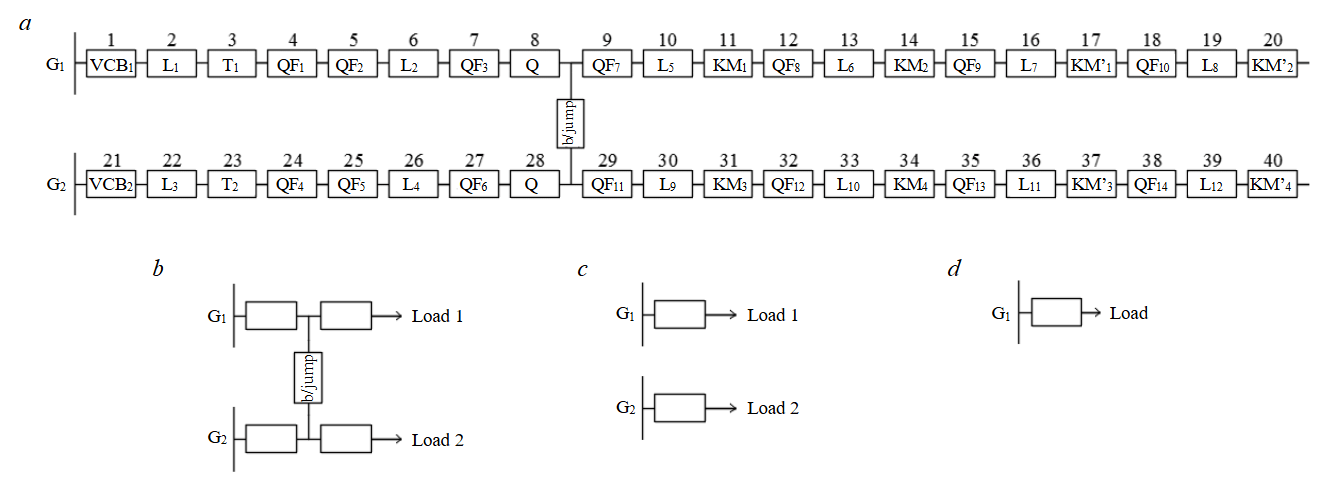
Fig.3. Logical reliability diagram for a network section with LV redundancy (a), transformation stages: first (b), second (c), and third (d)
Failure flow rate of the b/jump-load1 circuit:
Failure flow rate of the b/jump-load2 parallel circuit:
The second stage is presented in Fig.3, c.
Failure flow rate of the G1-load1 circuit:
Failure flow rate of the G2-load2 parallel circuit:
At the third stage, it is necessary to estimate the probabilities of failure occurrence for the series branches. Probabilities of failure-free operation of the circuits:
Probabilities of failure occurrence for the circuits:
The third stage involves transforming the parallel branches G1-load1 and G2-load2.
Probability of failure occurrence for a circuit with two parallel-connected elements:
Probability of failure‑free operation of the circuit:
Knowing Pcircuit, one can determine the failure flow rate for a system with two parallel‑connected elements, as well as the time between failures:
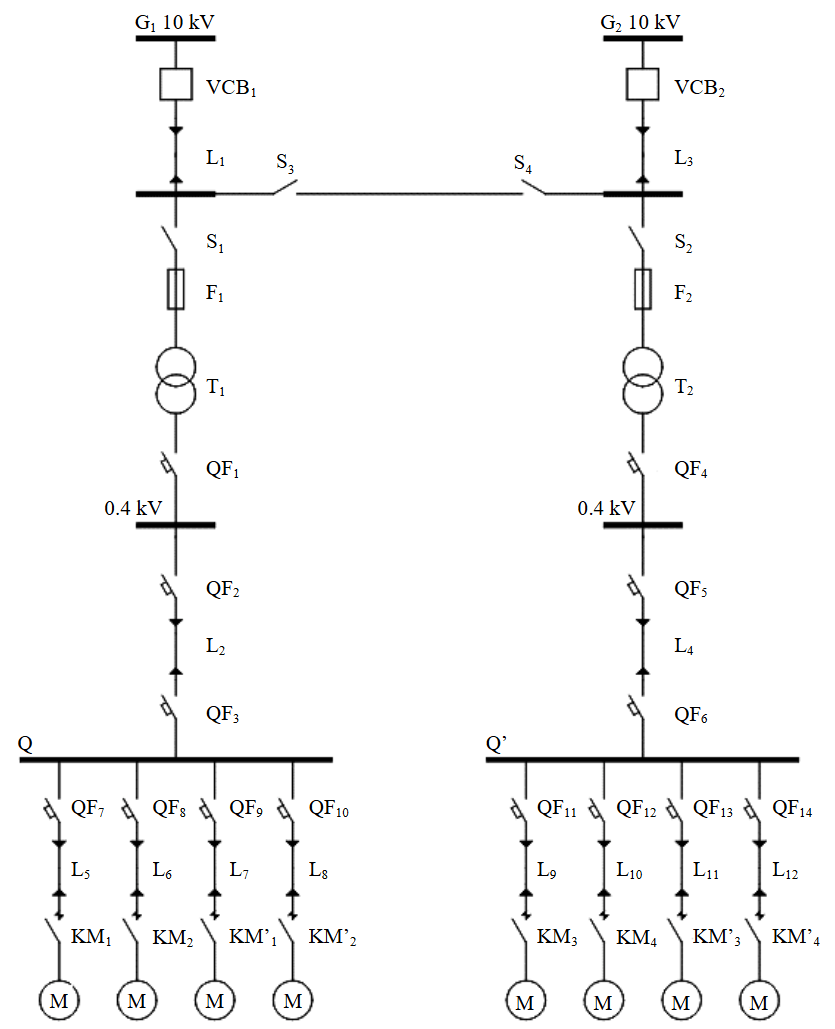
Fig.4. Circuit with MV redundancy and no LV redundancy
Logic diagram with redundancy at the MV line (with disconnectors S3 and S4 installed), without redundancy at LV. Figure 4 shows a looped circuit variant. In cases of low power supply source (G) capacity, remote location, or uneconomical operation, the power supply source is considered a backup one and is activated when the main power source is disconnected. If the power sources are equivalent, power is supplied from each source.
In case of a fault on one of the lines, power to the consumers of that line is disconnected via disconnectors S3 and S4, while the adjacent sections of the circuit remain operational.
The reliability probabilistic logic diagram (Fig.5) comprises two series operational circuits (G1-load1, G2-load2) connected by a parallel branch of elements S3-L-S4.
The reliability logic diagram and transformation stages are similar to those presented in Fig.3.
Redundancy of the MV line is provided by two disconnectors (S3, S4) and a cable line (L). The failure flow rate of the bypass jumper (b/jump):
The probabilities of failure occurrence and failure‑free operation for the circuit (Fig.5, c):
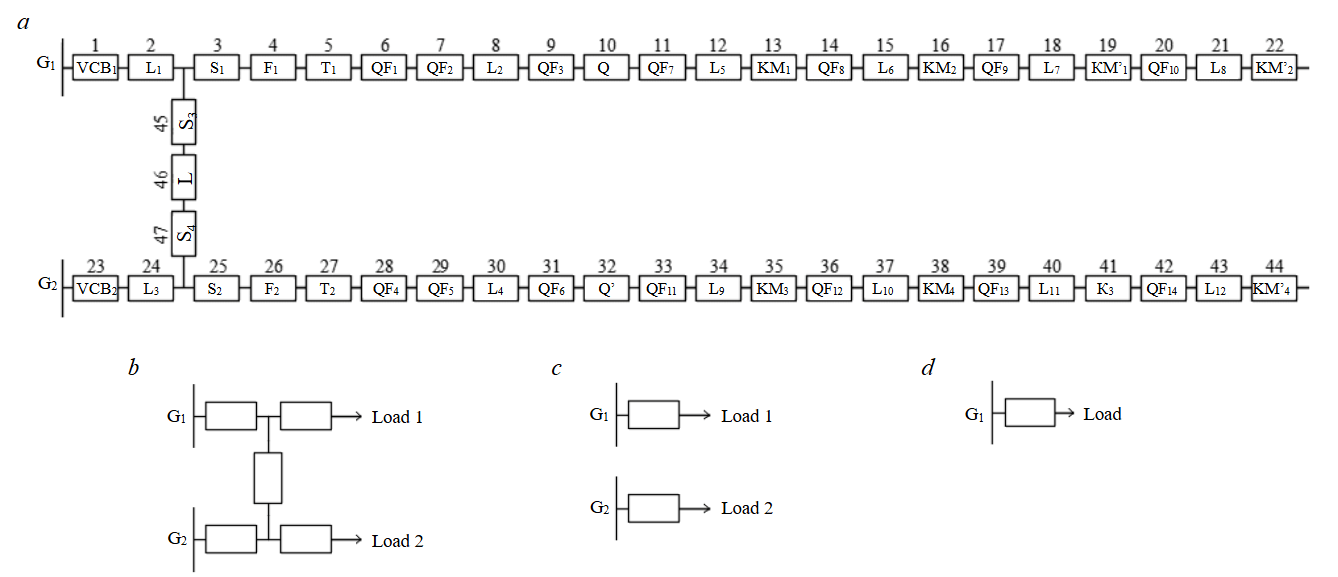
Fig.5. Reliability logic diagram for a network section with MV line redundancy and no LV redundancy (a), transformation stages: first (b), second (c), and third (d)
The failure flow rate and time between failures:
Diagram of a network section with double redundancy (with redundancy at MV and LV, installation of disconnectors S3 and S4, and a 0.4 kV bypass jumper). Figure 6 shows a section of a circular circuit. The circular circuit must be connected to at least two geographically remote, independent power sources. The circular circuit ensures reliable power supply and allows for future network expansion as consumer loads increase. For power supply to consumers of reliability categories I and II, looped, circular, and combined circuits are used; a single transformer may be installed at the transformer substation (Fig.6, T1, T2). For power supply to areas with consumers of reliability category I and II, a combined loop circuit is recommended; for areas with consumers of category III, a looped circuit is used (see Fig.2, 4).
In the normal operation mode of the circular circuit (Fig.6), the MV line is open via disconnectors S3 and S4, and each section of the circuit is powered independently from the power source. The 0.4 kV bypass jumper must remain energized when the MV section is open.
Figure 7 shows the reliability logic diagram for the double‑redundancy configuration.
The first transformation stage consists of equivalent substitution of the series branches of the original circuit (Fig.7, a):
The probability of failure‑free operation is then estimated:
then the probability of failure is:
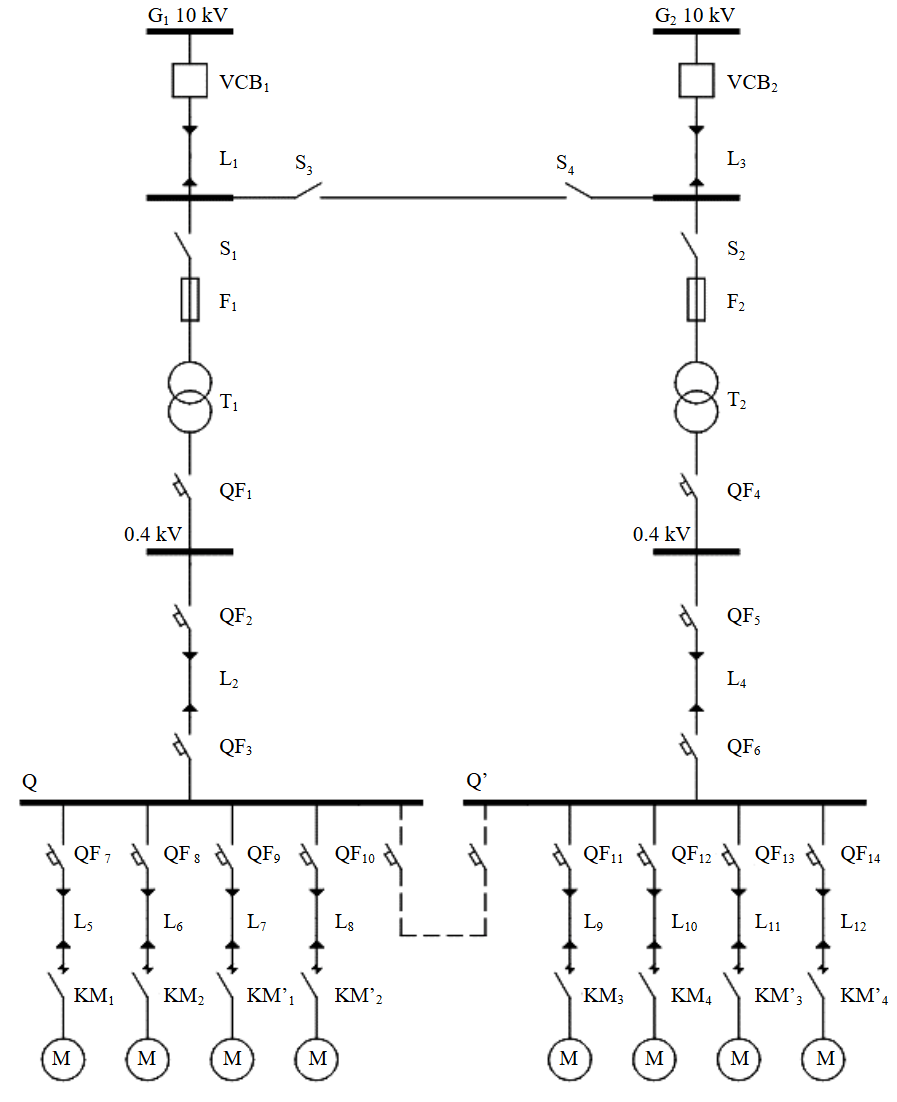
Fig.6. Diagram of a network section with dual redundancy at MV and LV
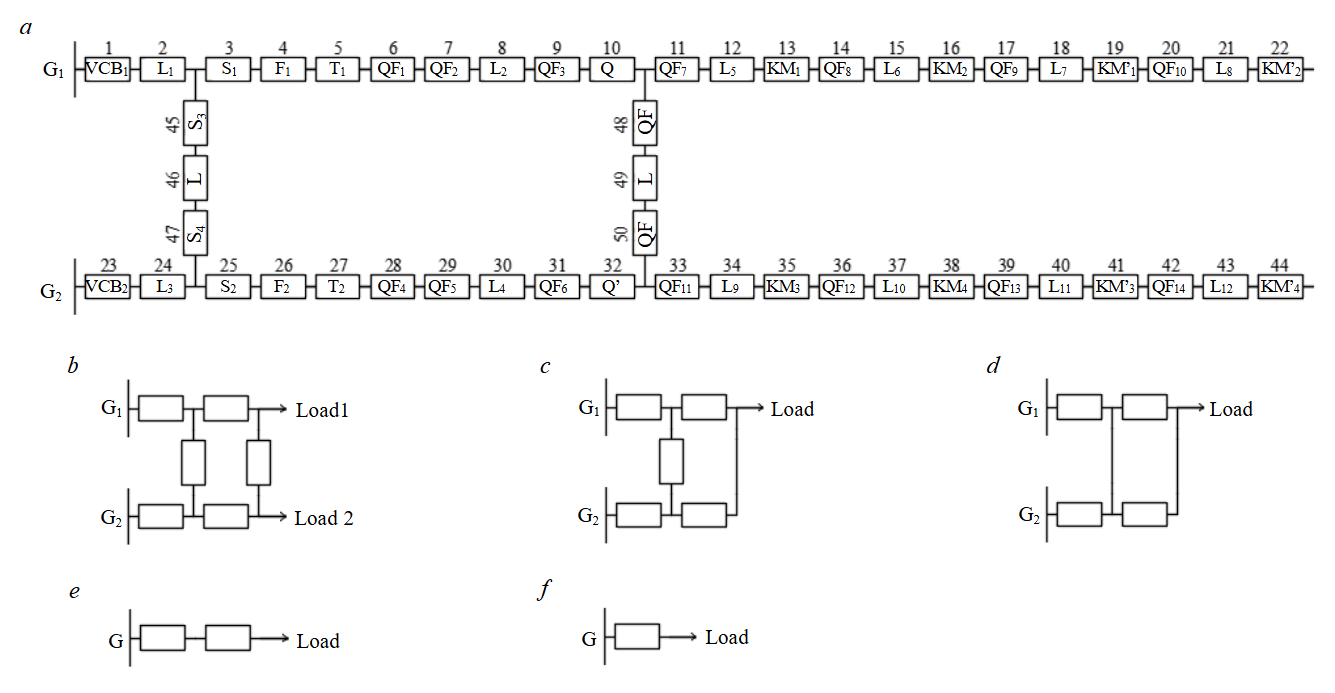
Fig.7. Reliability logic diagram of a network section with dual redundancy (a), transformation stages: first (b), second (c), third (d), fourth (e), fifth (f)
The probability of simultaneous failure of the parallel elements G1-L1 and G2-redund (Fig.7, d) is determined as the product of the probabilities of failure of these elements
The probability of failure‑free operation of the parallel elements G1-L1 и G2-redund is:
then the failure flow rate is:
Similar estimations are performed for the parallel branch S1-Q and S2-b/jump.
After transforming the series elements of the circuit (Fig.7, e, f), the failure flow rate is:
Time between failures is:
Table 2 presents the data for determining the failure flow rate and time between failures (see Fig.1, a, 2, 4, 6).
Table 2
Data for determining the failure rate parameter and time between failures
|
Type of circuit redundancy |
ωcircuit, failures/year |
ТTBF, year |
|
Without redundancy |
0.78280 |
1.27750 |
|
With 0.4 kV b/jump connection |
0.38420 |
2.60280 |
|
With 10 kV b/jump connection, without 0.4 kV b/jump |
0.37110 |
2.69470 |
|
With both 10 and 0.4 kV b/jump |
0.27940 |
3.57910 |
The data in Table 2 show that the ωcircuit rate of the nonredundant circuit is 0.78280. It decreases by a factor of 2.04 when a 0.4 kV bypass jumper is connected, reaching a value of 0.3842. When the MV circuit is redundant, ωcircuit = 0.3711. With double redundancy, the failure flow rate decreases to ωcircuit = 0.2794, which is nearly three times lower than for the nonredundant circuit. These results demonstrate the high reliability of the double‑redundant circuit with the same number of element connections to the line.
The time between failures (ТTBF) is inversely proportional to the circuit’s failure flow rate (ωcircuit). The research results showed:
- the ratio of ТTBF for the LV‑redundant circuit to ТTBF for the nonredundant circuit is 2.6028 : 1.2775 = 2.0374;
- the ratio of ТTBF for the MV‑redundant circuit to ТTBF for the nonredundant circuit is 2.6947 : 1.2775 = 2.1093;
- the ratio of ТTBF for the double‑redundant circuit to ТTBF for the nonredundant circuit is 3.5791 : 1.2775 = 2.8016.
These results are recommended for use in the feasibility study when selecting workshop power supply circuits.
Conclusion
To improve the accuracy of determining reliability parameters for assessing power supply systems at mining industry facilities, it is necessary to consider the causes of potential equipment failures; preventive measures (eliminating known failure causes, optimizing equipment load characteristics); and dependencies between external impacts and reliability indicators.
Redundancy of any electrical equipment elements enhances power supply reliability. However, for the industrial facility under study in Kemerovo, this solution is being proposed for the first time. Similar redundant circuits are used for thermal power plant auxiliary systems, where medium-voltage redundancy is particularly relevant. The estimations proved that redundancy allows increasing the time between failures by a factor of 2.11 with low-voltage or medium‑voltage redundancy and by a factor of 2.8 with double redundancy.
The research showed that the failure flow rate for the low‑voltage redundant circuit (ωcircuit = = 0.3842) is higher than that for the double‑redundant circuit (MV and LV, ωcircuit = 0.2794), with the same number of element connections to the line. We found that the reliability of the redundant circuit is significantly higher than that of the nonredundant circuit (ωcircuit = 0.7828) under the same load.
The time between failures reaches its maximum value with double redundancy (ТTBF = 3.5791) and its minimum value for the nonredundant circuit (ТTBF = 1.2775). The estimation data show that the TBF of the nonredundant circuit is 2.04 and 2.11 times less than for circuits with redundancy on the low voltage and medium voltage, respectively, and 2.8 times less than for a circuit with double redundancy.
The obtained results can be applied in the design and reconstruction of power supply systems; for feasibility study when selecting optimal circuit variants, including comparative analysis of circuit variants considering capital and operating costs; for estimation of the economic benefit from implementing redundant systems; assessment of the equipment’s life cycle cost, considering reliability indicators; in developing measures to improve the quality and efficiency of electrical equipment operation at mining enterprises.
References
- Bagautdinov I.Z. Reliability estimation. Teoriya i praktika sovremennoj nauki. 2017. N 4 (22), p. 96-99 (in Russian).
- Ivanova S.P., Pestryaev D.A., Myasnikova T.V., Sveklova O.V. Reliability assessment of switching process control equipment. 2022 4th International Youth Conference on Radio Electronics, Electrical and Power Engineering (REEPE), 17-19 March 2022, Moscow, Russia. IEEE, 2022, p. 6. DOI: 10.1109/REEPE53907.2022.9731393
- Skamyin A.N., Dobush V.S., Shklyarskiy Y.E., Vasilkov O.S. Power system parameters in electric facilities with nonlinear loads. Mining Informational and Analytical Bulletin. 2024. N 6, p. 88-104 (in Russian). DOI: 10.25018/0236_1493_2024_6_0_88
- Sadykov R.R. Evaluation of reliability of low voltage commercial networks of industrial power supply. Power engineering: research, equipment, technology. 2017. Vol. 19. N 5-6, p. 98-108 (in Russian). DOI: 10.30724/1998-9903-2017-19-5-6-98-108
- Petrova R.M., Abdullazyanov E.Yu., Gracheva E.I. et al. Study of probability characteristics of reliability of electrical equipment in internal power supply systems. Kazan state power engineering university bulletin. 2023. Vol. 15. N 1 (57), p. 93-105 (in Russian).
- Kirpichnikova I.M., Shipilov S.S. Ensuring uninterrupted power supply to high-tech power enterprises. Bulletin of South Ural State University. Series “Power Engineering”. 2022. Vol. 22. N 1, p. 55-61 (in Russian). DOI: 10.14529/power220106
- Belsky A.A., Glukhanich D.Yu., Ivanchenko D.I. Power supply of controlled telemechanics points of the linear part of the oil pipeline. News of the Tula state university. Technical sciences. 2021. Iss. 4, p. 183-191 (in Russian). DOI: 10.24412/2071-6168-2021-4-183-191
- Zatsepina V.I., Astanin S.S. The Analysis of the Power Supply System Reliability with Relay Protection Fail-Safe Features. Transactions of the TSTU. 2020. Vol. 26. N 4, p. 564-570. DOI: 10.17277/vestnik.2020.04.pp.564-570
- Shpiganovich A., Shpiganovich A., Boychevskiy A. Assessment of Reliability of Individual Units Electrical Equipment by Characteristics Power Supply Systems. 2021 3rd International Conference on Control Systems, Mathematical Modeling,Automation and Energy Efficiency (SUMMA), 10-12 November 2021, Lipetsk, Russia. IEEE, 2021, p. 1088-1090. DOI: 10.1109/SUMMA53307.2021.9632126
- Abdullazyanov E.Yu., Gracheva E.I., Ibatullin E.E. et al. Analysis of the main indicators of industrial production of facilities of average capacity. Kazan state power engineering university bulletin. 2023. Vol. 15. N 2 (58), p. 93-108 (in Russian).
- Tokarev I.S. Development of parameters for an industry-specific methodology for calculating the electric energy storage system for gas industry facilities. Journal of Mining Institute. 2025. Vol. 272, p. 171-180.
- Shpiganovich A.N., Zatsepin E.P. Assessment of the failure resistance of electrical power supply systems of industrial enterprises. News of the Tula state university. Technical sciences. 2018. Iss. 12, p. 29-35 (in Russian).
- Changchao Gu, Yihai He, Yi Wei, Xu Ming. Reliability modeling of manufacturing systems based on the task network evolved by key quality characteristics. 2015 First International Conference on Reliability Systems Engineering (ICRSE), 21-23 October 2015, Beijing, China. IEEE, 2015, p. 5. DOI: 10.1109/ICRSE.2015.7366468
- Ying Gao, Qiang Dong, Mo Tao et al. Sensitivity-Analysis-Based Reliability Enhancement for Networked Control Systems. 2021 3rd International Conference on System Reliability and Safety Engineering (SRSE), 26-28 November 2021, Harbin, China. IEEE, 2021, p. 113-117. DOI: 10.1109/SRSE54209.2021.00027
- Konyukhova Y.A. Research and analysis of the reliability of schemes in the comparison variants of industrial power supply from twotransformer substations. Kazan state power engineering university bulletin. 2018. N 4 (40), p. 66-76 (in Russian).
- Konyukhova E.A. Evaluation of reliability of schemes in the performance of a feasibility study of the option of power supply facilities. Kazan state power engineering university bulletin. 2018. N 3 (39), p. 34-44 (in Russian).
- Shpiganovich A.N., Shpiganovich A.A., Petrova R.M., Gracheva E.I. Study of fault tolerance of power supply systems of industrial enterprises. Kazan state power engineering university bulletin. 2024. Vol. 16. N 2 (62), p. 94-105 (in Russian).
- Yao Cheng, Haitao Liao, Elsayed E.A. From Reliability to Resilience: More Than Just Taking One Step Further. IEEE Transactions on Reliability. 2024. Vol. 73. Iss. 1, p. 42-46. DOI: 10.1109/TR.2023.3330960
- Gasparyan A.A., Komarova G.V. Reliability assessment of a technical equipment complex of a monitoring system of parameters for electrical equipment taking into account reserve elements. 2018 IEEE Conference of Russian Young Researchers in Electrical and Electronic Engineering (EIConRus), 29 January 2018 – 01 February 2018, Moscow and St. Petersburg, Russia. IEEE, 2018, p. 632-635. DOI: 10.1109/EIConRus.2018.8317176
- Vinogradov A.V., Perkov R.A. Analysis of the failure of electrical network equipment and justification of actions for improvement of power supply reliability for the Orel city consumers. Vestnik NGIEI. 2015. N 12 (55), p. 12-21 (in Russian).
- Akimov V.A., Mishurny A.V. Accidents on Power Supply Systems: Determination of the Priority Index for Restoring Power Supply. Civil Security Technology. 2022. Vol. 19. N 4 (74), p. 44-47 (in Russian). DOI: 10.54234/CST.19968493.2022.19.4.74
- Shenggang X., Jin L., Jiale L., Rushan C. Research on Reliability and Working Life Assessment Method of Mechanical and Electrical Products in Weapon Equipment. 2019 4th International Conference on System Reliability and Safety (ICSRS), 20-22 November 2019, Rome, Italy. IEEE, 2019, p. 364-368. DOI: 10.1109/ICSRS48664.2019.8987718
- Xueyong Tang, Ning Luo, Xin He et al. Energy Production Element Planning of Integrated Gas and Power systems Considering the Coordination between Economic and Reliability. 2021 6th Asia Conference on Power and Electrical Engineering (ACPEE), 08-11 April 2021, Chongqing, China. IEEE, 2021, p. 1740-1745. DOI: 10.1109/ACPEE51499.2021.9436885
- Zhang Ruifeng, Hao Shuqing, Deng Donglin et al. Low Voltage Power Supply Reliability Evaluation of Distribution Network Based on Data Quality Governance. 2020 4th International Conference on Power and Energy Engineering (ICPEE), 19-21 November 2020, Xiamen, China. IEEE, 2020, p. 75-78. DOI: 10.1109/ICPEE51316.2020.9311017
- Zehua Li, Dingkang Liang, Jiahao Wang et al. A Data-driven Technique Based on Power System Reliability Assessment. 2023 3rd Power System and Green Energy Conference (PSGEC), 24-26 August 2023, Shanghai, China. IEEE, 2023, p. 576-581.DOI: 10.1109/PSGEC58411.2023.10255984
- Bo He, Yong Liang, Jinlong Xie. Research on Power Supply Reliability of Intelligent Distribution Network with Automatic Blocking Evaluation. 2024 IEEE 3rd International Conference on Electrical Engineering, Big Data and Algorithms (EEBDA), 27-29 February 2024, Changchun, China. IEEE, 2024, p. 207-210. DOI: 10.1109/EEBDA60612.2024.10485856
- Congcong Pan, Bo Hu, Changzheng Shao et al. Reliability-Constrained Economic Dispatch With Analytical Formulation of Operational Risk Evaluation. IEEE Transactions on Power Systems. 2024. Vol. 39. Iss. 2, p. 4422-4436. DOI: 10.1109/TPWRS.2023.3317973
- Zhang Zixuan, Kurnosov R.A., Yu Zhi Zheng. Analysis of the reliability of the power supply systems of mines in China. News of the Tula state university. Technical sciences. 2024. Iss. 3, p. 389-396 (in Russian). DOI: 10.24412/2071-6168-2024-3-389-390
- Chen Ying, Ma Qichao, Wang Ze, Li Yingyi. Reliability analysis of k-out-of-n system with load-sharing and failure propagation effect. Journal of Systems Engineering and Electronics. 2021. Vol. 32. Iss. 5, p. 1221-1231. DOI: 10.23919/JSEE.2021.000104
- Yingying Wang, Vittal V., Khorsand M., Singh C. Composite System Reliability Evaluation With Essential Reliability Services Assessment of Wind Power Integrated Power Systems. IEEE Open Access Journal of Power and Energy. 2020. Vol. 7, p. 403-413. DOI: 10.1109/OAJPE.2020.3029119
- Voltkovskaya N.S., Semenov A.S., Fedorov O.V. Energy efficiency and energy conservation in power supply systems of mining enterprises. Vestnik GGTU im. P.O.Sukhogo. 2019. N 3, p. 52-62 (in Russian).
- Ugolnikov A.V., Makarov N.V. Application of Automation Systems for Monitoring and Energy Efficiency Accounting Indicators of Mining Enterprises Compressor Facility Operation. Journal of Mining Institute. 2019. Vol. 236, p. 245-248. DOI: 10.31897/PMI.2019.2.245
- Ganzulenko О.Yu., Petkova А.P. Energy efficiency of the linear rack drive for sucker rod pumping units. Journal of Mining Institute. 2023. Vol. 261, p. 325-338.
- Bazhin V.Yu., Ustinova Ya.V., Fedorov S.N., Shalabi M.E.Kh. Improvement of energy efficiency of ore-thermal furnaces in smelting of alumosilicic raw materials. Journal of Mining Institute. 2023. Vol. 261, p. 384-391.
- Vystrchil M.G., Gusev V.N., Sukhov A.K. A method of determining the errors of segmented GRID models of open-pit mines constructed with the results of unmanned aerial photogrammetric survey. Journal of Mining Institute. 2023. Vol. 262, p. 562-570.
- Tokarev I.S., Shklyarsky Y.E., Andreeva Y.E., Lavrik A.Y. Analysis of the effectiveness of the algorithm for planning the operation of an electrical complex with an energy storage system. News of the Tula state university. Technical sciences. 2024. Iss. 3, p. 334-342 (in Russian). DOI: 10.24412/2071-6168-2024-3-334-335
- Shklyarsky J.E., Zamyatina E.N., Zamyatin E.O. Evaluation of the energy efficiency of the electrotechnical complex. News of the Tula state university. Technical sciences. 2020. Iss. 12, p. 400-404 (in Russian).
- Skamyin A., Shklyarskiy Y., Gurevich I. Influence of Background Voltage Distortion on Operation of Passive Harmonic Compensation Devices. Energies. 2024. Vol. 17. Iss. 6. N 1342. DOI: 10.3390/en17061342
- Singh P., Singh L.K. Reliability and Safety Engineering for Safety Critical Systems: An Interview Study With Industry Practitioners. IEEE Transactions on Reliability. 2021. Vol. 70. Iss. 2, p. 643-653. DOI: 10.1109/TR.2021.3051635
- Ying Chen, Yanfang Wang, Song Yang, Rui Kang. System Reliability Evaluation Method Considering Physical Dependency with FMT and BDD Analytical Algorithm. Journal of Systems Engineering and Electronics. 2022. Vol. 33. Iss. 1, p. 222-232. DOI: 10.23919/JSEE.2022.000022