
Physical-geological models of coastal areas based on petrophysical and electric resistivity tomographic modelling
- 1 — Ph.D., Dr.Sci. Professor Empress Catherine II Saint Petersburg Mining University ▪ Orcid
- 2 — Postgraduate Student Empress Catherine II Saint Petersburg Mining University ▪ Orcid
- 3 — Postgraduate Student Empress Catherine II Saint Petersburg Mining University ▪ Orcid
- 4 — Ph.D., Dr.Sci. Professor Lomonosov Moscow State University ▪ Orcid
Abstract
The potential of hydroacoustic methods widely used in coastal engineering geophysical survey is limited in the presence of gas-saturated bottom sediments. Under unfavourable conditions it is advisable to use electric prospecting methods. This article analyses the efficiency of modern electric resistivity tomographic (ERT) technologies of the surface and seabed observation systems for studying the geological sections in coastal water areas. Basic geoelectric and electric resistivity tomographic models are synthesized to assess the influence of water salinity and lithological composition of sediments on the results of marine electric prospecting. Petrophysical modelling data showed that, along with the influence of pore water mineralization on the ratio of specific electric resistivity values of dispersed soils, the mineral composition of clay minerals has a significant effect. This effect is manifested as a shift in the position of the inversion point of specific electric resistivity values of sandy-clayey soils with increasing cation exchange capacity typical of different mineralogical types of clays. Results of numerical modelling of electric resistivity tomography sections using surface and seabed observation systems demonstrated that the seabed measurement system provides reliable information on geoelectric structure of sandy-clayey sediment sections, while the sections obtained from the ERT survey on water surface exhibit distortions in the geoelectric section structure and false anomalies. The advantage of seabed ERT for studying the geological structure of coastal marine areas was ascertained. Experimental work in the Luga Bay water area in the Gulf of Finland confirmed the efficiency of the seabed ERT for increasing the reliability of cross-well geological interpolation when constructing composite geological and geophysical sections. The use of seabed ERT ensured a continuous tracking of geoelectric boundaries corresponding to different lithological species in seabed sandy-clayey sediments.
None
Introduction
Modern geophysics is successfully developing at the Saint Petersburg Mining University. Research based on observation of geophysical fields covers a wide range of tasks, from the study of deep structure of the Earth [1, 2] to engineering and archaeological research [3, 4]. Active research is conducted to improve the processing of geophysical data [5-7] and solve the urgent problem of oil and gas potential prediction [8, 9].
This article examines the synthetic physical-geological models of coastal sandy-clayey sediments in freshwater and marine environments. Based on modelling results, the potential of aquatorial electric resistivity tomography systems, both surface and seabed, for studying the geological structure of these sediments is assessed.
Designing of port infrastructure construction involves engineering geological survey and geoenvironmental studies within shallow coastal water areas1. Primary objectives of research are lithological subdivision of the geological section, determination of the roof of supporting soils, and identification of geological bodies that interfere with dredging operations. To address these challenges, marine geophysical technologies are widely used to improve the detail of engineering geological survey and to substantiate the cross-well interpolation of geological data obtained by drilling.
Currently, the leading role belongs to hydroacoustic methods, including seabed scanning with side-scan sonars and multibeam echo sounders as well as continuous seismic profiling for probing bottom sediments [10, 11]. The main disadvantage limiting the ability of hydroacoustics to fully study the structure of bottom sediments in coastal water area is the presence of the unfavourable factors complicating the investigation of the geological section of marine sediments to the required depth. These include, first of all, the generation of intense multiple reflections which complicate the identification of wanted waves, and the presence of a screening layer of bottom gas-containing silts [10].
Electric prospecting methods are recommended for use as auxiliary procedures in case of low efficiency of hydroacoustic methods for the study of geological structure and engineering geological processes including those occurring in zones of continuous gas-saturated and frozen soils. Electric prospecting is particularly widely used in combination with hydroacoustics for studying the subaquatic cryolithic zone and freshwater areas [12-14].
The above limitations of seismoacoustics determine the demand for the method of aquatorial electric resistivity tomography (ERT) in its above-water (AWERT) and seabed (SERT) modifications [12]. The application of these modifications is promising for increasing the information content of marine geophysics in the study of the geological structure of coastal areas and shallow waters [15-17].
Geophysical research including the aquatorial ERT is widely and quite successfully applied in the framework of biological research and mapping of underwater landscapes to study the geological structure of bottom sediments and flooded areas [18, 19].
A potential area of marine electric prospecting is identification of subaquatic zones of intrusion of underground fresh, mineralized water and contamination zones in coastal areas [18-22]. Important tasks include localization of gas-saturated bottom sediments and near-bottom deposits [23-25]. Monitoring of the evolution of gas shows in coastal sediments using the ERT is relevant [25]. Electric prospecting for engineering and geological surveys in marine conditions is complicated by a high mineralization of pore water in marine sediments, which significantly alters the geoelectric structure of bottom sediments [23, 26, 27]. Seabed electric resistivity tomography was recently actively and successfully applied in underwater archaeology [28-30]. Thus, the assessment of the potential and adaptation of electric prospecting technologies to marine conditions in the course of engineering geological and environmental surveys in the coastal area are urgent tasks [31-33].
This article presents the results of petrophysical studies of water salinity influence on the efficiency of using ERT in the studies of geological structure of bottom sediments by surface and seabed observation systems. Basic geoelectric models of water-saturated sandy-clayey sediments in shallow waters are synthesized. The influence of ion-exchange capacity of clay minerals (IEC) on specific electric resistivity (SER) of dispersed soils with changes in water mineralization is identified and defined. Conditions for the successful application of electric resistivity tomography in studying the geological structure of bottom sediments in coastal waters are formulated.
Synthesis of geoelectric models of sediments forming the geological structure in coastal water areas
Rocks composing bottom sediments are fully water‑saturated and exhibit low SER values. Along with mineral composition and hydrophysical properties, the dominant factor influencing the SER of sediments is mineralization of water that fills the pore space and also penetrates into massive rock formations along cracks and weakened zones [17, 24, 33].
Geoelectric models were synthesized using A.A.Ryzhov’s algorithm (“Petrophysics”) implemented in Petro software.
In Petro software, pore water resistivity, taking into account the type of cations and anions, as well as salt concentration in water are calculated from the formula
where s is the electric conductivity of solution, cm/m; C is thesalt concentration, mol/m3; F is the Faraday constant, C/mol; Vc, Va are mobility of cations and anions of solute, m2/(s∙V); n is the hydration number indicating how many moles of solvent surround the i-th ion in solution, mol/m3; are valence of cation and anion.
Soil grain size distribution is noted for particles of different size. For each fraction, the model specifies the porosity and moisture content, capillary radii, the m-Archie value, and IEC (g/l). The IEC in grams per litre differs from the widely used IEC parameter of mg-eq/100 g. Between these parameters, the conversion factor of IEC (g/l) ≈ 0.3IEC (mg-eq/100 g) is adopted.
For coarse-grained soil component, the IEC is considered to be zero. Soil conductivity is calculated from the formula:
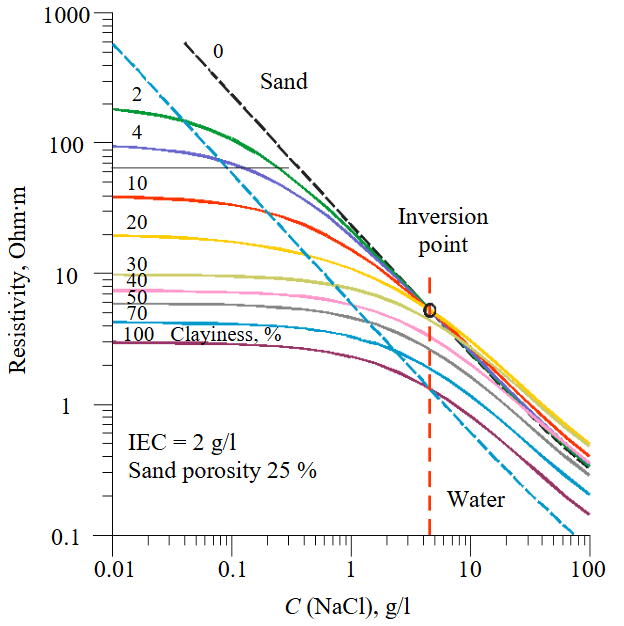
Fig.1. Dependence of a change in SER ratio of sandy-clayey rocks and inversion point position on water mineralization C
where Cc0,Ca0 are ion (cations and anions) concentrations in the cation exchange capacity, g/l; Kn is the rock porosity; r2 is the capillary radius, mm; Cc = Cc(r), Ca = Ca(r) is the concentration of cations and anions in the capillary depending on r, g/l.
Formula (1) contains two salinities, one of which is associated with pore water, and the second one is caused by salinity effect in the IEC [26, 33]. The presence of two salinities allows taking into account the IEC of soil separately and find this value during interpretation. Pore water salinity is usually known.
In the master curve calculation mode, pore water salinity (mineralization) varies from the assigned minimum value (0.01 or 0.1 g/l) in increments sufficiently fine to produce smooth master curves. The fine-grained component content in the mixture ranges from 0 to 100 % to produce 10 curves.
In Fig.1, in addition to the graphs of soil resistivity versus water mineralization, the water SER line is shown by blue dots. At high mineralization, soil resistivity graphs extend above the water line, and the difference in vertical deviations, according to Archie’s formula, depends on soil porosity. As mineralization decreases, the SER curves bend and intersect the water line. This is due to the effect of a double electric layer forming in clays. The deviation of curves from the sand line increases with a higher clay particle content in soil. Sand and clay lines for clay content of 20 % at mineralization of approximately 1.4 g/l intersect at the so-called SER inversion point of sandy-clayey rocks (Fig.1). At this point, SER values of sandy-clayey rocks are equal.
In the inversion point, the SER of sediments is independent of the composition of dispersed sediments. At lower and higher mineralization relative to the inversion point, the SER ratio of sandy-clayey sediments changes. In areas of lower water mineralization, sands exhibit the highest and clays the lowest SER. At mineralization exceeding the value in the inversion point, clays exhibit the highest resistivity, while sands display the lowest one. On approaching the inversion point, the SER contrast of sandy-clayey sediments decreases markedly, and away from the inversion point, it remains virtually unchanged. With increasing mineralization, the SER values of sandy loam and sand are virtually equal, and SER difference of clays and sandy loams is more pronounced.
The inversion point position is most strongly influenced by the cation exchange capacity (Fig.2). The shift of this point on the log-log diagram of SER dependence on water mineralization occurs linearly. As the IEC increases from 1 to 200 g/l, the coordinates of the inversion point change by several orders.
The IEC value is known to depend on mineral composition of dispersed rocks. Among the rock-forming minerals, clay minerals of kaolinite, illite, and montmorillonite groups have the greatest influence on the IEC [34]. Kaolinite has the lowest physicochemical activity, while montmorillonite has the highest one.
Kaolinite has a rigid crystal lattice in which the exchange reactions occur only along the lateral cleavages. Its IEC ranges between 3-15 mg-eq/100 g.
Illite (hydromicas) also has a rigid crystal lattice. Due to its high negative charge, the exchange reactions occur on basal surfaces. IEC ranges within 10-40 mg-eq/100 g.
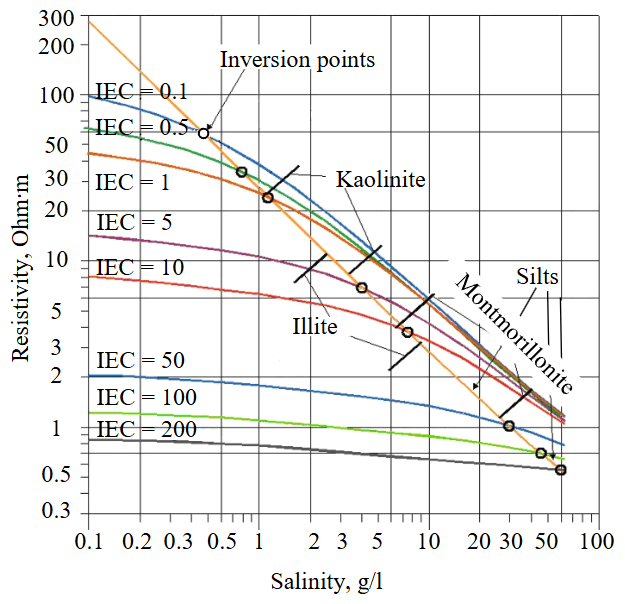
Fig.2. Dependence diagram of inversion point position on IEC values characteristic of different mineralogical clay types
Smectite (montmorillonite) is characterized by a mobile crystal lattice. Exchange reactions occur on outer and inner surfaces of structural layers. IEC ranges within 80-150 mg-eq/100 g. Cation exchange occurs on kaolinite and hydromica particles, while intramicellar exchange occurs on montmorillonite particles [34].
The influence of clay mineral composition on the inversion point position is reflected in the diagram which shows the ranges of IEC values characteristic of different mineralogical types of clays along the inversion point displacement line (Fig.2).
This pattern of dependence is accounted for by the fact that the electric conductivity of dispersed rocks is affected not only by water mineralization, but also by a simple double electric layer (EDL) forming at the clay particle – electrolyte interface. Moreover, the IEC significantly contributes to electric conductivity of dispersed rocks. At IEC 200 g/l, the SER value of water-saturated clay is virtually independent of pore water mineralization (Fig.2).
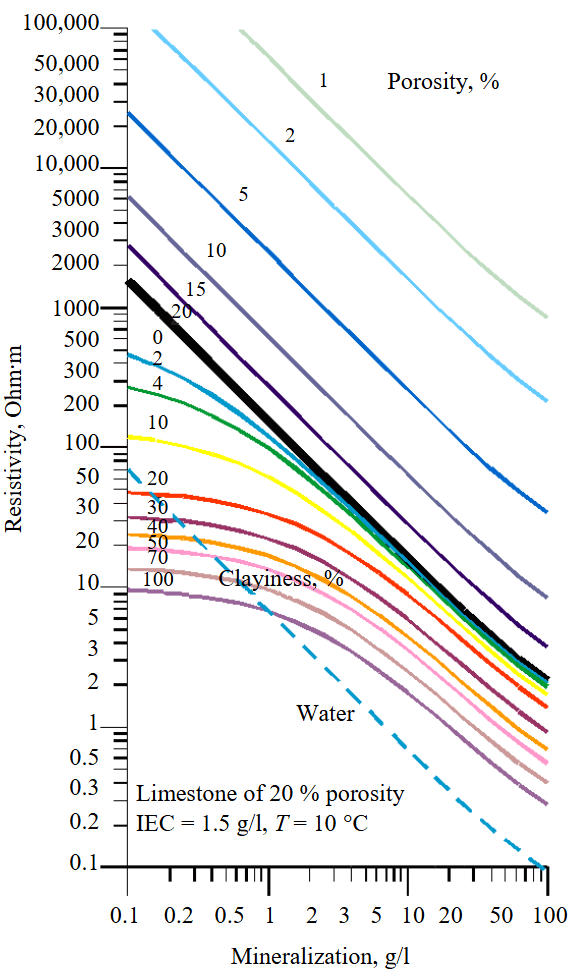
Fig.3. A master curve showing dependence of SER of water-saturated limestones on porosity, clayiness, and pore water mineralization
Comparison of coordinates of inversion points at temperature changes showed that this factor does not affect the position of points with changing water mineralization C. The inversion point shifts only along the SER axis.
When designing dredging operations in coastal water area, determination of the roof of hard or semi-hard rocks is of great importance [35]. Petrophysical modelling was performed for semi-hard rocks which are particularly susceptible to the influence of pore water mineralization. Limestone varieties with clayey material inclusions were selected, such as marly limestone with clay content to 10 % and marl with clay inclusions to 50 %. The obtained dependences of limestone SER on pore water mineralization showed that with increasing mineralization the SER of limestones decreases, but this does not lead to formation of an inversion point (Fig.3).
Limestone porosity varies from 1 to 20 %. Black line in Fig.3 corresponds to the boundary between pure and clayey limestones. The curves below this line characterize limestones with different clayiness values. The IEC of clay contained in limestones is 1.5 g/l. Rock temperature is assumed equal to 10 °C.
It should be noted that SER of rocks is also influenced by physical and mechanical properties of rocks depending on porosity and permeability as well as by rock contamination with petroleum products [32].
The resulting multifactorial petrophysical models of bottom sediments should be considered as the basis for a correct interpretation of aquatorial electric prospecting data. They allow assessing and identifying the influence of different hydrophysical conditions on the efficiency of aquatorial electric tomographic surveys, optimizing their methodology, and improving the reliability of geological interpretation of results.
ERT models of bottom sediments in marine and freshwater areas
Currently, hydroelectric prospecting survey is conducted in two modes. The most common method of surface survey involves positioning the electrical survey rig on water surface. The second method is based on surveying with an electric survey streamer mounted on the seabed. The first method is widely used when working in open water, where continuous linear movement of the electric survey streamer along the line is possible. Near the coastline and in the presence of port infrastructure facilities, a seabed-based method is advisable ensuring a stationary position of the electric survey streamer during surveying.
Surface observations are most widely conducted applying the continuous aquatorial sounding technology, which corresponds to vertical electric sounding measurements in motion processed by the electric resistivity tomographic inversion software. Bottom cable surveying offers a distinct advantage, as it allows to perform a full cycle of ERT measurements at a minimal distance from the investigated geological section.
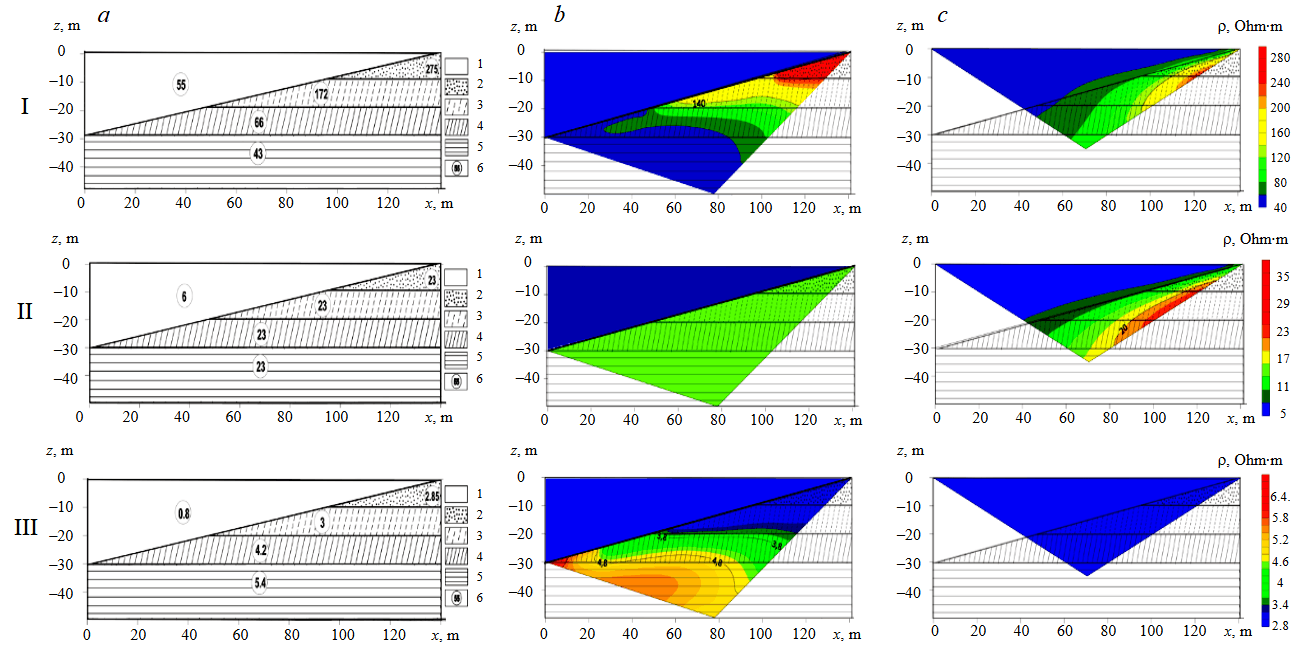
Fig.4. Geoelectric (a) and electric resistivity tomography (b, c) sections of Model 1 synthesized for different water mineralization values during observations with the Schlumberger seabed (b) and aquatorial (c) arrays
1 – water; 2 – sand; 3 – sandy loam; 4 – loam; 5 – clay; 6 – soil SER value
To evaluate the efficiency of aquatorial electric resistivity tomographic observations when studying the structure of geological sections of bottom sediments under conditions of different water salinity, typical models for SERT and aquatorial measuring unit (AERT) were synthesized.
Geoelectric Model 1 includes sandy-clayey sediments which form horizontal layers of sand, sandy loam, loam, and clay in coastal area (Fig.4). Three versions of Model 1 were developed differing in water mineralization values: 0.1 (version I); 1.29 (version II); and 10 (version III) g/l (Fig.4, a).
Mineralization values were selected in such a way that the SER values of sandy-clayey rocks corresponded to the inversion point as well as to the intervals lying left and right of this singular point (see Fig.1, a).
Calculations of electric resistivity tomography sections were performed using ZondRes2D (GeoTomo Ltd.) software for the Schlumberger electric survey array. The sections were synthesized for both seabed (Fig.4, b) and surface (Fig.4, c) measuring arrays which have identical geometric parameters.
Analysis of synthesized ERT models allows to conclude that observation data from the seabed-based measuring system provide a more accurate representation of geoelectric structure of the section. The degree and nature of discrepancy between the electric resistivity tomography section and the geoelectric one from the surface observation system depends more strongly on salinity and thickness of the water layer as well as seabed topography.
In case of freshwater at C = 0.1 g/l (I), the electric resistivity tomography section obtained for the AERT exhibits a distortion of position of geoelectric boundaries. Horizontal boundaries of the original model (Fig.4, a) correspond to curvilinear and inclined iso-ohm lines in electric resistivity tomography sections (Fig.4, c). The structure of the SERT section is not distorted and generally agrees well with horizontally layered structure of Model 1 (Fig.4, b).
At water mineralization C = 1.29 g/l (II) corresponding to the inversion point in which the resistivity of sandy-clayey layers is identical (Fig.4, a), the AERT section exhibits false, relatively high-resistivity anomalies (Fig.4, c). SERT section is characterized by a homogeneous geoelectric structure of sandy-clayey sediments with identical SER values (Fig.4, b), which is fully consistent with the initial model (Fig.4, a).
At water salinity corresponding to C = 10 g/l (III) the use of a seabed seismic array does not allow separating sands and sandy loams (Fig.4, b). Due to a minor SER contrast, a combined geoelectric layer represented by these sediments forms in the section. Loam and clay layers are clearly visible in the SERT section and are controlled by an increase in SER with depth (Fig.4, b), which is consistent with the geoelectric model (Fig.4, a).
An important conclusion is that the surface electrode spread does not provide an electric resistivity tomography section adequate to the geoelectric one under high salinity conditions. The influence of the low-resistivity water layer virtually screens the weak anomalous effects from the underlying sediments (Fig.4, c).
Modelling results for the varieties of Model 1 show that SERT offers clear advantages over surface observations and allows acquisition of the required geophysical information taking into account petrophysical limitations.
Geoelectric Model 2 includes a horizontally layered sequence of sand, sandy loam, and loam occurring in the coastal zone on a limestone massif (Fig.5, a).
Three versions of Model 2 were generated for water mineralization values similar to those adopted for Model 1: 0.1 (I), 1.29 (II), and 10 (III) g/l (Fig.5, a).
Electric resistivity tomography sections of Model 2 were synthesized using ZondRes2D software for both the seabed (Fig.5, b) and surface Schlumberger measuring arrays (Fig.5, c) with identical geometric parameters.
The results of electric resistivity tomographic modelling demonstrated a clear advantage of the seabed-mounted array for obtaining correct information on geoelectric structure of the section at different water mineralization values.
For freshwater (I), the electric resistivity tomography section obtained for the AERT shows distortions in the position of geoelectric boundaries similar to those found for Model 1 (Fig.5, c). SERT sections are in good agreement with horizontally layered structure of Model 2 (Fig.5, b).
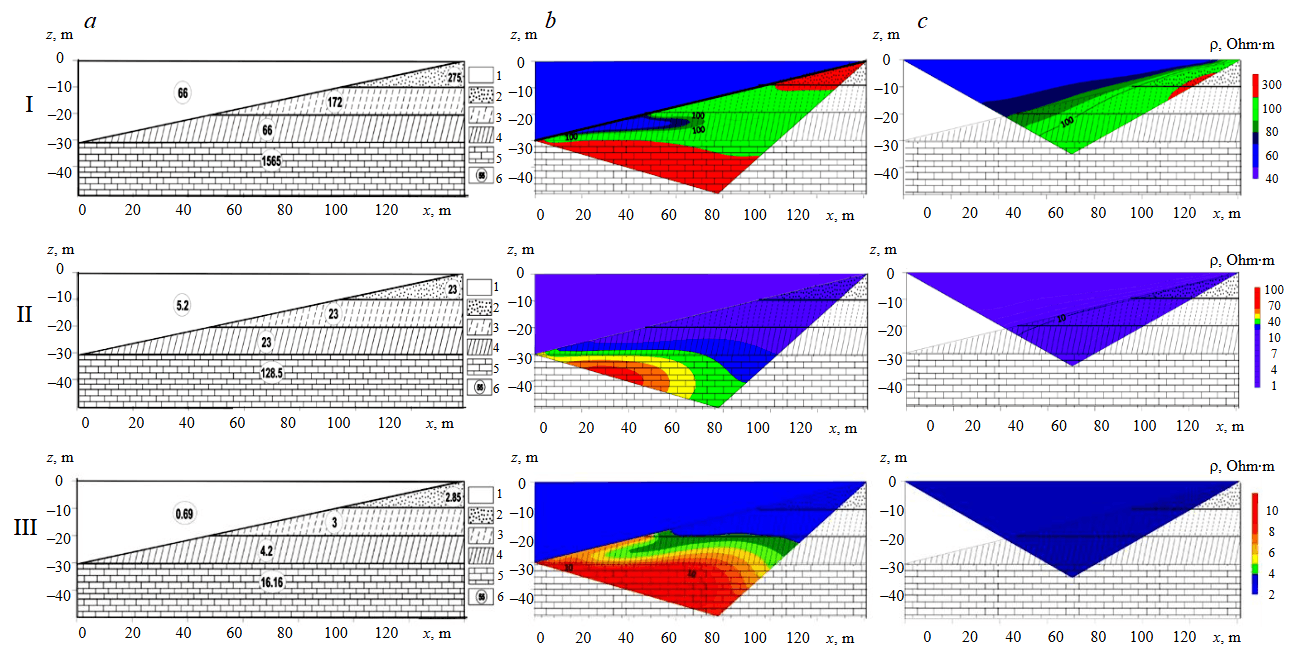
Fig.5. Geoelectric (a) and electric resistivity tomography (b, c) sections of Model 2 synthesized for different water mineralization during observations with seabed (b) and aquatorial (c) Schlumberger arrays
1 – water; 2 – sand; 3 – sandy loam; 4 – loam; 5 – clay; 6 – soil SER value
At water mineralization corresponding to the inversion point (II) (Fig. 5, a), false anomalies with elevated values are recorded in the AERT section (Fig.5, c). The SERT section is characterized by a homogeneous structure of sandy-clayey sediments (Fig.5, b) which is in full agreement with the original model (Fig.5, a). Sand, sandy loam, and loam layers have identical SER values and, thus, form a combined geoelectric layer. Limestones are clearly visible in the electric resistivity tomography section as a marked increase in SER.
At water salinity corresponding to C = 10 g/l (III), sand and sandy loam layers in SERT section form a combined geoelectric layer represented by these rocks. Loam and limestone layers are clearly visible and are characterized by increasing SER with depth (Fig.5, b). The AWERT modification does not allow studying the sediment section to the required depth (Fig.5, c).
The results of Model 2 confirm the data obtained for Model 1, according to which SERT modification is more efficient for studying the structure of geological sections of sediments at different water mineralization.
Experimental studies of SERT in coastal water of the Luga Bay in the Gulf of Finland
To evaluate the potential of SERT for studying bottom sandy-clayey sediments, experimental work was conducted in coastal waters of the Luga Bay in the Gulf of Finland, where geological and geophysical investigations are currently conducted. Geophysical survey also included the identification of paleovalleys, a network of which is developed within Saint Petersburg and the Leningrad Region [36].
Seabed topography in the study area is abrasive and accumulative, with a coastal marine terrace traced along the coast. The seabed is predominantly sandy, less frequently silty-loamy.
Engineering and geological characteristic of the study area. According to drilling data, the following features are found in the geological section within the study area (Fig.6):
- Marine sediments comprising medium-grained sands with inclusions of gravel and pebbles (EGE (Engineering Geological Element) 2.1), and heavy silty, fluid loams with silt interlayers (EGE 2.2).
- Fluvioglacial deposits – supra-morainic light to heavy, silty, hard loam (EGE 3.2) and heavy silty, semi-hard to hard loam (EGE 5.2).
- Marine sediments of Mikulino interglacial horizon – light, silty, semi-hard clays (EGE 7.2) and inequigranular sands (EGE 7.1).
Fluvioglacial intermorainic silty semi-hard loams (EGE 3.2; EGE 5.2) are recommended for use as a reliable load-bearing foundation by analogy with Kotlin clays [31].
Hydrogeological structure of the study area is determined by the development of a single aquifer complex comprising hydraulically connected aquifers. Based on the occurrence conditions and the nature of circulation, groundwater in the complex is classified as pore, unconfined. The aquifer complex is recharged by surface water.
According to results of chemical analysis of water, the water area is salty (mineralization 3.47-4.11 g/l), neutral to slightly alkaline (pH 7.47-8.02), moderately hard to very hard (total hardness 4.8-15.30 mg-eq/l), of chloride type as regards the predominant anions and of potassium-sodium type as regards the predominant cations.
Gas emission was recorded in some areas of the fluvioglacial intermorainic and marine Mikulino deposits. Gas generation is associated with marine deposits of the Mikulino horizon. Gas shows were discovered during penetration of this horizon in isolated sand lenses and interlayers of fluvioglacial intermorainic deposits. Natural gas was recorded when drilling well 2. During drilling of the layer, an intense gas emission with a characteristic hydrogen sulphide odour occurred. Visible height of the gas cloud reached 4 m above the deck.
Methodology for conducting SERT
The main objective of experimental electric prospecting is to evaluate the potential of SERT for studying the structure of bottom sediments and performing correct cross-well geological interpolation of the sections penetrated by wells 1 and 2. Of particular importance for designing the port infrastructure construction is identification and tracking of boundaries of EGE 5.2 and 7.2 loams.
Different geophysical observation systems are currently used. SERT survey methodology was based on standard observation technology adopted for land-based electric resistivity tomography. Measurements were performed using a Skala 48K12 multi-electrode electrical prospecting instrument (Design Bureau Electrometry LLC). A single-segment 48-electrode streamer with a Kevlar-reinforced cable sheath and enhanced contact waterproofing was applied for the electric resistivity tomographic survey. The quality of electrode waterproofing permitted operation at depths to 20 m. Metal tubes with diameter 17 mm were spaced at 3 m along the streamer as electrodes. Ion-selective electrodes were not applied. Streamer connectors were at 50 m from the first electrode, and the end of the streamer submerged to the seabed was carefully waterproofed. The streamer buffer allowed to accommodate the equipment on board a boat. To conduct underwater observations, a 141 m long working section of the streamer was laid along the observation line and anchored to the seabed with weights. The streamer layout was moved along the line by towing it submerged by a boat. Positions of the streamer initial and final electrodes on the seabed were secured by buoys in the water area, the coordinates of which were determined using a GPS navigator.
Measurements were taken using a Schlumberger electrode array (AMNB) with N-factor not exceeding 5 to reduce the influence of induction on galvanic observation results. Current values during measurements ranged from 1.5 to 1.8 A, and potential differences varied between 1 and 7 mV, i.e. they were standard ones for calculating the apparent resistivity (ASER).
As is known, the induction effect should manifest itself as an increase in measured ASER values at large spacings, in the form of an induction asymptote (Karinsky, Shevnin, 2001). This effect was not recorded in the obtained geoelectric sections, as the selected characteristics of measurement modes ensured the minimal contribution of the induction field component.
Standard computational procedures implemented in the certified Xeris software which is attached to the Skala 48K12 electric prospecting equipment were used to process the data and determine the ASER.
Office processing was performed by inverting the underwater observation data using Res2Dinv software (GeoTomo Ltd.). Inversion of SERT data was performed taking into account the water SER values and seafloor topography.
Results of experimental studies
SERT results are presented as a geoelectric section in which geoelectric boundaries are drawn taking into account the lithological columns of wells 1 and 2 (Fig.7).
The boundaries separate rocks classified by lithological composition and physical and mechanical properties into different EGE, the indices of which are shown in the engineering geological section (see Fig.6).
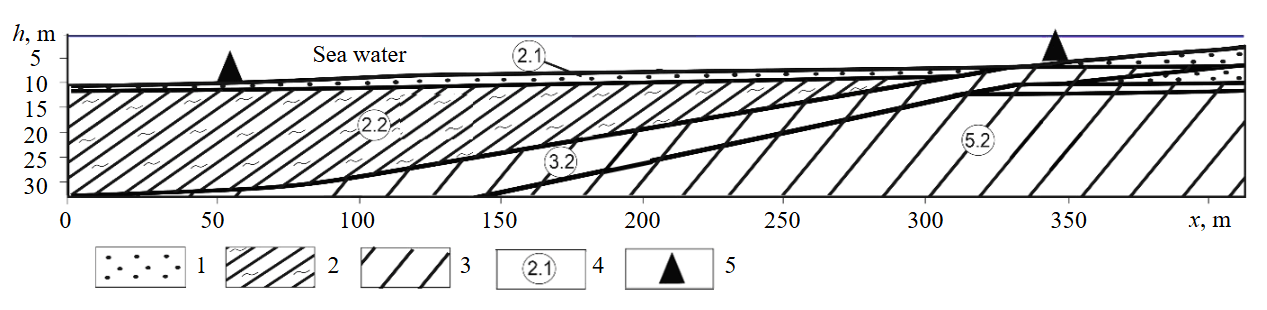
Fig.6. Engineering geological section of the work site based on drilling data from wells 1 and 2
1 – sand; 2 – loam with silt interlayers; 3 – heavy, silty, hard and semi-hard loams; 4 – EGE number; 5 – wells
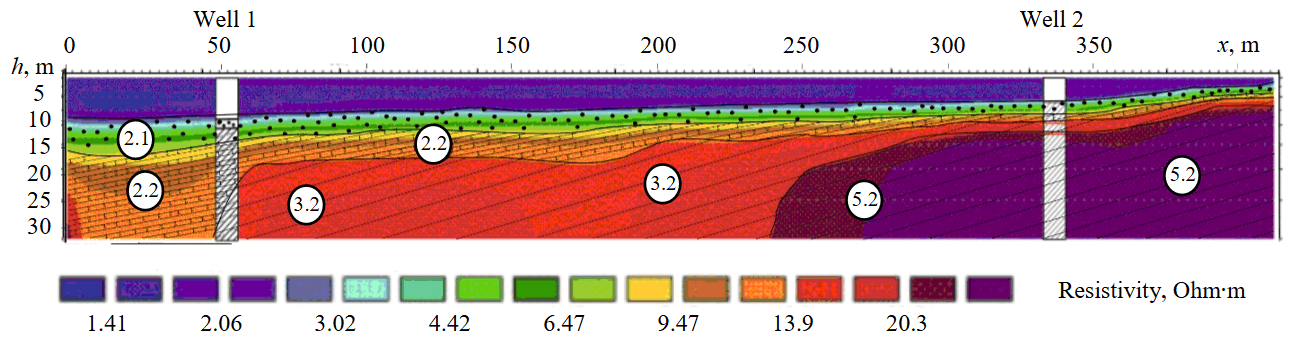
Fig.7. Geoelectric section showing lithologic columns for wells 1 and 2
2.1 – sand; 2.2 – loam with silt interlayers; 3.2 – heavy, silty, hard loam; 5.2 – semi-hard loam
SER values of sandy-clayey sediments in water area correspond to pore water mineralization interval which is right of the inversion point in the diagram (see Fig.1, a). For this reason, the lowest SER values in the electric resistivity tomography section are characteristic of sand (EGE 2.1) and loam with silt interlayers (EGE 2.2).
SER of heavy, silty, semi-hard loams (EGE 5.2) is higher than that of hard loams (EGE 3.2). This can be accounted for by two geological factors. Firstly, EGE 5.2 loams have a higher porosity coefficient (equal to 0.63) than EGE 3.2 loams for which this value is close to 0.47. The second probable reason is that EGE 5.2 loams lie directly on gas-generating Mikulino clays and are overlain by denser EGE 3.2 loams (see Fig.6).
The combination of these factors creates the geological preconditions for the formation of elevated gas saturation in EGE 5.2 loam layer. The increase in SER of these deposits can be due to gas coming from the Mikulino deposits.
Topography of the roof of dense supra-morainic soil sequence revealed from the SERT data points to the presence of an ancient valley channel of fluvioglacial origin.
Thus, the obtained SERT results significantly complement and refine the interpretation of the engineering geological section in the cross-well interval and allow localization of the paleochannel, information on the location of which is necessary to substantiate the design solutions for the construction of the port berthing facilities.
Conclusion
The results of petrophysical modelling revealed the influence of ion-exchange capacity of dispersed rocks on the position of the SER inversion point. This influence manifests itself as a shift in the SER inversion point of sandy-clayey soils with increasing water salinity caused by a change in mineral composition of clays. This circumstance should be taken into account when interpreting data and designing marine electric prospecting. Furthermore, this feature can be regarded as indicating the mineral composition of clayey rocks.
Analysis of electric resistivity tomography sections synthesized for different water salinity showed that the efficiency of using ERT in aquatorial and seabed areas for investigating the geological structure of coastal areas differs significantly. Seabed ERT provides reliable information on geoelectric structure of sandy-clayey sediment section, while electric resistivity tomography sections obtained from the above-water ERT survey exhibit distortions in the structure of geoelectric sections, and false anomalies appear. Numerical modelling results demonstrate the advantage of seabed ERT for studying marine coastal areas.
Experimental work demonstrated the efficiency of using SERT for cross-well geological interpolation in the course of marine engineering and geological survey. The influence of gas saturation of sediments on the results of ERT studies was revealed.
Electrotomographic studies using seabed observations are particularly relevant in the presence of gas-saturated silts which screen the propagation of seismoacoustic pulses. Such conditions are, as a rule, recorded in coastal areas of the Gulf of Finland, where engineering geological surveys are usually conducted for the construction of port facilities and dredging operations.
SP 504.1325800.2021 Engineering Surveys for Construction on the Continental Shelf. General Requirements. Moscow: Ministry of Construction of Russia, 2021, p. 176.
References
- Gorelik G.D., Egorov A.S., Shuklin I.A., Ushakov D.E. Substantiation of optimal range of geophysical surveys to study deep structure of the Lake Vostok area. Gornyi zhurnal. 2024. N 9, p. 56-61 (in Russian). DOI: 10.17580/gzh.2024.09.09
- Egorov A., Antonchik V., Senchina N. et al. Impact of the Regional Pai-Khoi-Altai Strike-Slip Zone on the Localization of Hydrocarbon Fields in Pre-Jurassic Units of West Siberia. Minerals. 2023. Vol. 13. Iss. 12. N 1511. DOI: 10.3390/min13121511
- Vasilyev S.A., Grigoreva N.V., Medvedev N.O. et al. Plakun Burial Ground: a new discovery of the well-known site based on the results of the aerial lidar and ground penetrating radar research. Ufa Archaeological Herald. 2024. Vol. 24. N 3, p. 573-586 (in Russian). DOI: 10.31833/uav/2024.24.3.038
- Daniliev S., Danilieva N., Mulev S., Frid V. Integration of Seismic Refraction and Fracture-Induced Electromagnetic Radiation Methods to Assess the Stability of the Roof in Mine-Workings. Minerals. 2022. Vol. 12. Iss. 5. N 609. DOI: 10.3390/min12050609
- Sysoev A.P., Zaitsev S.A. Separate issues of amplitude inversion of wave field. Geology and mineral resources of Siberia. 2023. N 3 (55), p. 52-58 (in Russian). DOI: 10.20403/2078-0575-2023-3-52-58
- Yakovleva A.A., Movchan I.B., Medinskaia D.K., Sadykova Z.I. Quantitative interpretations of potential fields: from parametric to geostructural recalculations. Bulletin of the Tomsk Polytechnic University. Geo Assets Engineering. 2023. Vol. 334. N 11, p. 198-215 (in Russian). DOI: 10.18799/24131830/2023/11/4152
- Daniliev S.M., Mulev S.N., Shnyukova O.M. Correlation and regression analysis of natural electromagnetic and acoustic emission activity in rock samples of the Oktyabrsky deposit. Gornyi zhurnal. 2024. N 9, p. 51-55 (in Russian). DOI: 10.17580/gzh.2024.09.08
- Sysoev A.P. Analytical solutions to the problems of compensation of near-surface heterogeneity in seismic exploration using seismic reflection method. Geology and mineral resources of Siberia. 2023. N 1 (53), p. 36-43 (in Russian). DOI: 10.20403/2078-0575-2023-1-36-43
- Kalinin D.F., Egorov A.S., Bolshakova N.V., Sekerina D.D. Information and statistical forecast of oil and gas potential in the marginal part of the Koryak-Kamchatka folded region. Bulletin of Kamchatka Regional Association Educational-Scientific Center. Earth Sciences. 2023. N 1. Vol. 57, p. 63-88 (in Russian). DOI: 10.31431/1816-5524-2023-1-57-63-88
- Budanov L.M., Sergeev A.Yu., Chekulaev A.V. High-frequency sub-bottom profiling on desalinated shallow-water in case of the Neva bay. Inzhenernaya i rudnaya geofizika 2023: Sbornik materialov 19-i nauchno-prakticheskoi konfe-rentsii i vystavki “Inzhenernaya i rudnaya geofizika 2023”, “Inzhenernaya i rudnaya geologiya 2023”, “Morskie tekhnologii 2023”, 15-19 maya 2023, Saint Petersburg, Russia. Moscow: Geomodel, 2023, p. 124-133 (in Russian).
- Mirinets A.K., Rybalko A.E., Aleshin M.I., Subetto D.A. The structure if the Quaternary sheet in the Petrozavodsk Bay of Lake Onega according to seismoacoustics. Moscow University Bulletin. Series 4. Geology. 2024. N 1, p. 123-129 (in Russian). DOI: 10.55959/MSU0579-9406-4-2024-63-1-123-129
- Mirinets A.K., Bobachev A.A., Mironyuk S.G. The detection of frozen and gas-saturated soils in the gulf of Ob of the Kara Sea according to the data of the underwater electrical resistivity tomography with acoustic profiling and drilling. Geophysics. 2022. N 6, p. 35-42 (in Russian). DOI: 10.34926/geo.2022.11.15.005
- Mirinets A.K., Bobachev A.A., Rybalko A.E. Bottom sediments investigations of lake Onega applying underwater seismic and electromagnetic surveys. Science and Technological Developments. 2022. Vol. 101. N 2, p. 5-22 (in Russian). DOI: 10.21455/std2022.2-2
- Budanov L.M., Glazunov V.V., Sergeev A.Yu., Efimova N.N. Use of hydroelectric prospecting methods for mapping paleorelief forms in Sestroretsky Razliv water area. Estestvennye i tekhnicheskie nauki. 2017. N 3 (105), p. 52-57 (in Russian).
- Zi-Yin Ren, Xiu-Jun Guo, Jing-Xin Wu. Simulation and Analysis of Detection Results of Shallow Gas Under Shallow Water with a Navigated DC Marine Resistivity Method. Periodical of Ocean University of China. 2019. Vol. 49. Iss. 7, p. 56-63. DOI: 10.16441/j.cnki.hdxb.20180231
- Chang Gao, Xiujun Guo, Shuai Shao, Jingxin Wu. Using MODFLOW/MT3DMS and electrical resistivity tomography to characterize organic pollutant migration in clay soil layer with a shallow water table. Environmental Technology. 2021. Vol. 42. Iss. 28, p. 4490-4499. DOI: 10.1080/09593330.2020.1767699
- Tassis G.A., Tsourlos P.I., Rønning J.S. Detection and characterization of fracture zones in bedrock in marine environment: possibilities and limitations. Near Surface Geophysics. 2020. Vol. 18. Iss. 1, p. 91-103. DOI: 10.1002/nsg.12086
- Neevin I.A., Budanov L.M., Sergeev A.Yu. et al. Marine geological and geophysical methods as a source of basic information for biological research and marine landscape mapping. Regional ecology. 2015. N 4 (39), p. 5-24 (in Russian).
- Shkiria M.S., Lankin Yu.K., Tereshkin S.A. et al. Applying ground geophysical prospecting using the method of electrical resistivity tomography as part of engineering and geological surveys of a flooded area in one of the residential areas of Irkutsk. Bulletin of the Tomsk Polytechnic University. Geo Аssets Engineering. 2022. Vol. 333. N 11, p. 160-170. DOI: 10.18799/24131830/2022/11/3766
- Niculescu B.M., Andrei G. Application of electrical resistivity tomography for imaging seawater intrusion in a coastal aquifer. Acta Geophysica. 2021. Vol. 69. Iss. 2, p. 613-630. DOI: 10.1007/s11600-020-00529-7
- Mironyuk S.G., Khlebnikova O.A. Signs and Geological Prerequisites of Seawater Intrusion into Coastal Aquifers (the Example of the Black Sea). Doklady Earth Sciences. 2022. Vol. 507. Suppl. 1, p. S163-S172. DOI: 10.1134/S1028334X22601572
- Ekwok S.E., Ben U.C., Eldosouky A.M. et al. Towards understanding the extent of saltwater incursion into the coastal aquifers of Akwa Ibom State, Southern Nigeria using 2D ERT. Journal of King Saud University – Science. 2022. Vol. 34. Iss. 8. N 102371. DOI: 10.1016/j.jksus.2022.102371
- Cheng Xing, YuPing Luo, XiuJun Guo et al. Simulation analysis of monitoring effect of electrical resistivity tomography in seawater-groundwater exchange process. Progress in Geophysics. 2022. Vol. 37. Iss. 6, p. 2622-2629. DOI: 10.6038/pg2022FF0603
- Guangxiang Zhu, Xiujun Guo, Le Yu et al. Analysis on Resistivity Characteristics and Resistivity Model Building of Marine Soil with High Clay Content. Journal of Jilin University (Earth Science Edition). 2019. Vol. 49. N 5, p. 1457-1465. DOI: 10.13278/j.cnki.jjuese.20180226
- Hao Sun, JiTong Sun, JingXin Wu et al. Simulation analysis of monitoring effect of marine resistivity method in shallow gas evolution process. Progress in Geophysics. 2022. Vol. 37. Iss. 3, p. 1311-1320. DOI: 10.6038/pg2022FF0199
- Xiaoteng Xiao, Yufeng Zhang, Tengfei Fu et al. The two salinity peaks mode of marine salt supply to coastal underground brine during a single tidal cycle. Frontiers in Marine Science. 2024. Vol. 10. N 1324163. DOI: 10.3389/fmars.2023.1324163
- Tao Zhang, Songyu Liu, Guojun Cai. Correlations between electrical resistivity and basic engineering property parameters for marine clays in Jiangsu, China. Journal of Applied Geophysics. 2018. Vol. 159, p. 640-648. DOI: 10.1016/j.jappgeo.2018.10.012
- Capozzoli L., Giampaolo V., De Martino G. et al. ERT and GPR Prospecting Applied to Unsaturated and Subwater Analogue Archaeological Site in a Full Scale Laboratory. Applied Science. 2022. Vol. 12. Iss. 3. N 1126. DOI: 10.3390/app12031126
- Simyrdanis K., Papadopoulos N., Kim J.-H. et al. Archaeological investigations in the shallow seawater environment with electrical resistivity tomography. Near Surface Geophysics. 2015. Vol. 13, p. 601-611. DOI: 10.3997/1873-0604.2015045
- Papadopoulos N., Oikonomou D., Simyrdanis K., Loke Meng Heng. Practical considerations for shallow submerged archaeological prospection with 3-D electrical resistivity tomography. Archaeological Prospection. 2022. Vol. 29. Iss. 1, p. 1003-123. DOI: 10.1002/arp.1841
- García-Menéndez O., Ballesteros B.J., Renau-Pruñonosa A. et al. Using electrical resistivity tomography to assess the effectiveness of managed aquifer recharge in a salinized coastal aquifer. Environmental Monitoring and Assessment. 2018. Vol. 190. Iss. 2. N 100. DOI: 10.1007/s10661-017-6446-9
- Dusart J., Tarits P., Fabre M. et al. Characterization of gas-bearing sediments in the coastal environment using geophysical and geotechnical data. Near Surface Geophysics. 2022. Vol. 20. Iss. 5, p. 478-493. DOI: 10.1002/nsg.12230
- Moulds M., Gould I., Wright I. et al. Use of electrical resistivity tomography to reveal the shallow freshwater–saline interface in The Fens coastal groundwater, eastern England (UK). Hydrogeology Journal. 2023. Vol. 31. Iss. 2, p. 335-349. DOI: 10.1007/s10040-022-02586-2
- Korolev V.A. Theory of electric surface phenomena in soils and their use. Moscow: Sam poligrafist, 2015, p. 486 (in Russian).
- Dashko R.E., Karpenko A.G. Scientific-Practical Enhancement Principles for the Long-Term Stability of Cultural Heritage Objects through a Multi-Component Underground Space Analysis. Heritage. 2024. Vol. 7. Iss. 8, p. 4455-4471. DOI: 10.3390/heritage7080210
- Dashko R.E., Lokhmatikov G.A. The Upper Kotlin clays of the Saint Petersburg region as a foundation and medium for unique facilities: an engineering-geological and geotechnical analysis. Journal of Mining Institute. 2022. Vol. 254, p. 180-190. DOI: 10.31897/PMI.2022.13