Accumulation of impurity elements under hydrothermal crystallization of pyrite: selectivity of surface phases
- 1 — Ph.D. Senior Researcher Vinogradov Institute of Geochemistry, SB RAS ▪ Orcid
- 2 — Leading Engineer Vinogradov Institute of Geochemistry, SB RAS ▪ Orcid
- 3 — Leading Engineer Vinogradov Institute of Geochemistry, SB RAS ▪ Orcid
- 4 — Ph.D., Dr.Sci. Chief Researcher Vinogradov Institute of Geochemistry, SB RAS ▪ Orcid
Abstract
Limited data on the behavior of impurity elements during the formation of ore minerals in hydrothermal systems reduce their potential as indicators of the physicochemical conditions of ore formation. One of the most common sulfides capable of concentrating precious metals and other valuable components is pyrite. The distribution of a number of typomorphic impurity elements in pyrite under its crystallization in hydrothermal conditions at a temperature of 450 °C and a pressure of 1 kbar was studied. Using X-ray spectral microanalysis, scanning electron microscopy, and inductively coupled plasma and laser ablation mass spectrometry, data were obtained on the forms of occurrence, content ratios, and correlation relationships of impurity elements in the volume and surface layer of pyrite crystals. For the first time, the parameter S of surface phase selectivity with respect to main (Co, Cu, Ni) and minor impurities (noble metals, As, Zn, Mn) was determined, which averaged 1.9 (Co), 2.1 (Cu), 1.3 (Ni), 4.2 (Pd), 18.5 (Au), 6 (As), 10.2 (Zn), and 9.1 (Mn). The correlations between elements are significantly different for the surface and volume, which is explained by the influence of surface phase selectivity. The dual nature of the correlation between Au and As allows their relationship to be considered a surface phenomenon. Palladium, a critically important metal widely used in chemical catalysis and other areas of technology, exhibits unusual behavior in pyrite, concentrating mainly on its surface, which suggests the possibility of its concurrent extraction from pyrite ores at gold extraction enterprises. The observed correlations are considered from the perspective of the incorporation of impurity elements into the bulk structure of pyrite and into the compositions of surface phase-like formations (non-autonomous phases) that evolve during crystal growth and are enriched with incompatible elements.
The research was supported by Russian Science Foundation grant N 24-27-00140, https://rscf.ru/project/24-27-00140/.
Introduction
The discovery of phase-like formations (so-called non-autonomous phases, NAP) on mineral surfaces, capable of absorbing concentrations of impurity elements that are excessive in relation to the volume of the crystal [1, 2], poses a number of new problems for geochemists. On the one hand, this circumstance creates additional difficulties in interpreting the results, especially in multisystems where micro- and nano-phases may appear that are difficult to diagnose and have different origins. On the other hand, this mechanism of trace elements (TE) absorption is important for understanding the primary concentration of valuable impurities, including noble metals, REE, and other rare elements, in crystals formed from hydrothermal solutions [1]. A similar effect of TE accumulation exists for intracrystalline surfaces of pyrite, represented by dislocation boundaries of one type or another [3-5].
Interest in pyrite in this regard is not accidental – it is one of the most common sulfides formed in various geochemical environments, in particular, in ore deposits of various types, genesis, and specialization [6-8]. Although modern literature contains a large number of analyses of the chemical composition of pyrite using various methods [9-11], the characteristics of the distribution of elements in hydrothermal systems with pyrite have been little studied and do not allow the typomorphic capabilities of this mineral to be used correctly. For example, cobalt, a critically important metal used in lithium-ion batteries, is a common component of pyrite in volcanogenic sulfide deposits, but the conditions and reasons for its enrichment in pyrite remain unclear [12]. The potential of such a geochemical tool for solving ore genesis problems as the Co/Ni ratio in pyrite does not seem sufficiently justified [13]. It should also be taken into account that pyrite is the main mineral matrix for Au in many gold deposits, and the technological schemes for its extraction significantly depend on its phase and chemical state in sulfide ores [14-16]. It is currently believed that so-called invisible Au in refractory ores is mainly present in the form of nanoparticles (NP) and in a structurally bound form, and that NP can be extracted from pyrite without destroying its structure [17]. This applies even more to the surface-bound form of Au found in NAP.
The purpose of this work is to study the distribution of a number of typomorphic impurity elements in pyrite under its crystallization in hydrothermal conditions. For the first time, data on both the «volumetric» and surface contents of impurity elements will be presented, and the correlation between them will be considered.
Experimental and analytical methods
The scheme of thermogradient hydrothermal synthesis coupled with fluid sampling is presented and discussed in detail in [1]. Experimental parameters: temperature in the growth zone 450 °C, temperature drop along the outer wall of the autoclave 15 °C, duration 25-30 days, of which the first 4 days were maintained at an isothermal regime for the purpose of homogenizing the system. The pressure of 100 MPa (1 kbar) was set by the filling coefficient of the inner working vessel (passivated titanium liner, VT-8 alloy, volume ~50 cm3). The liners were placed in stainless steel autoclaves with screw seals designed by the SKTB Institute of Crystallography of the USSR Academy of Sciences. Internal sampling was carried out using a trap – a titanium cylinder fixed to the upper part of the liner. Ammonium chloride-based solutions (reagent grade) served as mineralizers. The charge varied in terms of the S/Fe atomic ratio (1.9-2.5) and the addition of impurity elements in the form of sulfides (ZnS and MnS), oxides (NiO, CoO, and CuO), and simple substances (As, Se, Au, Pd, Pt). The purity grades of the reagents used were as follows: Fe, S, Se – “especially pure”; ZnS – “chemically pure”; MnS and As – “pure”; CuO – “pure for analysis”; NiO and CoO – “pure”; Au 99.99, Pt and Pd 99.95. According to optical emission spectral analysis, reagents of the “pure” grade contained elevated concentrations (up to 0.01 wt.%) of elements that were already present in the charge as components of individual reagents. The main foreign impurity was Pb, which, however, was not detected in the solid synthesis products. The experiments were terminated by quenching the autoclaves in cold running water at a rate of ~5 deg/s. This paper presents the results of 10 successful experiments in which no depressurization of the liner was observed, a sufficient amount of pyrite crystals was formed for study, and a representative volume of fluid was captured.
Analysis of the fluids trapped in the collectors was carried out using Perkin-Elmer Model 403, 503, and Analyst 800 atomic absorption spectrometers (USA) at the Institute of Geochemistry, SB RAS. The accuracy of determining the elements Fe and Mn ±2; Co, Ni, Cu, Zn ±5; As, Au, Pt, Pd ±10 rel.%, the detection limits for elements with low concentrations (precious metals) were 0.3; 5, and 50 μg/L for Au, Pd, and Pt, respectively; palladium and platinum were determined by tristirylphosphine extraction [1].
The crystalline products of the experiments were analyzed using powder X-ray diffraction (XRD), electron probe microanalysis (EPMA), scanning electron microscopy with energy-dispersive spectroscopy (SEM-EDS), and laser ablation inductively coupled plasma mass spectrometry (LA-ICP-MS).
The phase composition of the products and the features of the real structure of pyrite crystals were determined at the Institute of Geochemistry, SB RAS, using a Bruker D8 ADVANCE diffractometer (Germany) equipped with a scintillation detector and a Göbel mirror, operated in step-scan mode over a 2θ diffraction angle range from 8 to 70° using CuKα radiation. The experiments were performed at room temperature under the following conditions: 40 kV accelerating voltage, 40 mA tube current, exposure time of 2 s, and a step size of 0.02° 2θ. The obtained data were processed using the DIFFRACplus software package. The samples were identified using the PDF-2 powder diffraction database (ICDD, 2007) and indexed using EVA software (Bruker, 2007). The error in determining the parameter of the unit cell is in the fifth digit (nm), and the size of crystallites in pyrite (coherent scattering regions, CSR) is ±2 nm.
EPMA was used for the quantitative determination of major elements in the bulk of crystals mounted in epoxy resin. The analysis was carried out at the Institute of Geochemistry, SB RAS, using a Superprobe JXA-8200 microanalyzer (JEOL Ltd., Japan). Quantitative elemental analysis was performed using wavelength-dispersive spectrometers at an accelerating voltage of 20 kV, a probe current of 20 nA, and a probe diameter of 1 μm. Matrix-effect correction factors and elemental concentrations were calculated using the ZAF correction method implemented in the quantitative analysis software of the microanalyzer. Well-characterized reference materials were used as standards, including minerals of known composition – sphalerite (ZnS), pyrite (FeS₂), chalcopyrite (CuFeS₂), and arsenopyrite (FeAsS) – certified as standard samples of the enterprise (ESS) at the Institute of Geology and Mineralogy, SB RAS (Novosibirsk), as well as pure metals (Mn, Pd, Pt, Au), elemental Se, and an Fe-Ni-Co alloy certified as reference materials by the Institute of Geochemistry, SB RAS, and Irgiredmet JSC (Irkutsk). The minimum detection limit (MDL) for the analyzed elements was 0.1 wt.%. Superpositions of the analytical lines of the determined elements are taken into account in the concentration calculations using overlap coefficients.
The distribution of elements in the surface layer of synthesized pyrite crystals was studied using a TESCAN TIMA 3 X LMH FEG scanning electron microscope (Czech Republic) with EDAX Element Pulse Tor 30 energy dispersive spectrometers (USA) at Irgiredmet JSC. The pyrite crystal samples were glued with carbon tape to a special sample table. TIMA software was used to calculate the elemental contents. The spectral resolution of the EDS detectors was 129 eV on the MnKα line. The range of recorded elements was from Be to Am. Surface photographs were accumulated from two detectors, secondary electrons (SE) and backscattered electrons (BSE), to understand the topographic and compositional contrast, respectively. The accelerating voltage of the electron beam during EDS analysis and image accumulation was 25 kV.
The main objective was to identify areas on the crystal surface suitable for local studies using LA-ICP-MS. At the same time, information was obtained on the microphases of impurity components present on the surface. The detection limit for the elements determined in these measurements was 0.5 wt.%.
The LA-ICP-MS analysis was performed at the Limnological Institute, SB RAS, using an Agilent 7500ce instrument with a New Wave Research UP-213 laser ablation platform (USA). The method was applied in two variants. In the first, crystals placed in an epoxy pellet and polished were analyzed. The results were related to the volume content of the element. In the second variant, natural crystal faces were analyzed to determine the content of elements in their surface layers. The scanning parameters were as follows: plasma power 1400 W, carrier gas flow rate 1.16 L/min, laser power 90 %, laser beam projected onto a fixed point, beam projection diameter 55 μm, scanning time 17 s. The crater depth, determined by optical and electron microscopy [2], was 20±3 μm.
The following element isotopes were analyzed: 55Mn, 59Co, 60Ni, 63Cu, 64Zn, 75As, 77Se, 106Pd, 194Pt, 197Au. Calibration and processing of point LA-ICP-MS analysis data was performed using the NIST 612 standard sample and our own reference sulfide material [2], and to calculate the concentrations of the main metal impurities (Co, Ni, Cu), pyrite from one of the experiments was used, analyzed by EPMA and showing the most uniform distribution of elements and their best sum. The analysis was performed at 20 points of each sample, in 3-4 grains. The calculated detection limits were, μg/g: Mn – 6.1, Co – 0.5, Ni – 0.8, Cu – 0.6, Zn – 1.0, As – 2.1, Se – 28.2, Pd – 0.1, Pt – 0.9, Au – 0.5.
Analytical data processing was carried out using an approach that involves forming criterion-based statistical sampling (CBSS) corresponding to a specific form of an element occurrence. In article [18] based on experimental and analytical studies, it was assumed that the structural form of a microelement and its surface form (including NAP) are in a relationship of mutual masking. When analyzing a data set for surface forms, it is logical to impose the same conditions on the dispersion of TE content as for structural impurities. This will allow us to cut off forms corresponding to autonomous phase impurities and random surface contamination. However, given that the accuracy of LA-ICP-MS analysis is usually around ±30 % [1], the deviation limit from the average for a sample related to a given form should be increased to 50 % (20 % due to natural heterogeneity plus 30 % analytical error). Unfortunately, in this work, it was not possible to apply the technology of analytical data selections for single crystals (ADSSC) to separate the surface and volume components of the impurity content [1, 18] due to the insufficient number of idiomorphic crystals in the experiments. The correlation coefficients r between the elements in the crystal volume and in the surface layer were calculated in Python 3.9.7 using the Pandas library. The reliability of the correlation was assessed using Pearson's criterion.
Experimental results
Pyrite crystals up to 2 mm in size were obtained in various associations with enargite, sphalerite, and covellite (Table 1, Fig.1). Pyrite has characteristic habit forms, predominantly {100}, usually complicated {111}, less often {110} and {hk0}, but mainly crystals were subhedral with fragmentary faceting.
Table 1
Hydrothermal synthesis of pyrite with impurities at 450 °C and a pressure of 1 kbar
|
Experiment number |
Composition of the initial charge, wt.%* |
Composition of the solution, wt.% |
Synthesized phases** |
||||||||||||
|
Main components |
Impurity components |
||||||||||||||
|
(S/Fe)at |
Fe + S |
ZnS |
MnS |
NiO |
CoO |
CuO |
As |
Se |
Au |
Pt |
Pd |
||||
|
1 |
1.9 |
70 |
10 |
3.33 |
3.33 |
3.33 |
3.33 |
3.33 |
– |
1.12 |
1.12 |
1.11 |
9 NH4Cl + 1 Na2S |
Py + Sph + En |
|
|
2 |
2.3 |
80 |
10 |
1.67 |
1.67 |
1.67 |
1.67 |
1.67 |
– |
0.55 |
0.55 |
0.55 |
10 NH4Cl |
Py + En + Sph |
|
|
3 |
2.3 |
85.8 |
1.67 |
1.67 |
3.34 |
3.34 |
1.67 |
0.83 |
– |
0.56 |
0.56 |
0.56 |
10 NH4Cl |
Py + En |
|
|
4 |
2.3 |
80 |
10 |
1.67 |
1.67 |
1.67 |
1.67 |
– |
1.67 |
0.55 |
0.55 |
0.55 |
10 NH4Cl |
Py + Сv + Sph |
|
|
5 |
2.3 |
78.3 |
1.67 |
3.33 |
5 |
5 |
3.33 |
1.67 |
– |
0.56 |
0.56 |
0.56 |
10 NH4Cl |
Py + En |
|
|
6 |
1.9 |
85.8 |
1.67 |
1.67 |
3.34 |
3.34 |
1.67 |
0.83 |
– |
0.56 |
0.56 |
0.56 |
9 NH4Cl + 1 Na2S |
Py + Sph + En |
|
|
7 |
1.9 |
78.3 |
1.67 |
3.33 |
5 |
5 |
3.33 |
1.67 |
– |
0.56 |
0.56 |
0.56 |
9 NH4Cl + 1 Na2S |
Py + En |
|
|
8 |
2.3 |
85.8 |
1.67 |
1.67 |
3.34 |
3.34 |
1.67 |
– |
0.83 |
0.56 |
0.56 |
0.56 |
10 NH4Cl |
Py |
|
|
9 |
2.5 |
70 |
10 |
3.33 |
3.33 |
3.33 |
3.33 |
– |
3.33 |
1.12 |
1.12 |
1.12 |
10 NH4Cl |
Py + Cv + Sph |
|
|
10 |
2.3 |
78.3 |
1.67 |
3.34 |
5 |
5 |
3.34 |
– |
1.67 |
0.56 |
0.56 |
0.56 |
10 NH4Cl |
Py |
|
* Charge weight 6 g. ** Py – pyrite, Sph – sphalerite, En – enargite, Cu3AsS4, Cv – Fe, Se-containing covellite.
According to the XRD, pyrite crystals have a slightly increased unit cell parameter (0.5422-0.5427 nm) compared to the standard value for pure pyrite of 0.5418 nm, the sizes of the crystallites indicate a relatively perfect submicroscopic structure – the sizes of the CSR are 92-156 nm. No crystalline phases other than pyrite were detected in the crystals at the XRD sensitivity level (1 wt.%).
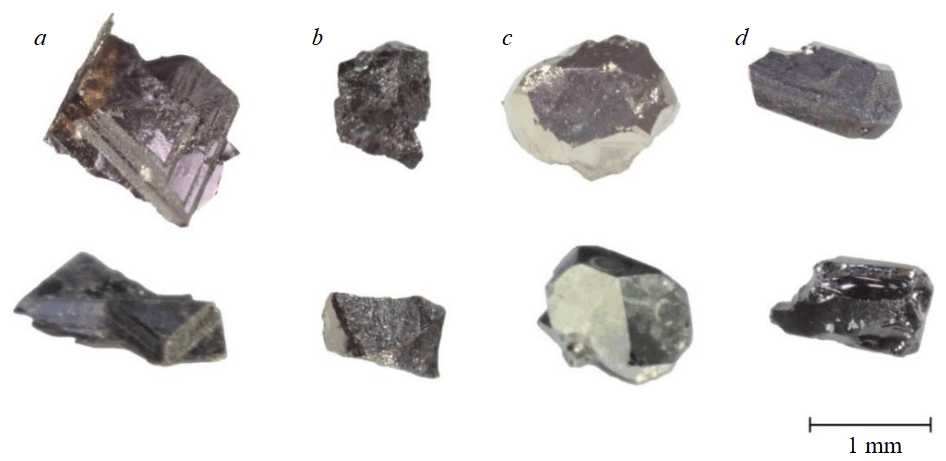
Fig.1. Synthesised crystals of pyrite and associated minerals: a – covellite; b – sphalerite; c – pyrite; d – enargite
Study of the surface of pyrite and its accompanying phases using SEM-EDS and EPMA methods showed that sphalerite is present in the form of polycrystalline aggregates, which greatly complicates its analysis. According to quantitative EPMA, enargite is characterized by a slight copper deficiency (calculated formula Cu2.95AsS4, exp. 2, Table 1). It contains a fairly large amount of Au (400 μg/g) compared to pyrite. Covellite contains Fe and Se, as well as Au (780-980 μg/g). Its chemical formulas, based on the analysis of crystals from exp. 4 and 9 (Table 1), indicate a slight excess of anions: (Cu0.9Fe0.17)1.07(SSe0.12)1.12 and (Cu0.93 Fe0.18)1.11(SSe0.21)1.21 respectively.
In Figure 2, on a clean surface selected for LA-ICP-MS analysis, near the laser crater, analysis at points S10 and S11 shows a surface composition close to pyrite, but with a slight sulfur deficiency: FeS1.87 and FeS1.74 respectively.
Fine phases and their clusters on the surface (S12, S13) are close in stoichiometry to sphalerite (Zn, Fe, Mn, Cu)S. They are characterized by Cu contents of 1.5-2 at.% and unusually high Mn contents of 7.5-11 at.%. Some larger particles contain As and Cu (about 1 and 2 at.%, respectively, S14); no other impurity elements were detected by SEM-EDS analysis. It should be borne in mind that the data obtained for microparticles on the surface are purely estimates. However, their comparison with the results for the flat surface on clean areas of the crystal face shows that the capture of the pyrite matrix during analysis is minimal (judging by the Fe and S contents).
The results of determining the pH and element content in the fluids captured by the traps are presented in Table 2.
Table 2
Elemental content in fluids based on atomic absorption spectrometry of solutions from traps
|
Experiment number |
Element content, μg/g |
pH of the solution in the trap |
|||||||||
|
Fe |
Co |
Ni |
Mn |
Cu |
Zn |
As |
Au |
Pt |
Pd |
||
|
1 |
56 |
0.47 |
0.08 |
720 |
39 |
770 |
300 |
1.2 |
0.11 |
0.03 |
7.4 |
|
2 |
92 |
2.8 |
0.48 |
165 |
14 |
1850 |
235 |
0.74 |
0.19 |
0.06 |
2.2 |
|
3 |
330 |
1.6 |
0.42 |
270 |
65 |
600 |
26 |
0.75 |
0.12 |
0.01 |
5.2 |
|
4 |
43 |
0.26 |
0.1 |
22 |
84 |
2650 |
– |
1.6 |
0.09 |
0.02 |
1.6 |
|
5 |
70 |
2.8 |
0.16 |
280 |
28 |
575 |
40 |
0.53 |
0.25 |
0.02 |
2.6 |
|
6 |
90 |
2.7 |
0.58 |
195 |
62 |
650 |
18 |
1.9 |
0.22 |
0.02 |
7.0 |
|
7 |
95 |
4.5 |
0.66 |
400 |
48 |
250 |
16 |
0.59 |
0.26 |
0.04 |
6.8 |
|
8 |
140 |
4.1 |
1.0 |
115 |
100 |
525 |
– |
1.6 |
0.29 |
0.02 |
6.2 |
|
9 |
69 |
2.1 |
1.1 |
210 |
71 |
3200 |
– |
0.83 |
0.18 |
0.02 |
1.7 |
|
10 |
230 |
14.8 |
2.6 |
65 |
215 |
1320 |
– |
1.1 |
0.25 |
0.02 |
5.8 |
Of the impurity elements studied in this work, only selenium was not determined in the fluid due to the lack of an appropriate certified method. The contents of platinoids (Pt, Pd) exceed the minimum detection limit (MDL) by at least 2 times. Table 3 presents the data of LA-ICP-MS analysis of impurity elements in the volume and surface layer of pyrite crystals with a thickness of ~20 μm, obtained by the CBSS procedure described above.
Table 3
Chemical compositions of the volume (vol) and surface layer (sur) of pyrite crystals and the selectivity parameter S = Csur/Cvol according to LA-ICP-MS data
|
Sample number |
Main impurities, wt.% |
Microimpurities, µg/g |
|||||||||
|
Co |
Ni |
Cu |
Se |
Mn |
Zn |
As |
Pd |
Pt |
Au |
||
|
1vol |
0.32±0.04 |
0.032±0.006 |
0.24±0.04 |
– |
3±3 |
1.4±0.2 |
55±4 |
0.14±0.03 |
0.2±0.1 |
1.5±0.9 |
|
|
1sur |
1.01±0.09 |
0.046±0.004 |
1.3±0.1 |
– |
50±10 |
70±30 |
220±60 |
0.58±0.09 |
n/d |
12±4 |
|
|
S |
3.2 |
1.4 |
5.4 |
– |
16.7 |
50 |
4 |
4.1 |
n/a |
8 |
|
|
2vol |
0.29±0.03 |
0.04±0.005 |
0.41±0.05 |
– |
n/d |
2.1±0.4 |
8±3 |
0.1±0.03 |
n/d |
1.8±0.4 |
|
|
2sur |
0.6±0.1 |
0.03±0.01 |
0.79±0.02 |
– |
15±10 |
10±4 |
25±10 |
0.34±0.08 |
n/d |
6±3 |
|
|
S |
2.1 |
0.8 |
1.9 |
– |
n/a |
4.8 |
3.1 |
3.4 |
n/a |
3.3 |
|
|
3vol |
0.41±0.09 |
0.041±0.008 |
1.03±0.03 |
– |
n/d |
1.8±0.6 |
25±4 |
0.27±0.05 |
n/d |
2±1 |
|
|
3sur |
0.7±0.2 |
0.03±0.01 |
4.1±0.9 |
– |
8±4 |
26±7 |
50±30 |
3.4±0.9 |
n/d |
18±6 |
|
|
S |
1.7 |
0.7 |
4 |
– |
n/a |
14.4 |
2 |
12.6 |
n/a |
9 |
|
|
4vol |
0.2±0.03 |
0.035±0.005 |
0.46±0.06 |
0.88±0.05 |
4±2 |
1.7±0.4 |
– |
36±6 |
n/d |
1±0.5 |
|
|
4sur |
0.18±0.03 |
0.012±0.002 |
0.5±0.1 |
0.91±0.07 |
13±10 |
5.4±0.5 |
– |
200±40 |
n/d |
90±10 |
|
|
S |
0.9 |
0.3 |
1.1 |
1 |
3.2 |
3.2 |
– |
5.6 |
n/a |
90 |
|
|
5vol |
0.55±0.08 |
0.037±0.006 |
1.05±0.07 |
– |
0.6±0.3 |
1.9±0.3 |
19±1 |
3.4±0.9 |
2±2 |
3±2 |
|
|
5sur |
0.6±0.3 |
0.03±0.01 |
1.4±0.2 |
– |
14±3 |
32±6 |
250±60 |
4±1 |
0.4±0.1 |
31±8 |
|
|
S |
1.1 |
0.8 |
1.3 |
– |
23.3 |
16.8 |
13.2 |
1.2 |
0.2 |
10.3 |
|
|
6vol |
0.28±0.06 |
0.04±0.008 |
0.8±0.1 |
– |
n/d |
1.8±0.2 |
22±1 |
70±20 |
n/d |
n/d |
|
|
6sur |
0.54±0.04 |
0.12±0.01 |
1.3±0.1 |
– |
4±1 |
4±2 |
31±7 |
310±30 |
n/d |
1.2±0.7 |
|
|
S |
1.9 |
3 |
1.6 |
– |
n/a |
2.2 |
1.4 |
4.4 |
n/a |
n/a |
|
|
7vol |
0.23±0.04 |
0.025±0.004 |
0.51±0.05 |
– |
1.3±0.2 |
2.1±0.2 |
19.0±0.8 |
170±50 |
0.4±0.1 |
n/d |
|
|
7sur |
0.5±0.04 |
0.055±0.005 |
0.8±0.1 |
– |
6±5 |
5±1 |
18±2 |
670±90 |
n/d |
2±1 |
|
|
S |
2.2 |
2.2 |
1.6 |
– |
4.6 |
2.4 |
0.9 |
3.9 |
n/a |
n/a |
|
|
8vol |
0.18±0.07 |
0.014±0.003 |
0.9±0.2 |
0.038±0.003 |
1.5±0.2 |
2.3±0.3 |
– |
24±4 |
n/d |
n/d |
|
|
8sur |
0.5±0.2 |
0.023±0.005 |
1.6±0.1 |
0.026±0.002 |
5±1 |
5.4±0.6 |
– |
90±20 |
0.3±0.1 |
0.8±0.1 |
|
|
S |
2.8 |
1.6 |
1.8 |
0.7 |
3.3 |
2.3 |
– |
3.8 |
n/a |
n/a |
|
|
9vol |
0.23±0.09 |
0.013±0.002 |
0.41±0.07 |
1.7±0.1 |
3±1 |
2±1 |
– |
0.14±0.05 |
n/d |
2±1 |
|
|
9sur |
0.26±0.05 |
0.012±0.003 |
0.51±0.06 |
1.1±0.1 |
10±6 |
6±1 |
– |
0.2±0.2 |
0.6±0.3 |
13±6 |
|
|
S |
1.1 |
0.9 |
1.2 |
0.6 |
3.3 |
3 |
– |
1.4 |
n/a |
6.5 |
|
|
10vol |
0.45±0.09 |
0.018±0.005 |
1.42±0.09 |
0.19±0.02 |
2.2±0.2 |
1.5±0.2 |
– |
8±2 |
0.4±0.1 |
3±3 |
|
|
10sur |
0.8±0.2 |
0.022±0.007 |
1.5±0.2 |
0.12±0.02 |
n/d |
4.2±0.7 |
– |
13±3 |
4±3 |
7±2 |
|
|
S |
1.8 |
1.2 |
1.1 |
0.6 |
n/a |
2.8 |
– |
1.6 |
10 |
2.3 |
|
Note. Dash – no element added to the system; n/d – not detected (below MDL or only a small number of points above MDL); n/a – not available.
The selectivity parameter S of the surface NAP is also given, expressed as a simple ratio of the concentrations of the element in the surface and in the volume [2]. The error is given for α = 0.9. In most cases, the Pt content is below the MDL, and it is difficult to make any judgments about its behavior. It should be borne in mind that the obtained S values are minimal, since, as measurements have shown, the average crater depth is 20 μm, i.e., significantly exceeds the thickness of the NAP layer on pyrite (~500 nm). Despite this, LA-ICP-MS shows good agreement with other (independent) methods [2]. The reason is that for incompatible TE, super-enrichment is associated only with the first layer with a thickness of 1-1.5 μm, while deeper layers practically do not differ in composition from the volume. In this work, we are interested not so much in the absolute values of pyrite surface enrichment with impurities, as in the relationships between these impurities in the volume and surface layer of crystals. The most statistically reliable correlations between elements are illustrated in Fig.3. The remaining correlations (Table 4) are discussed at the level of trends; their reliability cannot be confirmed statistically, mainly due to insufficient sample sizes.
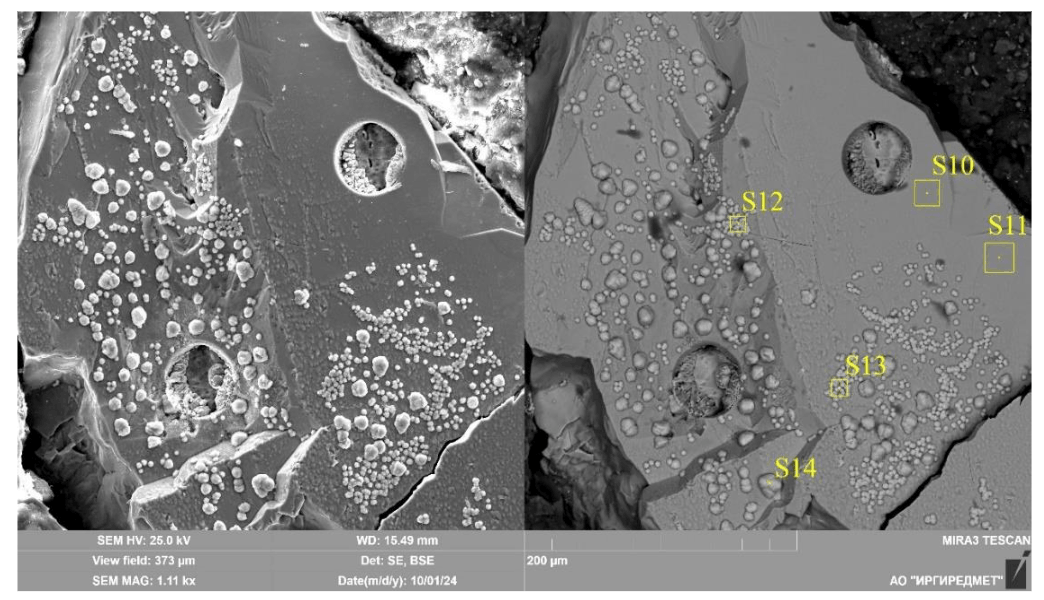
Fig.2. Surface of a pyrite crystal facet in secondary (SE) and backscattered electrons (BSE). Two LA-ICP-MS analysis craters are visible, SEM-EDS analysis points are shown
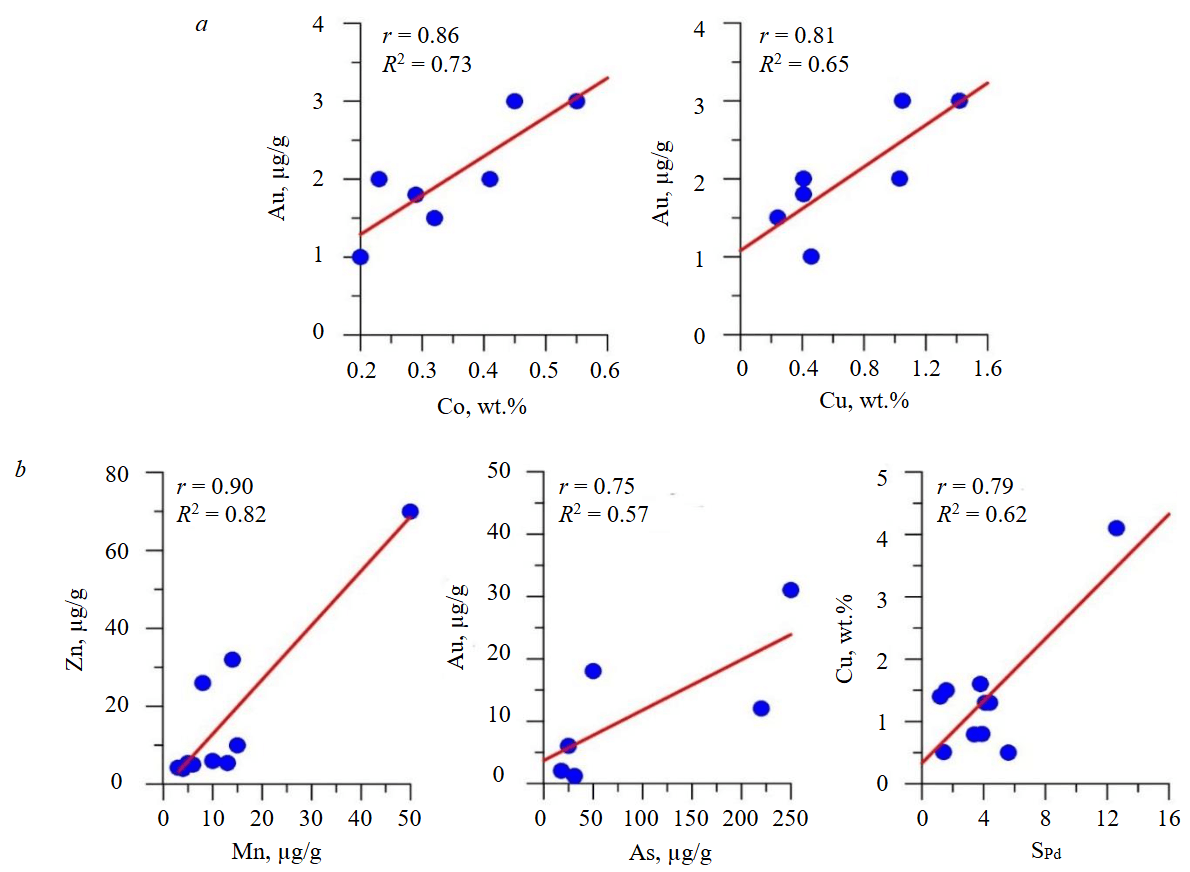
Fig.3. Correlations of impurity elements in the bulk (a) and on the surface (b) of the synthesized pyrite crystals. The P values are 0.014 (Au-Co), 0.028 (Au-Cu), 0.001 (Zn-Mn), 0.084 (Au-As), 0.0065 (Cu-SPd). The correlations are statistically significant as P < 0.1 at a significance level corresponding to a confidence probability of 0.9
Discussion of results
Contents and correlations of elements in volume (Table 3, vol, Table 4, Fig.3, a).
When discussing the results obtained, we will take into account the previously established fact of the presence of a non-autonomous phase in the surface layer of pyrite crystals [19]. The sulfur deficiency detected by SEM-EDS analysis may be related to this circumstance, namely, the incorporation into the analysis of a surficial NAP of pyrrhotite stoichiometry, with a layer thickness of ~300-500 nm, according to atomic force microscopy, X-ray photoelectron spectroscopy, and Auger electron spectroscopy data [19]. It should also be noted that due to the limited experimental data, the interpretation of the results was carried out mainly within the framework of descriptive statistics – primary data analysis and visualization.
Table 4
Sampling correlations with unconfirmed statistical significance
|
Elements or parameters * |
Belonging to the volume v, surfaces s, fluid f |
Correlation coefficient r |
Elements or parameters * |
Belonging to the volume v, surfaces s, fluid f |
Correlation coefficient r |
|
|
Au-As |
v-v |
–0.46 |
Zn-As |
s-s |
0.8 |
|
|
Co-Ni |
v-v |
0.33 |
Mn-As |
s-s |
0.65 |
|
|
Co-Ni |
f-f |
0.93 |
Zn-Se |
s-s |
0.68 |
|
|
Zn-Mn |
v-v |
–0.49 |
Mn-Se |
s-s |
0.85 |
|
|
Pd-pH |
v-f |
0.4 |
Pd-SAu |
v-s/v |
0.96 |
|
|
Au-Co |
s-s |
–0.49 |
Pd-SAu |
s-s/v |
0.99 |
|
|
Au-Cu |
s-s |
–0.18 |
As-SAu |
s-s/v |
0.66 |
|
|
Pd-Ni |
s-s |
0.48 |
SAs-SAu |
s/v-s/v |
0.54 |
|
|
Ni-pH |
s-f |
0.59 |
SPd-SCu |
s/v-s/v |
0.52 |
|
* Selectivity S is expressed as the ratio of the contents in the surface layer s and in the volume of the crystal v.
Gold shows agreement with the limit of its incorporation into hydrothermal pyrite known from the literature – 3±1 μg/g [20]. Data on the strong influence of As on this value [21-23] for volume contents under the conditions of our experiments are not confirmed: Au and As show a negative correlation (r = –0.46, Table 4). A discrepancy between Au and As is noted for conditions of rapid pyrite crystallization [24], and no connection with As is noted for the “invisible” form of Au at high concentrations [22]. The question of whether the Au-As connection is of a crystal-chemical nature or caused by structural defects [25], has not been definitively resolved. At the same time, there is a clear correlation between Au and Co and Cu (r = 0.86 and 0.81, respectively, Fig.3, a) – the main cationic impurities in the synthesized pyrite, distributed fairly uniformly. The scheme of joint entry of gold and copper into pyrite assumes a neutral vacancy in the metal sublattice: Au+ + Cu+ = Fe2+ + VFe. The nature of the correlation between Au and Co is not entirely clear; perhaps cluster isomorphism is at work here, which has recently been given increasing importance [26]. In particular, in [27] high-resolution atomic probe tomography was used to identify Co nanoclusters in cobalt-enriched pyrite (up to 1.4 wt.%).
The methods used to determine the conditions of formation and diagnose the genetic type of pyrite, based on the contents of impurity elements and their ratios (Co/Ni, etc.), are still empirical in nature and do not have a reliable theoretical and experimental basis. The Co/Ni ratio is a priority in this regard. Cobalt and nickel in the volume of pyrite crystals are positively correlated, but weakly (r = 0.33, Table 4), which is quite unexpected given their high correlation in the fluid (r = 0.93, Table 4) and natural data showing, as a rule, stable correlation characteristics of these elements in pyrites of various genesis. The contents of Co and Ni and their ratios in pyrite are widely used as empirical indicators of the conditions of its formation. It is believed that a Co/Ni ratio < 1 characterizes sedimentary or diagenetic pyrite, while a ratio > 1 is associated with a magmatic-hydrothermal source [28-30]. Formally, this corresponds to our results: according to Table 3, pyrite in a hydrothermal system at 450 °C and 1 kbar has an average Co/Ni ratio in the crystal volume of 12±6, which can be taken as a characteristic of relatively high-temperature hydrothermal pyrite.
The average As content in pyrite crystals is 25±13 μg/g (average of 6 values with the smallest errors), with pyrite coexisting with its own As phase, enargite (Cu3AsS4) and, thus, it is close to arsenic saturation at a temperature of 450 °C. The zinc and manganese contents are close to each other and to the MDL of these elements and are 1.9±0.2 and 2.2±0.9, respectively. The correlation between them is negative (Table 4), but insignificant for this statistical sample size. Obviously, the isomorphism of these elements in the pyrite structure is extremely limited. Of considerable interest is the situation with palladium, which shows wide variations in experiments – from the first tenths of μg/g to several tens of μg/g. It has recently been shown that pyrite obtained by the salt solution-melting method can contain up to 0.7 wt.% Pd at 580 °C and sulfur fugacity lg fS2 = –0.4 [31]. X-ray absorption spectroscopy has shown that Pd replaces Fe in a divalent form. In our experiments, Pd in pyrite does not correlate significantly with other elements or correlates negatively; there is only a weak positive correlation with the pH of the solution (r = 0.4, Table 4), which may indicate that its behavior depends on the chemical environment in the fluid (in particular, on fS2 ). Experiments with sulfur activity control should provide a more accurate answer to this question. Our data only show (see Table 3) that the presence of impurities such as As and Se is not in itself the cause of high Pd, Au, and Pt contents in pyrite.
Contents and correlations of elements in the surface (Table 3, sur, Table 4, Fig.3, b).
Surface concentrations usually exceed bulk concentrations, especially in the case of microelements, and correlation relationships often reverse. Thus, the strong positive correlation between Au and Co and Cu becomes negative at the surface (r = –0.49 and –0.18, Table 4). The Co/Ni ratio increases at the surface relative to the volume and averages 19±9. Co is absorbed more strongly by the surface than Ni, which further reduces their correlation compared to the volume. Work [32] shows that high concentrations of Co in FeS2 may be associated with a phase size effect, i.e., a phenomenon dependent on surface energy. Co lowers this value, which is why it concentrates on the surface of pyrite. The correlation between Zn and Mn on the surface becomes positive and significant (r = 0.9, Fig.3, b). This is apparently due to the appearance on the surface of microphases with stoichiometry close to sphalerite and high Zn and Mn contents. In contrast to the situation in the volume, Au correlates with As (r = 0.75, Fig.3, b). It has been suggested that the relationship between Au and As may be surface-related [33, 34], and this is confirmed by our experiments. It is believed [34], that the presence of As causes distortion and surface modification of the structure, facilitating the entry of large cations (Au+, etc.). Pd in the surface correlates positively with Ni (r = 0.48, Table 4), while its correlation with other elements (Cu, Co, Zn, As) is negative. Ni, like Pd, correlates with the pH of the fluid (r = 0.59, Table 4). Palladium, a critically important metal widely used in catalysis, electronics, and hydrogen energy, exhibits unusual behavior in pyrite, concentrating mainly on its surface, which suggests the possibility of its concurrent extraction from pyrite ores at gold mining enterprises. Several palladium sulfides are known, and some of them (PdS, and at higher sulfur activity, possibly PdS2) can be precipitated from solution in the form of nanoparticles on the surface of iron sulfides – pyrite and pyrrhotite [35]. The positive correlation of Zn and Mn with As (r = 0.8 and 0.65, Table 4) may be associated with the incorporation of As in the surface microphases of sphalerite stoichiometry (see Fig.2). Perhaps for the same reason, Zn and Mn correlate with Se (r = 0.68 and 0.85, Table 4), which replaces sulfur in such phases, but the number of experiments with selenium is too small to draw reliable conclusions.
Selectivity of element accumulation
Comparison of the obtained data (see Table 3) with previously published data is possible for Mn and Pd [2]. The selectivity parameters for pyrite synthesized at 400 °C and 1 kbar in 10 % NH4Cl in association with pyrrhotite, according to the ADSSC and LA-ICP-MS methods, averaged 1.2 and 15.6, respectively. According to Table 3, S for Mn averaged 9, and S for Pd – 4.2. Two circumstances should be taken into account here: in work [2] the Mn content in the volume of pyrite crystals and their surface was significantly higher, which naturally reduced the relative magnitude of the surface concentration effect; the second circumstance is the significantly more complex composition of the system in the present work, which could affect the compositions of the surface phases. Thus, it can be concluded that the numerical value of selectivity strongly depends on the experimental conditions and the composition of the system, although its qualitative nature remains unchanged (S > 1).
Some of the most interesting correlations involving selectivity are presented in Table 4 and Fig.3, b. It can be assumed that the factors responsible for the selectivity of Au are also responsible for the content of Pd, both in the volume and in the surface layer. Formally high r values (Table 4) should not be overestimated due to the small number of points and their clustering. The same can be said about As, whose correlation coefficient with S Au in the surface is 0.66, and the selectivity of S As correlates with S Au (r = 0.54) (Table 4). The correlation of S Pd with the Cu content in the surface and S Cu (r = 0.79 and 0.52, respectively, Fig.3, b, Table 4) may indicate the participation of surface phases based on copper sulfides – chalcopyrite and covellite. The latter was recorded in the form of crystals in systems with Se (see Table 1, Fig.1).
If the phase composition of the surface is formed by a mechanism involving the participation of NAPs in the growth process, then the conditions under which certain components enter into the composition of NAP according to the principle of continuity of phase formation on mineral surfaces become important [36]. At the same time, the precursors of bulk phases that appear on the surface-nanoscale NAP – gradually change their composition, forming surface nuclei of a stable or metastable autonomous phase, which we can observe on the surface in the form of nano- and microparticles [1].
Conclusion
- The first experimental data on the ratios of impurity element contents and their correlation relationships in the volume and surface layer of pyrite crystals synthesized under hydrothermal conditions at 450 °C and a pressure of 1 kbar have been obtained.
- Surface element contents generally exceed bulk contents, especially for microelements, and correlation relationships are found to be unstable. The surface phases responsible for this behavior exhibit selectivity primarily with respect to incompatible elements in pyrite (Mn, Zn, As, Pd, Au), for which the selectivity parameter S averages 9.1; 10.2; 6, 4.2, and 18.5, respectively. The main impurities (Co, Cu, Ni) fractionate more weakly into the surface (S = 1.9; 2.1, and 1.3, respectively); nevertheless, this should be taken into account when analyzing the edge areas of even flat-polished crystals when determining the typomorphic relationships of elements (Co/Ni, etc.).
- The presence of As and Se in the system is not in itself a cause of high Pd, Au, and Pt contents in pyrite. The Au content in the crystal volume, identified as a structural impurity [1, 20], does not exceed 3 μg/g and correlates negatively with As; at the surface, it increases by about an order of magnitude and shows a positive correlation with As, confirming the surface nature of the relationship between these elements. Pd shows wide variations in content and no correlations with other elements (except for Ni in the surface); its behavior appears to be determined by the sulfur regime in the experiments. In the volume of pyrite crystals, there is a strong positive correlation between Au and the main cationic impurities Co and Cu, which is presumably associated with cluster and vacancy mechanisms of Au entry into pyrite, which are not manifested at the surface.
References
- Tauson V.L., Lipko S.V., Smagunov N.V., Kravtsova R.G. Trace Element Partitioning Dualism under Mineral–Fluid Interaction: Origin and Geochemical Significance. Minerals. 2018. Vol. 8. Iss. 7. N 282. DOI: 10.3390/min8070282
- Lipko S., Tauson V., Smagunov N., Babkin D., Parkhomenko I. Distribution of Trace Elements (Ag, Pd, Cd, and Mn) between Pyrite and Pyrrhotite and Selectivity of Surficial Nonautonomous Phases in a Hydrothermal System. Minerals. 2022. Vol. 12. Iss. 9. N 1165. DOI: 10.3390/min12091165
- Vukmanovic Z., Reddy S.M., Godel B. et al. Relationship between microstructures and grain-scale trace element distribution in komatiite-hosted magmatic sulphide ores. Lithos. 2014. Vol. 184-187, p. 42-61. DOI: 10.1016/j.lithos.2013.10.037
- Fougerouse D., Reddy S.M., Sumail et al. Dislocation-mediated interfacial re-equilibration of pyrite: An alternative model to interface-coupled dissolution-reprecipitation and gold remobilisation. Geochimica et Cosmochimica Acta. 2024. Vol. 374, p. 136-145. DOI: 10.1016/j.gca.2024.04.027
- King S.A., Cook N.J., Ciobanu C.L. et al. Coupled Microstructural EBSD and LA-ICP-MS Trace Element Mapping of Pyrite Constrains the Deformation History of Breccia-Hosted IOCG Ore Systems. Minerals. 2024. Vol. 14. Iss. 2. N 198. DOI: 10.3390/min14020198
- Vikentyev I.V. Invisible and Microscopic Gold in Pyrite: Methods and New Data for Massive Sulfide Ores of the Urals. Geology of Ore Deposits. 2015. Vol. 57. N 4, p. 237-265. DOI: 10.1134/S1075701515040054
- Gopon P., Douglas J.O., Auger M.A. et al. A Nanoscale Investigation of Carlin-Type Gold Deposits: An Atom-Scale Elemental and Isotopic Perspective. Economic Geology. 2019. Vol. 114. N 6, p. 1123-1133. DOI: 10.5382/econgeo.4676
- Tolstykh N., Bortnikov N., Zhukova I. et al. Trace elements in pyrite from Ausingle bond Ag epithermal deposits of Kamchatka, Russia: Comparison with geochemical features of mineral systems. Journal of Geochemical Exploration. 2025. Vol. 275. N 107774. DOI: 10.1016/j.gexplo.2025.107774
- Guotao Sun, Qingdong Zeng, Lingli Zhou et al. Mechanisms for invisible gold enrichment in the Liaodong Peninsula, NE China: In situ evidence from the Xiaotongjiapuzi deposit. Gondwana Research. 2022. Vol. 103, p. 276-296. DOI: 10.1016/j.gr.2021.10.008
- Kexin Wang, Degao Zhai, Jiajun Liu, Han Wu. LA-ICP-MS trace element analysis of pyrite from the Dafang gold deposit, South China: Implications for ore genesis. Ore Geology Reviews. 2021. Vol. 139. Part A. N 104507. DOI: 10.1016/j.oregeorev.2021.104507
- Yumiao Meng, Xiaowen Huang, Chunxia Xu, Songning Meng. Trace element and sulfur isotope compositions of pyrite from the Tianqiao Zn–Pb–Ag deposit in Guizhou province, SW China: implication for the origin of ore-forming fluids. Acta Geochimica. 2022. Vol. 41. Iss. 2, p. 226-243. DOI: 10.1007/s11631-021-00511-0
- Lei Yan, Xianzheng Guo, Yu Fan et al. The occurrence of cobaltite nanoparticles in pyrite from the De’erni deposit, NW China. Ore Geology Reviews. 2024. Vol. 173. N 106268. DOI: 10.1016/j.oregeorev.2024.106268
- Bralia A., Sabatini G., Troja F. A revaluation of the Co/Ni ratio in pyrite as geochemical tool in ore genesis problems. Mineralium Deposita. 1979. Vol. 14. Iss. 3, p. 353-374. DOI: 10.1007/BF00206365
- Volkov A.V., Sidorov A.A. Invisible gold. Herald of the Russian Academy of Sciences. 2017. Vol. 87. N 1, p. 40-48. DOI: 10.1134/S1019331617010051
- Palyanova G.A. Gold and Silver Minerals in Sulfide Ore. Geology of Ore Deposits. 2020. Vol. 62. N 5, p. 383-406. DOI: 10.1134/S1075701520050050
- Molchanov V.P. Development of approaches to the creation of technology for extracting “invisible” gold from the ores of the Sukhoe deposit (Primorye). Proceedings of the Voronezh State University of Engineering Technologies. 2022. Vol. 84. N 3, p. 177-182 (in Russian). DOI: 10.20914/2310-1202-2022-3-177-182
- Hongping He, Haiyang Xian, Jianxi Zhu et al. Evaluating the physicochemical conditions for gold occurrences in pyrite. American Mineralogist. 2023. Vol. 108. N 1, p. 211-216. DOI: 10.2138/am-2022-8207
- Tauson V.L., Lustenberg E.K. Quantitative determination of modes of gold occurrence in minerals by the statistical analysis of analytical data samplings. Geochemistry International. 2008. Vol. 46. N 4, p. 423-428. DOI: 10.1134/S0016702908040101
- Tauson V.L., Babkin D.N., Lustenberg E.E. et al. Surface typochemistry of hydrothermal pyrite: Electron spectroscopic and scanning probe microscopic data. I. Synthetic pyrite. Geochemistry International. 2008. Vol. 46. N 6, p. 565-577. DOI: 10.1134/S0016702908060037
- Tauson V.L. Gold solubility in the common gold-bearing minerals: Experimental evaluation and application to pyrite. European Journal of Mineralogy. 1999. Vol. 11. N 6, p. 937-947. DOI: 10.1127/ejm/11/6/0937
- Deditius A.P., Reich M., Kesler S.E. et al. The coupled geochemistry of Au and As in pyrite from hydrothermal ore deposits. Geochimica et Cosmochimica Acta. 2014. Vol. 140, p. 644-670. DOI: 10.1016/j.gca.2014.05.045
- Filimonova O.N., Tagirov B.R., Trigub A.L. et al. The state of Au and As in pyrite studied by X-ray absorption spectroscopy of natural minerals and synthetic phases. Ore Geology Reviews. 2020. Vol. 121. N 103475. DOI: 10.1016/j.oregeorev.2020.103475
- Kusebauch C., Gleeson S.A., Oelze M. Coupled partitioning of Au and As into pyrite controls formation of giant Au deposits. Science Advances. 2019. Vol. 5. Iss. 5. N eaav5891. DOI: 10.1126/sciadv.aav5891
- Ya-Fei Wu, Evans K., Si-Yu Hu et al. Decoupling of Au and As during rapid pyrite crystallization. Geology. 2021. Vol. 49. N 7, p. 827-831. DOI: 10.1130/G48443.1
- Merkulova M., Mathon O., Glatzel P. et al. Revealing the Chemical Form of “Invisible” Gold in Natural Arsenian Pyrite and Arsenopyrite with High Energy-Resolution X-ray Absorption Spectroscopy. ACS Earth and Space Chemistry. 2019. Vol. 3. Iss. 9, p. 1905-1914. DOI: 10.1021/acsearthspacechem.9b00099
- Kovalchuk E.V., Tagirov B.R., Borisovsky S.E. et al. Gold and Arsenic in Pyrite and Marcasite: Hydrothermal Experiment and Implications to Natural Ore-Stage Sulfides. Minerals. 2024. Vol. 14. Iss. 2. N 170. DOI: 10.3390/min14020170
- Xiao-Wen Huang, Yu-Miao Meng, Tao Long, Liang Qi. Cobalt mineralization in an evolving skarn system: Insights from co-bearing minerals in the Cihai Fe-Co deposit, NW China. Journal of Asian Earth Sciences. 2025. Vol. 290. N 106674. DOI: 10.1016/j.jseaes.2025.106674
- Román N., Reich M., Leisen M. et al. Geochemical and micro-textural fingerprints of boiling in pyrite. Geochimica et Cosmochimica Acta. 2019. Vol. 246, p. 60-85. DOI: 10.1016/j.gca.2018.11.034
- Baisong Du, Zuoman Wang, Santosh M. et al. Role of metasomatized mantle lithosphere in the formation of giant lode gold deposits: Insights from sulfur isotope and geochemistry of sulfides. Geoscience Frontiers. 2023. Vol. 14. Iss. 5. N 101587. DOI: 10.1016/j.gsf.2023.101587
- Hanwen Yang, Baisong Du, Santosh M. et al. Role of As in the formation of giant Au deposits: Insights from sulfur isotope and geochemistry of pyrite from the Shuangwang Au deposit, West Qinling, central China. Ore Geology Reviews. 2024. Vol. 175. N 106363. DOI: 10.1016/j.oregeorev.2024.106363
- Filimonova O.N., Snigireva I.I., Thompson P., Wermeille D. Incorporation of palladium into pyrite: Insights from X-ray absorption spectroscopy analysis and modelling. Science of the Total Environment. 2024. Vol. 920. N 170927. DOI: 10.1016/j.scitotenv.2024.170927
- ShiWen Xie, FuLai Liu, HuiNing Wang et al. Micro- to nanoscale cobalt occurrence in Co-enriched pyrite: A case study from Dahenglu Cu-Co deposit. Acta Petrologica Sinica. 2024. Vol. 40. Iss. 10, p. 3028-3036. DOI: 10.18654/1000-0569/2024.10.05
- Fleet M.E., Mumin A.H. Gold-bearing arsenian pyrite and marcasite and arsenopyrite from Carlin Trend gold deposits and laboratory synthesis. American Mineralogist. 1997. Vol. 82. N 1-2, p. 182-193. DOI: 10.2138/am-1997-1-220
- Deditius A.P., Reich M. Constraints on the solid solubility of Hg, Tl, and Cd in arsenian pyrite. American Mineralogist. 2016. Vol. 101. N 6, p. 1451-1459. DOI: 10.2138/am-2016-5603
- Romanchenko A.S., Mikhlin Yu.L. An XPS study of products formed on pyrite and pyrrhotine by reacting with palladium(II) chloride solutions. Journal of Structural Chemistry. 2015. Vol. 56. N 3, p. 531-537. DOI: 10.1134/S002247661503021X
- Tauson V.L. The Principle of Continuity of Phase Formation at Mineral Surfaces. Doklady Earth Sciences. 2009. Vol. 425A. N 3, p. 471-475. DOI: 10.1134/S1028334X09030283