Abandoned copper pyrite mines: migration of chemical elements in the aquatic environment and bottom sediments (case study of the Levikhinskaya group of deposits, Middle Urals)
- 1 — Ph.D., Dr.Sci. Chief Researcher Institute of Mining, Ural Branch of the RAS ▪ Orcid
- 2 — Ph.D. Head of Laboratory Institute of Mining, Ural Branch of the RAS ▪ Orcid
- 3 — Researcher Institute of Mining, Ural Branch of the RAS ▪ Orcid
Abstract
The work addresses the issues of hydrosphere pollution in the Middle Urals resulting from the impact of acid mine drainage from abandoned copper mines. The study examined the concentrations of macro‑ and trace components in water and bottom sediments in the area of the Levikhinsky copper‑pyrite mine, which was abandoned over 20 years ago, as well as changes in their concentrations along the following chain: mine water discharge (acidic environment) – neutralization (alkaline environment) – settling (acidic environment) – middle reach of a small river (slightly acidic environment) – mouth of a small river (neutral environment). Thermodynamic estimations showed that acidic mineralized waters are supersaturated with respect to minerals of the oxides and oxide-hydroxides groups. Strongly alkaline and slightly alkaline waters are supersaturated with respect to minerals of the oxides, oxide-hydroxides, hydroxides, and sulphates groups. Waters from all environments are close to equilibrium or undersaturated with respect to gypsum. The most intensive metal precipitation and sorption by bottom sediments occur in near‑neutral environments: the concentration ratio (CR) exceeds n·105 l/kg for Al, Fe, Cu, and Pb. The performed assessment of the degree of equilibrium of anthropogenically impacted waters with respect to minerals allowed us to determine secondary mineral formation, the forms of metal migration in water bodies, and their impact on the environment. The obtained data are essential for justifying measures aimed at improving the state of the hydrosphere.
The work was carried out with the support of the State assignment of the Institute of Mining, Ural Branch of the RAS. Topic 2 (2025-2027) “Geoinformation support for systemic assessment of nature conservation strategies in the development of mineral resources” (FUWE-2025-0002); N 125070908250-1.
Introduction
Acid mine drainage (AMD) from abandoned and flooded copper-pyrite mines is a serious global environmental issue, primarily associated with the deterioration of hydrosphere quality [1-3]. AMD saturated with toxic elements is formed as a result of the oxidative dissolution of sulphide minerals, which are exposed to external atmospheric and biological factors (water, oxygen, sulphate‑reducing or sulphide‑reducing bacteria). Such waters are characterized by low pH, high mineralization, and elevated concentrations of sulphates and various metals [4, 5]. When acidic waters enter water bodies, they cause the formation of fine ochreous sediments, which are transported by river waters over tens of kilometres. This also leads to changes in the mineral and chemical compositions of bottom sediments and the aquatic system as a whole [6-8]. The resulting sediments have low crystallinity, very small particle size, and high specific surface area, which promotes effective metal sorption by minerals [9-11]. Changes in physicochemical parameters such as pH, Eh, t (°C) determine the intensity of mineral phase dissolution and the migration of chemical elements in aquatic systems [12-14].
According to the State report “On the State of the Environment in the Sverdlovsk Region in 2021”, the main source of water body pollution in the Sverdlovsk Region is the discharge of conta-minated wastewater. The discharge of wastewater into surface water bodies amounts to 656 million m3 per year, of which 80 % is contaminated. Mining enterprises discharge approximately 44 million m3 of contaminated water annually – excluding neutralized acidic waters from abandoned mine sites, whose discharge reaches 10 million m3.
Several flooded copper mines are located in the Middle Urals (Degtyarsky, Levikhinsky, Belorechensky, Karpushikhinsky, and Lomovsky), where acid mine drainage continues to form after closure. There is a risk of contaminating the potable water supply sources for Yekaterinburg (population 1.5 million) and Nizhny Tagil (population 330 thousand) by wastewater flowing into the Chusovaya and Tagil river basins from the areas of abandoned mines. To prevent emergency situations and ensure environmental safety, measures are being implemented at five flooded copper mines using regional budget funds. These measures are aimed at localizing surface runoff, pumping out mine drainage, and treating effluents at neutralization stations.
This study focuses on the abandoned Levikhinsky copper‑pyrite mine, which has experienced a tense environmental situation in recent years due to specific hydrogeological conditions. During the flooding of underground workings, sharply non‑stationary hydrodynamic and hydrochemical regimes were observed (a rise in the groundwater level by hundreds of metres over three years and a sharp increase in the components of the chemical composition of mine drainage). After the depression cone was filled, stabilization of groundwater levels and flow rates was noted, along with a quasi‑stationary hydrochemical regime (a slow decrease in concentrations of major pollutant components). Within the boundaries of the abandoned Levikhinsky mine, several types of groundwater are formed, associated with flooded quarries, mine shafts, waste dumps, and collapse zones [15]. The discharge of acid mine drainage to the surface occurs into a sinkhole in the lowest part of the mining allotment; the flow rate is 120 m3/h (half the rate of mine water drainage during the operational period).
Despite the neutralization of AMD, metal concentrations in surface waters exceed maximum permissible levels by tens or hundreds of times [16]. As a result, the mine attracted public and regulatory attention. It was repeatedly inspected by the environmental prosecutor’s office and is recognized as a site of accumulated environmental damage. To justify an effective treatment system and eliminate pollution of the Levikha and Tagil rivers, a comprehensive analysis of data on the composition, distribution, and patterns of change in pollutants in water bodies and bottom sediments – from the discharge zone of acid mine drainage to its release into the hydrographic network – is required.
The study site has a large body of routine monitoring data, unique in terms of observation duration, sampling completeness, and result reliability [17] – about 1000 analyses for a reduced list of components and around 100 for a full list over a 20-year period. The analysis of the situation at the Levikhinsky mine is comparable in significance to studies of post‑operational processes at the Iron Mountain mine (Colorado, USA), which have been conducted by the Environmental Protection Agency (EPA, USA) using Superfund resources since the 1980s [18-20].
The aim of the work is to identify spatio-temporal patterns of hydrosphere formation within the anthropogenically impacted system of an abandoned copper mine. The following tasks were addressed: studying the chemical composition of mine drainage forming in the flooded Levikhinsky copper-pyrite mine area; assessing the degree of metal accumulation in bottom sediments; determining the forms of metal migration in water bodies and estimating the degree of saturation with respect to minerals. The research results provide a basis for justifying measures to improve the state of the hydrosphere and methods for its rehabilitation.
Study target
The Levikhinsky group of copper‑pyrite deposits is located in the Sverdlovsk Region, 120 km north of Yekaterinburg, on the eastern outskirts of the Levikha settlement (Fig.1). The main waterway is the Tagil River, which flows in a near-N-S direction 4 km to the east. The Tagil River is a right tributary of the Tura River (part of the Arctic Ocean basin) and, in terms of its water regime, belongs to the East European type, characterized by pronounced spring floods, stable summer low-water periods, and low winter runoff.
The local hydrographic network is represented by numerous tributaries of the Tagil River – the Levikha, Kuzka, Abley, Shaitanka rivers, and others – which flow in a near E-W direction. Most of the catchment area is covered by dark coniferous forest and occupied by meadows and arable land. Swampy areas are only observed in the floodplain sections of the rivers.
The Kirovgrad ore district belongs to the West‑Tagil structural metallogenic subzone. According to the tectonic zoning pattern, the area lies within the East-Tagil zone of the Tagil megazone. In the stratigraphic section, the following formations are distinguished (from bottom to top): terrigenous-basaltic, diabase-spilite-quartz-albitophyric, andesite-basaltic, and basalt-trachytic.
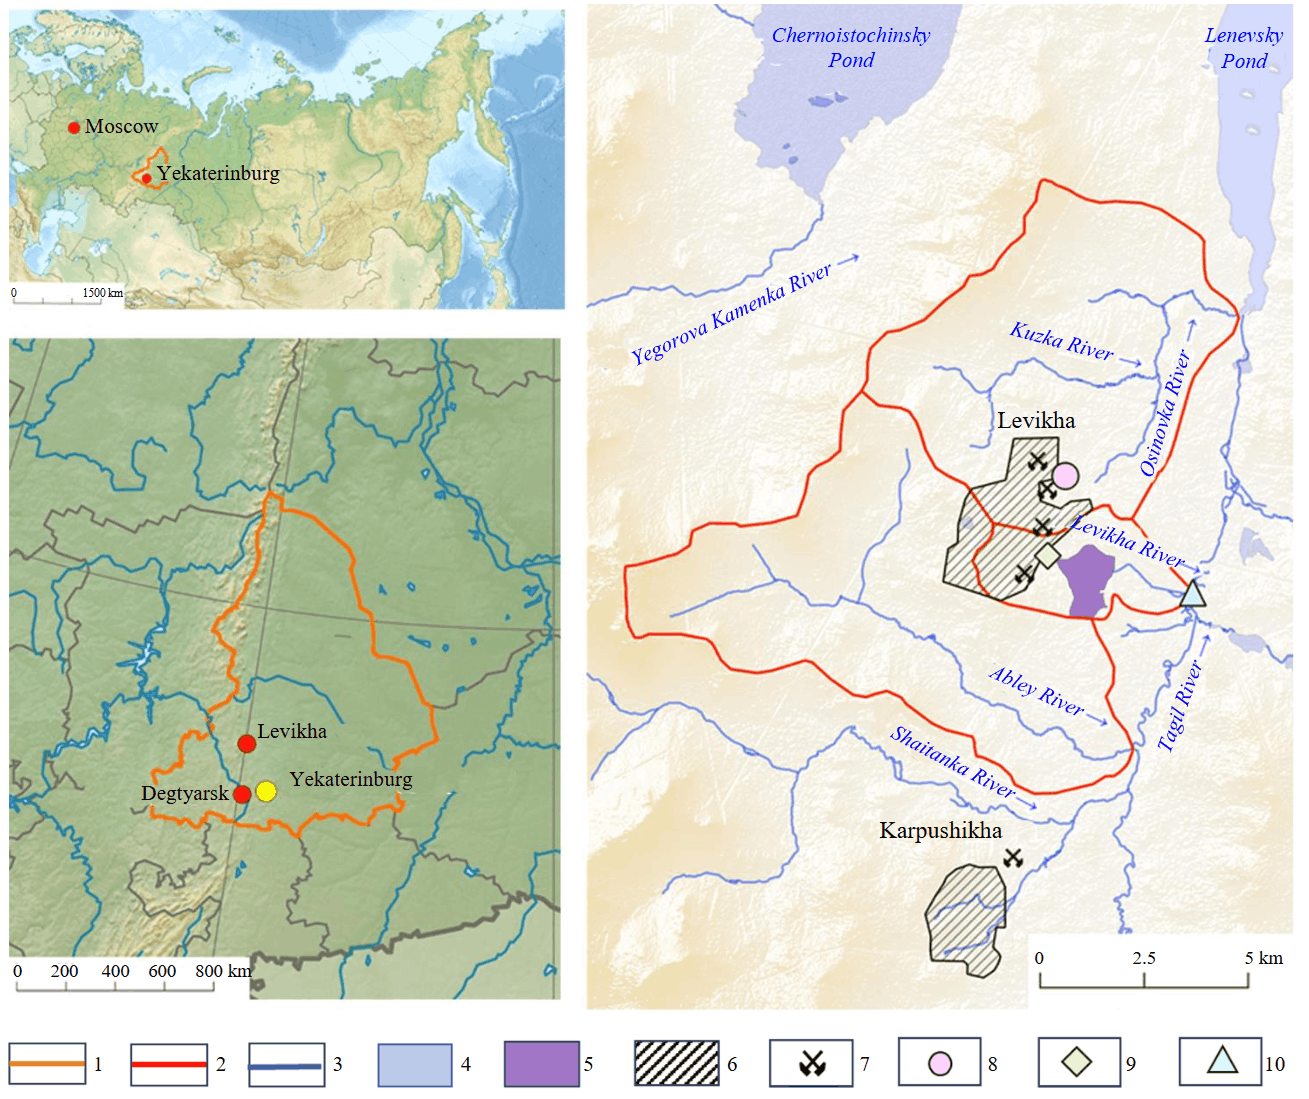
Fig.1. Overview sketch map of the study area
1 – border of the Sverdlovsk Region; 2 – local watersheds; 3 – rivers; 4 – Lenevskoye Reservoir; 5 – clarification pond; 6 – settlements; 7 – abandoned mines; 8 – AMD discharge zone; 9 – anthropogenic stream after neutralization; 10 – discharge (Levikha River mouth)
The geochemical type of the Levikhinsky deposits is copper-zinc. The mineralogical composition of the ores includes pyrite, chalcopyrite, sphalerite, bornite, fahlores, pyrrhotite, magnetite, galena, chalcocite, covellite, and native gold [21, 22]. By‑product ore components are complex and contain selenium, tellurium, indium, gold, silver, gallium, cadmium, germanium, arsenic, and other elements.
The mining allotments of the Levikhinsky mine is in the catchment basin of the Levikha, Kuzka, and Osinovka rivers. The catchment area of the Levikha River is only 9.3 km2. The AMD discharge zone is in the adjacent local catchment of the Kuzka River (also a tributary to the Tagil River). From there, acidic waters are transferred across the local watershed into the Levikha River valley. Until the late 1950s, mine drainage was discharged untreated into a swamp. In 1959, a clarification pond was constructed in the Levikha River valley.
The area has been a mining region for a long time. The main type of mineral resource was copper‑pyrite ores, which were extracted from 1929 using open‑pit and underground mining methods down to a depth of 615 m. In 2003, mining operations at the mine were discontinued due to unprofitability, and dewatering was halted.
By the end of 2006, the underground workings were completely flooded. In the area of the Levikha II mine shaft (collapse zone from level −175 m), an anthropogenic reservoir 20 m deep and with a volume of 45 thousand m3 formed, into which acid mine drainage continues to discharge to the present day. The discharge rate is approximately 120 m3/h, which is half the rate of drainage pumping during the operational period.
Since 2007, AMD is pumped to a neutralization station. After treatment with lime milk, the waters flow into the existing clarification pond and then, by gravity, along the old channel of the Levikha River into the Tagil River, where the Lenevskoye Reservoir is located. This reservoir is one of the water supply sources for Nizhny Tagil.
The water balance circuit for the Levikhinsky mine facilities is presented in Fig.2 (long-term average values are given). The mine water flow rate is 2854 m3/day. At the neutralization station, 320 m3/day of process water is used to prepare the lime milk. In total, 3174 m3/day is discharged into the clarification pond. The flow of groundwater entering the clarification pond is 375 m3/day, and the flow of the Levikha River is 1125 m3/day. Evaporation from the clarification pond surface is estimated at 540 m3/day. At the Levikha River mouth (discharge into the Tagil River), the flow rate is 5534 m3/day. Depending on the water availability of the period, the distribution of balance components also changes, up to the complete cessation of discharge in low‑water years (for example, in 2021).
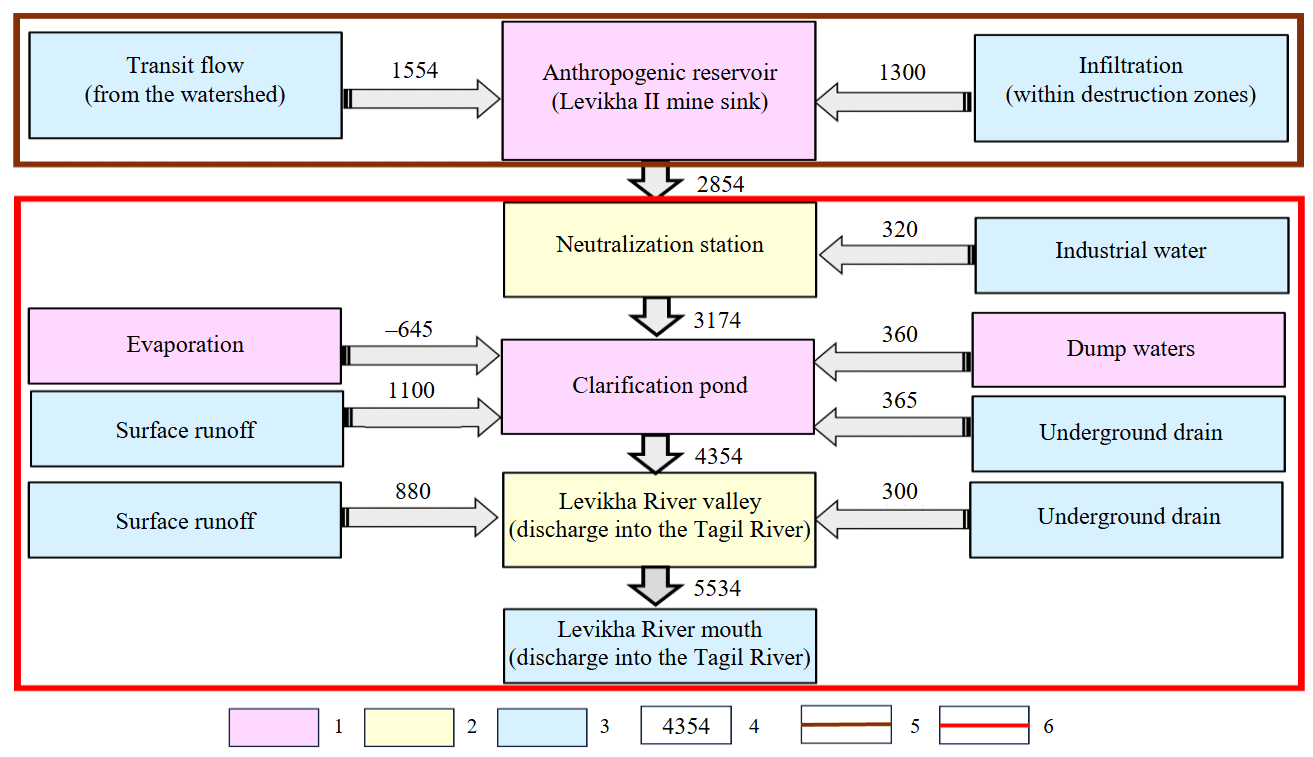
Fig.2. Water balance components of water bodies in the Levikhinsky mine area, long‑term average values
1 – acidic environment; 2 – alkaline environment; 3 – neutral environment; 4 – flow rate, m3/day; 5 – catchment area of the Kuzka and Osinovka rivers; 6 – catchment area of the Levikha River
Methods
Samples of surface waters and bottom sediments were collected at five monitoring points. The main monitoring points (MP) are the anthropogenic reservoir (AMD discharge zone) (MP 1), the anthropogenic stream after neutralization (MP 2), the clarification pond (MP 3), the Levikha River valley downstream of the discharge from the clarification pond (MP 4), and the Levikha River mouth before discharge into the Tagil River (MP 5) (Fig.3). The anthropogenic reservoir (MP 1) is the highest monitoring point. Here, acidic (pH = 2.3-3.9), mineralized (to 12 g/l) sulphate‑type mine drainage (to 9 g/l) with high concentrations of Fe, Al, Mg, Zn, Cu, and Mn is discharged. From the anthropogenic reservoir, mine drainage is pumped through a water conduit about 2 km long to the neutralization station (MP 2). After neutralization, the anthropogenic stream flows by gravity into the clarification pond (MP 3). In the Levikha River valley, downstream of the discharge from the clarification pond, bottom sediments and water samples were also collected (MP 4). The final sample was taken at the Levikha River mouth (MP 5), before discharge into the Tagil River. These monitoring points allow a full characterization of changes in the chemical composition of water and bottom sediments along the entire chain – from the discharge of acid mine drainage to its release into the hydrographic network.
To study the chemical composition of bottom sediments, samples were collected at the same monitoring points. Sampling was carried out from a boat using a Robur‑IL sampler. In the anthropogenic reservoir, the sample was collected from a depth of 5 m; in the clarification pond – from 4 m. At the other points, sampling was performed from the surface layer (20-30 cm). The sampling point layout is shown in Fig.3.
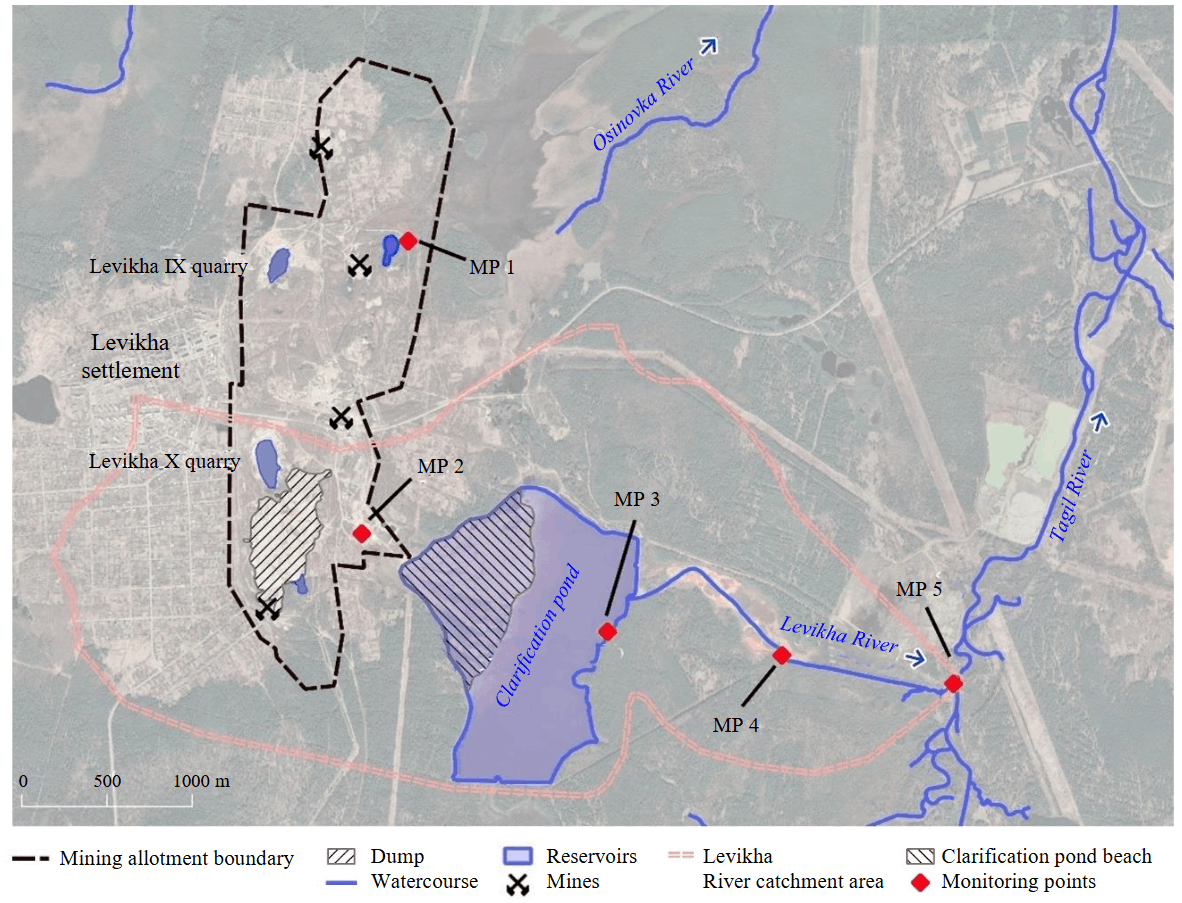
Fig.3. General layout of facilities at the Levikhinsky mine
To characterize the composition of mine drainage in the Levikhinsky copper‑pyrite mine area, monitoring data from the early 1950s to the present are used. Since 2007, monitoring is carried out by the organization responsible for mine water neutralization. The most typical pollution indicators for acid mine drainage are determined regularly (once a week): pH, Cu, Zn, Fetot, Mn, SO4, Cl, dry residue, suspended solids, and petroleum products. Potentiometric, photometric, and gravimetric methods are used for their analysis, respectively.
Comprehensive hydrochemical surveys were conducted once every 3-5 years, including seasonal sampling in 2020-2021. Samples were collected in accordance with GOST 31861-2012, and water was filtered directly in the field using modern filters. Samples of neutral composition for cation analysis were acidified to pH < 2 with ultrapure nitric acid (HNO3). All samples were transported by road in a container with coolants at 4 °C in 1.5 l bottles, which ensured a sufficient volume for determining the complete and balanced chemical composition of the water.
The analyses were performed at the Analytical Certification Testing Centre of the Institute of Microelectronics Technology and High-Purity Materials, RAS (Chernogolovka). The bulk composition of major elements (Na, Mg, Al, P, S, K, Ca, Ti, Mn, Fe) and trace elements (Li, Be, B, Sc, V, Cr, Co, Ni, Cu, Zn, Ga, As, Se, Rb, Sr, Y, Mo, Rh, Pd, Ag, Cd, Sn, Sb, Te, Cs, Ba, La, Ce, Pr, Nd, Sm, Eu, Gd, Tb, Dy, Ho, Er, Tm, Yb, Lu, Hf, Ta, W, Re, Ir, Pt, Au, Hg, Tl, Pb, Bi, Th, U) were determined using inductively coupled plasma atomic emission spectrometry (iCAP-6500, Thermo Scientific, USA) and inductively coupled plasma mass spectrometry (X-7, Thermo Elemental, USA). In situ measurements included temperature t (°C), Eh (mV), pH, and TDS (ppt), carried out using portable measuring instruments: HI 98121 pocket waterproof pH/ORP/temperature metre, HI 98312 DIST 6, I-510 ionometric ion analyser.
Additionally, water analyses were conducted at a certified laboratory in the Chemical Analytical Centre of the Institute of Industrial Ecology, Ural Branch of the RAS (Yekaterinburg), using prepared calibration solutions and the following methods: flame emission spectrometry (for determination of Na, K), flame atomic absorption spectrometry (for Ca, Mg), atomic absorption spectrometry (for Fe), inductively coupled plasma mass spectrometry (for Al, Be, Cd, Co, Mn, Cu, As, Ni, Pb, Se, Zn), method for determining nitrogen-containing substances (NO2), potentiometric method with ion-selective electrode (for NO3), gravimetric method (for SO4), argentometric method (for Cl), photometric method using yellow silica‑molybdenum heteropoly acid (for Si), method for determining alkalinity and mass concentration of carbonates and bicarbonates.
To analyse the geochemical spectrum of elements in water, concentration clarks (CC) were estimated. These are defined as the ratio of the substance concentration in water to its regional background level (the upper reaches of the Levikha River). For bottom sediments, element clarks in the Earth’s crust according to A.P.Vinogradov were used.
To assess the chemical activity of bottom sediments, the bottom accumulation coefficient, or concentration ratio (CR), is an informative parameter. According to [23, 24], it is the ratio of element concentrations in bottom sediments Xs to the concentrations of the same elements in water Xw:
The study analysed the chemical elements Al, As, Be, Ca, Cd, Co, Cu, Fe, Mg, Mn, Ni, Pb, S, and Zn, which exceeded the concentration ratio by a factor of 103 in at least one monitoring point. Chemical elements with values below 103 were not considered in the study.
The determination of component migration forms and saturation index SI was carried out using the Visual MINTEQ 3.1 software for equilibrium physicochemical modelling of geochemical processes in the water – rock system. The input data consisted of the results of chemical analyses of mine drainage obtained during environmental monitoring (Table 1). Critically important parameters directly affecting equilibrium estimations – pH, redox potential Eh, and temperature t – were set according to the values measured in situ (at the sample collection site).
Table 1
Results of chemical analysis of water samples
|
Parameters |
Anthropogenic reservoir (MP 1) |
Anthropogenic stream after neutralization (MP 2) |
Clarification pond (MP 3) |
Levikha River after discharge from the clarification pond (MP 4) |
Levikha River mouth (MP 5) |
|
pН |
(2.3-3.9) 3.6 |
8.2; 12.3**
|
(3.1-4.4) 3.6 |
6.1; 10.3***
|
(5.4-7.4) 6.9 |
|
t, °C |
(12.7-18.4) 14.0 |
13.0; 16.7
|
(2.7-20.7) 7.8 |
8.0; 8.9
|
(6.8-26.7) 19.1 |
|
Eh, mV |
(185.2-500) 232.6 |
–287; –280
|
(120.2-571) 498 |
50.0; 52.2
|
(35-313) 54.3 |
|
ΣM, g/l |
(5.7-11.9) 10.1 |
2.5; 2.7
|
(1.5-4.8) 3.8 |
2.2; 2.0
|
(2.2-3.6) 3.0 |
|
Al, mg/l |
(281-494) 436 |
1.3
|
(6.2-120) 68.9 |
0.03; 0.02
|
(0.02-0.5) 0.04 |
|
Ca, mg/l |
(263-427) 401 |
689; 645
|
(272-641) 405 |
469; 561
|
(441-701) 585 |
|
Cu, mg/l |
(11.6-16.3) 13.9 |
0.014
|
(0.3-4.7) 2.9 |
0.01; 0.002
|
(0.02-0.07 0.02 |
|
Fetot, mg/l |
(220-1290) 1099 |
0.2; 4
|
(2.6-30) 7.1 |
0.4; 0.05
|
(0.2-2.7) 0.4 |
|
K, mg/l |
(4-8) 5.3 |
7.8; 6.3
|
(2.6-7.6) 5.6 |
2.4; 2.1
|
(2.8-6.3) 4.1 |
|
Mg, mg/l |
(290-533) 428 |
24.3; 2.4
|
(58-319) 275 |
120; 39
|
(137-263) 186 |
|
Mn, mg/l |
(53.1-79.5) 58.3 |
0.3
|
(6.7-38.3) 26.8 |
13; 0.008
|
(5.3-10.4) 9.5 |
|
Na, mg/l |
(18.5-34.7) 21.3 |
28.1; 25.4
|
(4.4-22.7) 16.7 |
8.4; 11.8
|
(6-20) 14.0 |
|
NH4, mg/l |
(1.3-9.1) 6.2 |
4.9; 2.7
|
(0.5-8.2) 3.6 |
5.2; 0.2
|
(0.2-5.8) 0.9 |
|
Zn, mg/l |
(107-130) 120.0 |
0.06
|
(9.8-73.7) 46.7 |
8.4; 0.007
|
(0.3-16.1) 5.9 |
|
SO4, mg/l |
(4299-8950) 7308 |
1714; 1368 |
(1037-3506) 2758 |
1587; 1310
|
(1547-2543) 2176 |
|
Cl, mg/l |
(21.8-44) 30.8 |
33.3; 43.4 |
(14.5-106.6) 28.6 |
14.5; 17.4
|
(12.7-18.1) 16.1 |
|
HCO3, mg/l |
< DL |
27.5; 79.3 |
< DL |
12.2; 6.1 |
(18.3-36.6) 33.6 |
|
NO2, mg/l |
(0.003-0.05) 0.003 |
0.014; 0.02 |
(0.003-0.02) 0.003 |
0.01; 0.02
|
(0.0003-0.02) 0.01 |
|
NO3, mg/l |
(0.6-5.5) 3.5 |
1; 1.1
|
(0.7-5.5) 1.0 |
0.6; 0.9
|
(0.6-1.3) 0.7 |
|
Water type * |
|
|
|
|
|
|
Number of tests |
5 |
2 |
5 |
2 |
5 |
Note. ∑M – mineralization; numbers in brackets – value limits, numbers outside brackets – median values; < DL – below detection limit; * – component content greater than 10 mg-eq %, given in descending order; ** – data for August and October; *** – data for April and June 2021.
The saturation index is the decimal logarithm of the ratio of the ion activity product (IAP) to the solubility constant Ksp of a compound or mineral at a given temperature [25, 26]:
This parameter characterizes the undersaturation or supersaturation of a solution with respect to a solid phase, i.e. it indicates the potential possibility of mineral dissolution (when SI < 0) or precipitation (when SI > 0). A zero value of the saturation index means that the solution is in equilibrium with the mineral.
Discussion
Hydrochemical characteristics of monitoring points
Anthropogenic reservoir (MP 1). In the anthropogenic reservoir (Fig.4) at the Levikhinsky mine site, a sharp increase in the concentrations of Zn, Cu, Fe, Mn and several other components is observed since mid-2007, after acid mine drainage emerged at the surface (Fig.5). This process is a key stage in the evolution of the water – rock system and is caused by a radical change in the direction of groundwater flow and geochemical processes. For decades during mining operations, oxygen-enriched flows were directed from the surface downwards (to depths of 600 m) due to mine dewatering. Their geochemical role was the oxidative dissolution of sulphide‑bearing rocks and the formation of secondary minerals – accompanied by significant changes in porosity and permeability of rocks in mining zones due to the use of a mining system with roof caving in the worked‑out area. The filling of the depression cone reversed the flow direction and led to the formation of a focused discharge zone for mine drainage in the collapse area. Due to their high solubility, secondary minerals enrich the water reaching the surface with elements whose concentrations are several times higher than those observed during mine operation. This phenomenon is known as the first flush and is documented at many abandoned mines; its duration can span decades to hundreds of years [16, 27-29].
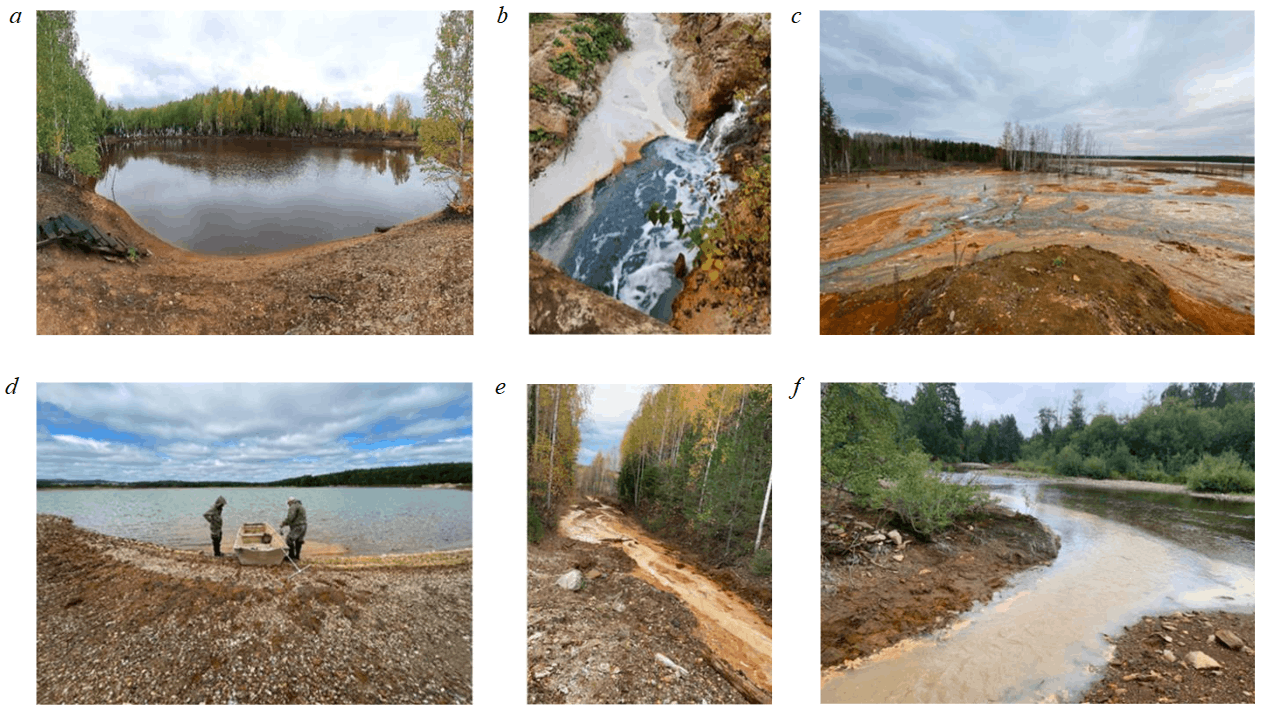
Fig.4. Sampling points at the Levikhinsky mine: a – anthropogenic reservoir in the collapse zone (acid mine drainage discharge, MP 1); b – anthropogenic stream after neutralization (mixing of AMD and lime milk, MP 2); c – area flooded with neutralized mine drainage; d – clarification pond (MP 3), preparation for sampling; e – Levikha River after discharge from the clarification pond (MP 4); f – Levikha River mouth (MP 5)
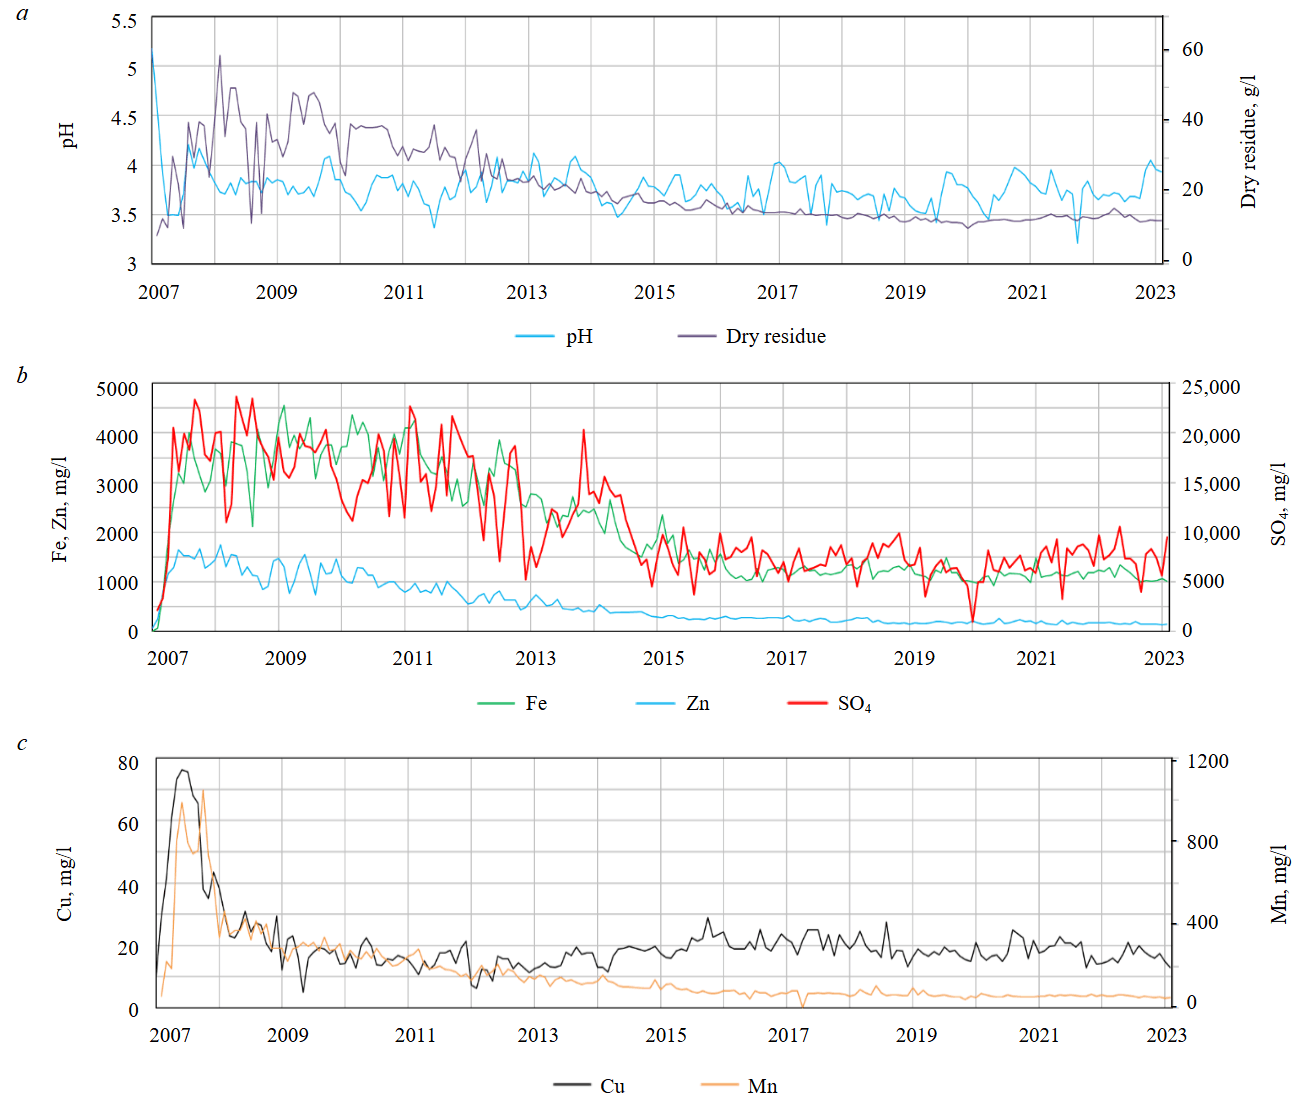
Fig.5. Chemical composition of mine water in the discharge zone for 2007-2023: a – pH and dry residue; b – Fe, Zn, and SO4; c – Cu, Mn
For most components, a long gradual decrease in values is observed after a sharp rise. Thus, the maximum SO4 values (23,700 mg/l) were recorded in August 2008; after 7 years, they decreased to 6650 mg/l, and the minimum value of 944 mg/l was recorded in April 2020 (the average value during mining was 5970 mg/l). The maximum Fe values (2113-4560 mg/l) were recorded in 2007-2011; by 2020, the values noticeably decreased, but the fluctuation range remained quite large – 924-1221 mg/l (during mining, Fe concentration was ~730 mg/l). For Zn, a decreasing trend is also observed, from 1753 to 222 mg/l (during mining 317 mg/l) (Fig.5, b).
Cu concentrations during mining were 154 mg/l; in 2007, the maximum was 75 mg/l. Mn concentrations rose to 1074 mg/l in the first year after flooding (during mining 47 mg/l). Then, from April 2008, there was a fairly sharp decrease in Cu and Mn to 13 and 50 mg/l, respectively (Fig.5, c). Despite this decreasing trend in the content of all components in mine drainage discharging into the anthropogenic reservoir, their concentrations are still higher than during active dewatering while the mine was in operation [17].
Currently, the mine drainage is acidic (pH = 2.3-3.9), predominantly sulphate calcium-magnesium‑aluminium or sulphate magnesium‑iron‑aluminium in composition, with a mineralization of 5.7-11 g/l. The temperature of groundwater is 13-18.4 °C, Eh = 185-500 mV (Table 1).
Anthropogenic stream after neutralization (MP 2).To reduce the environmental load on the hydrosphere and prevent the inflow of untreated acidic waters into watercourses, a treatment system for AMD was developed at the mine in the 1960s, using 10 % lime milk as a reagent.
The lime milk for interaction with acidic waters is supplied by gravity flow through a pipeline (see Fig.4, b).
The composition of the water after neutralization is sulphate magnesium‑calcium. The pH value ranges from 8.2 to 12.3, which is a consequence of the treatment process. Mineralization is 2.5-2.7 g/l; water temperature after neutralization is 13-16.7 °C; Eh = –287 to –280 mV, indicating the formation of reducing conditions where metals of low valence states are present (Table 1).
Clarification pond (MP 3).In 1959, a clarification pond was created in the Levikha River valley (see Fig.4, d) on a hillside on the left bank of the Tagil River. Its area is 142 ha, total volume is 3.2 million m3, average depth is 2.4 m, and maximum depth is 5 m. Currently, the volume of accumulated sludge is approximately 2,840,000 m3.
Over the years of operation, the clarification pond was filled with sludge from the neutralization of AMD, and approximately one‑third of its surface is a beach with dried sludge, about 500 m wide. In the area of the beach and the neutralization station, complete suppression of vegetation is observed (see Fig.4, c). The efficiency of water treatment decreased, primarily because the remaining volume in the clarification pond is insufficient for settling the water after neutralization [17].
The composition of the water in the clarification pond is sulphate; Mg, Ca, and Al cations are present in varying amounts. The composition of water sampled from ice in winter is the same.
Chemical analyses of samples show an acidic environment (pH = 3.1-4.4). Mineralization varies from 1.5 to 5 g/l. Water temperature is 7.8-25.7 °C; Eh = 218-571 mV, indicating highly oxidizing conditions (Table 1).
Levikha River after discharge from the clarification pond (MP 4). When mine drainage is discharged from the clarification pond into the channel, it is re‑neutralized with lime milk, causing its pH to increase to 8.9 (see Fig.4, e).
The water composition here is sulphate. Among the cations, Ca and Mg predominate. Mineralization is 2.1 g/l. Water temperature is 8.0-8.9 °C; Eh = 50-52 mV, indicating transitional redox conditions with an unstable geochemical regime.
Levikha River mouth (MP 5).The water composition at the Levikha River mouth is sulphate. Among the cations, Ca and Mg are predominant. The water has a neutral or slightly acidic reaction (pH = 5.4-7.4). Mineralization is 2.2-3.6 g/l. Water temperature is 5-21 °C; Eh = 45-313 mV (Table 1).
Concentration clarks in water and bottom sediments
Significant exceedances of element clarks in water were detected in water samples from the discharge zone and after neutralization, with the most substantial exceedances (thousands of times) for Cd, Co, Cu, Zn, Pb, Fe, Al (Fig.6, a) [30]. In the clarification pond, CC values decrease by one to two orders of magnitude. In the Levikha River water after discharge from the pond, clark exceedances (hundreds of times) were found for Co, Zn, and Cd. At the Levikha River mouth, a notable exceedance of concentration clarks was observed for Al, Cu, and Ni.
In bottom sediment samples from the discharge zone, unlike water samples, only minor exceedances of element clarks (units and tens of times) were detected for Zn, Cd, Cu (Fig.6, b). In the anthropogenic stream after neutralization, clark exceedances increase (tens of times) for Cd, Cu, and Zn. In the clarification pond, significant exceedances were recorded, with the most substantial ones (hundreds of times) for Cd, Cu, Zn. In the Levikha River after discharge from the pond and at its mouth, identical exceedances are observed for Zn, Cd, Cu.
The main elements exceeding concentration clarks both in water samples and in bottom sediments are Cu, Zn, and Cd. However, the first graph showing concentration clarks in water displays exceedances at all monitoring points for 8 elements, whereas this trend is not observed in the second graph for bottom sediments (Fig.6).
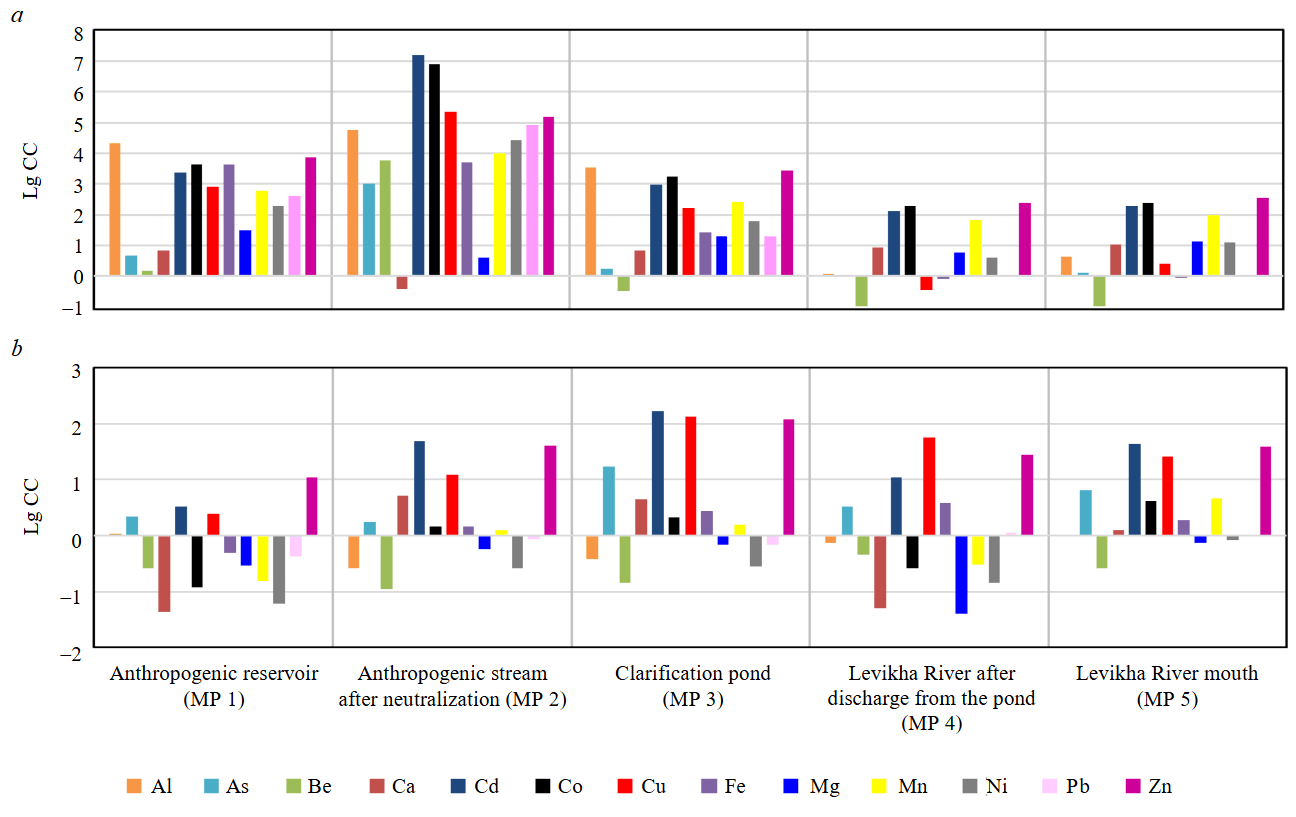
Fig.6. Geochemical spectrum of elements at monitoring points: a – in water; b – in bottom sediments
Degree of heavy metal accumulation in bottom sediments
To assess the degree of heavy metal accumulation in bottom sediments, concentration ratios (CR) were estimated. The higher the CR value, the more intensive the process of metal migration from water to bottom sediments through precipitation, sorption or chemisorption by bottom sediments [31, 32].
The reverse process occurs in acidic environments, when desorption of metals in bottom sediments is activated [33-35]. For instance, in the anthropogenic reservoir (pH = 3.6), the concentration ratio has minimal values for almost all elements. When pH increases after neutralization, accumulation of several metals in bottom sediments occurs; the most illustrative examples are Zn (CR > 6·104 l/kg) and Cu (CR > 4.1·104 l/kg). Compared to the anthropogenic reservoir, CR values are high in the acidic environment of the clarification pond (pH = 3.6), for example for Fe (CR > 1.8·104 l/kg). This process may be associated with the neutralization reaction of AMD and, as a consequence, precipitation of elements. The most intensive processes of metal precipitation and sorption by bottom sediments are characteristic of two sites with neutral environments: the Levikha River after discharge from the pond (MP 4) and the Levikha River mouth (MP 5). Here, CR values are over 1.7·105 l/kg for Al, Fe, Cu, Pb; to 7.2·103 l/kg for As (Table 2).
Forms of element migration and results of saturation index estimations
According to thermodynamic estimations, monovalent cations Na and K migrate almost entirely in the form of free ions. Divalent cations Ca, Mg, Cu, and Zn migrate predominantly in ionic form (over 60 %) (Table 3).
Al in acidic environments (in the anthropogenic reservoir and the clarification pond) migrates mainly in sulphate form AlSO4+ (i67 %). At the neutralization station, in a highly alkaline environment, Al is present only as Al(OH)4-. In the Levikha River after discharge from the clarification pond, in a slightly acidic environment, Al was not detected. In a neutral environment at the Levikha River mouth, Al is present in sulphate complexes (Table 3).
Table 2
Concentration ratio in the water-bottom sediment system, l/kg
|
Element |
Anthropogenic reservoir |
Anthropogenic stream after neutralization |
Clarification pond |
Levikha River after discharge from the pond |
Levikha River mouth |
|
Al |
203 |
15,802 |
441 |
2,976,349 |
2,048,902 |
|
As |
826 |
1211 |
16,469 |
5708 |
7279 |
|
Be |
133 |
n.d.* |
345 |
3434 |
1973 |
|
Ca |
4 |
258 |
361 |
3 |
71 |
|
Cd |
2 |
n.d. |
240 |
112 |
299 |
|
Co |
2 |
n.d. |
95 |
119 |
73,844 |
|
Cu |
8 |
41,653 |
2197 |
448,346 |
61,628 |
|
Fe |
21 |
32,843 |
18,221 |
798,735 |
223,107 |
|
Mg |
13 |
805 |
46 |
9 |
74 |
|
Mn |
3 |
4561 |
58 |
47 |
674 |
|
Ni |
8 |
n.d. |
115 |
927 |
1627 |
|
Pb |
165 |
n.d. |
5506 |
177,750 |
159,384 |
|
S |
1 |
237 |
118 |
57 |
8 |
|
Zn |
8 |
60,814 |
217 |
562 |
1225 |
* n.d. – not determined.
Table 3
Forms of element migration at monitoring points
|
Monitoring points |
Water composition indicators |
Forms of migration |
|
|
Major |
Secondary |
||
|
Anthropogenic reservoir (MP 1) |
pH = 3.6 Eh = 232.6 mV ΣM = 10.1 g/l формула
|
Fe2+, FeSO4, AlSO4, Ca2+, Cu2+, K+, Mg2+, Na+, Mn2+, Zn2+ |
Fe3+, Fe(SO4), Al3+, Al(SO4)2–, CaSO4(aq), CuSO4(aq), MgSO4(aq), MnSO4(aq), ZnSO4(aq) |
|
Anthropogenic stream after neutralization (MP 2) |
pH = 10.3 Eh = –280 mV ΣM = 2.6 g/l формула
|
Fe2+, Fe(OH)4, Al(OH)4, Ca2+, K+, Mg2+, Na+, Mn2+, Zn(OH)2(aq)
|
FeSO4, CaSO4(aq), CuOH+, Cu(OH)2, MgSO4(aq), MnSO4+ |
|
Clarification pond (MP 3) |
pH = 3.6 Eh = 498 mV ΣM = 3.8 g/l формула
|
Fe2+, FeSO4+, AlSO4, Ca2+, Cu2+, K+, Mg2+, Na+, Mn2+, Zn2+ |
FeSO4(aq), CaSO4(aq), CuHSO4+, MgSO4(aq), MnSO4(aq), ZnSO4(aq) |
|
Levikha River after discharge from the pond (MP 4) |
pH = 8.2 Eh = 51 mV ΣM = 2.1 g/l формула
|
Fe2+, Fe(OH)2+, Ca2+, Cu2+, K+, Mg2+, Na+, Mn2+, Zn2+ |
FeSO4, Al(SO4)2,CaSO4(aq), CuSO4(aq), MgSO4(aq), MnSO4(aq), ZnSO4(aq) |
|
Levikha River mouth (MP 5) |
pH = 6.9 Eh = 54 mV ΣM = 3.0 g/l формула
|
Fe2+, Fe(OH)2+, AlSO4+, Ca2+, Cu2+, K+, Mg2+, Na+, Mn2+, Zn2+ |
FeSO4, CaSO4(aq), CuSO4(aq), MgSO4(aq), MnSO4(aq), ZnSO4(aq) |
Note.Major – more than 50 %; secondary – from 25 to 49 % of the gross content.
Depending on the water’s redox potential, Fe has an oxidation state of 2+ or 3+ [11, 14]. Fe (II) is predominantly in free form (54-67 %) and in sulphate complexes FeSO4+ (to 43 %). Fe (III) forms complex compounds, especially with hydroxide ( Fe(OH)2+, FeSO4-) and sulphate (FeSO4+) groups. Acidic waters in the anthropogenic reservoir and the clarification pond have an identical composition – sulphate complexes predominate. In neutral waters, at discharge from the clarification pond and at the Levikha River mouth, the hydroxide complex FeSO4- predominates. In alkaline conditions after neutralization, the hydroxide complex FeSO4- also predominates (Table 3).
Analysis of component migration at the monitoring points reveals the following features. Elements such as Ca, Mg, Na, K, and Mn migrate in free form in all waters, from acidic to alkaline environments (on average 70 % across all monitoring points). Cu and Zn migrate in free form in acidic and weakly alkaline environments; in strongly alkaline conditions, they occur only as hydroxide complexes. The main migration form of Al when acidic waters mix with neutral ones is the complex form [11, 14, 36]. Specifically, Al migrates predominantly in sulphate form; in strongly alkaline environments, Al is almost entirely in the form of hydroxides.
Waters at all monitoring points are undersaturated or close to equilibrium with respect to gypsum, hydroxide minerals (gibbsite, Al(OH)3), and oxide minerals (copper ferrite, hematite). Positive but near‑equilibrium saturation index values with respect to Al(OH)3 and ferrihydrite appear at the Levikha River mouth (Table 4).
Table 4
SI of waters by mineral groups
|
Monitoring points |
Chemical composition indicators |
Mineral groups |
Groups by saturation indices |
|
|
I (SI > 0) |
II (0 > SI > –3) |
|||
|
Anthropogenic reservoir (MP 1) |
pH = 3.6 Eh = 232.6 mV ΣM = 10.1 g/l формула
|
Hydroxides |
– |
– |
|
Sulphates |
– |
Gypsum, alunite, K-jarosite |
||
|
Oxide-hydroxides |
Goethite, lepidocrocite |
Ferrihydrite, diaspore |
||
|
Oxides |
Magnetite, hematite |
Copper ferrite |
||
|
Anthropogenic stream after neutralisation (MP 2) |
pH = 10.3 Eh = –280 mV ΣM = 2.6 g/l формула
|
Hydroxides |
Gibbsite, Al(OH)3, Cu(OH)2(s) |
– |
|
Sulphates |
Brochantite, gypsum |
K-jarosite, Al4(OH)10SO4 |
||
|
Oxide-hydroxides |
Fe3(OH)8, goethite, lepidocrocite, ferrihydrite, diaspore, boehmite |
– |
||
|
Oxides |
Maghemite, copper ferrite, magnesioferrite, magnetite, hercynite, hematite, tenorite |
– |
||
|
Clarification pond (MP 3) |
pH = 3.6 Eh = 498 mV ΣM = 3.8 g/l формула
|
Hydroxides |
– |
Gibbsite |
|
Sulphates |
K-jarosite, gypsum |
Alunite |
||
|
Oxide-hydroxides |
Ferrihydrite, goethite, lepidocrocite |
Diaspore |
||
|
Oxides |
Hematite, magnetite, copper ferrite, maghemite |
– |
||
|
Levikha River after discharge from the pond (MP 4) |
pH = 8.2 Eh = 51 mV ΣM = 2.1 g/l формула
|
Hydroxides |
Al(OH)3, gibbsite |
– |
|
Sulphates |
Al4(OH)10SO4, alunite |
Gypsum |
||
|
Oxide-hydroxides |
Boehmite, diaspore |
Goethite, lepidocrocite |
||
|
Oxides |
Hercynite, magnetite |
Hematite |
||
|
Levikha River mouth (MP 5) |
pH = 6.9 Eh = 54 mV ΣM = 3.0 g/l формула
|
Hydroxides |
Gibbsite |
Al(OH)3 |
|
Sulphates |
Alunite |
Al4(OH)10SO4 |
||
|
Oxide-hydroxides |
Diaspore |
Boehmite, goethite, lepidocrocite |
||
|
Oxides |
– |
Hematite, hercynite, magnetite |
||
Acidic waters in the anthropogenic reservoir (MP 1) and in the clarification pond (MP 3) are supersaturated primarily with hematite and magnetite. In neutral environments (MP 4, 5) at the pond discharge and at the Levikha River mouth, alunite and diaspore precipitate, which are among the main minerals precipitating in laboratory solutions [33, 37]. In MP 2 in the anthropogenic stream after neutralization, supersaturations are observed with respect to magnetite, copper ferrite, and magnesioferrite (Table 4, Fig.7).
An assessment of the mineral equilibrium of surface- and groundwater at the Levikhinsky mine revealed the limited effectiveness of the existing treatment system, which relies primarily on simple neutralization with lime and sedimentation in the clarification pond. Assessing the degree of accumulation of heavy metals in bottom sediments, modelling and analysis of the forms of migration of chemical elements revealed the following key problems requiring a different approach:
- The existing neutralization process (using lime milk) effectively precipitates only a portion of metals (Fe, Al, partially Cu, Zn) in the form of hydroxides. However, significant concentrations of highly toxic elements (As) and migration-capable elements (Zn, Mn) remain in solution as stable complexes (see Table 2, 4, Fig.6, 7).
- Amorphous sediments formed in clarification ponds (predominantly containing Fe, Ca, Al) exhibit low stability. When pH/Eh conditions change, desorption and release of previously bound metals occur (especially Mn, Zn), which is confirmed by saturation estimations and data on the solubility of secondary phases (see Table 2-4, Fig.7).
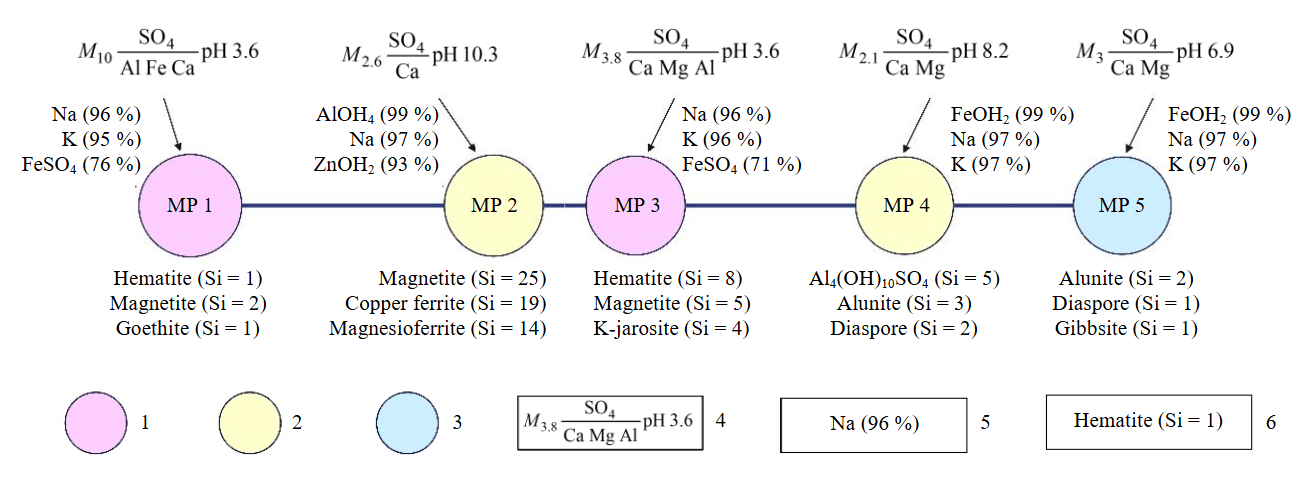
Fig.7. Hydrogeochemical properties of monitoring points
1 – acidic environment; 2 – alkaline environment; 3 – neutral environment; 4 – chemical composition of water; 5 – migration of chemical element; 6 – mineral (saturation index)
Thus, the combined process of neutralization, precipitation, and dilution does not ensure the treatment of mine drainage to regulatory standards.
To improve the state of the hydrosphere at the mine, it is necessary to reorganize the treatment system by introducing the following process stages:
- Advanced neutralization and precipitation. To effectively oxidize, coagulate, and precipitate Fe, Mn, and Cu forming more stable sediments and prevent Zn activity, precise pH regulation and the use of an adequate amount of lime (based on water flow rate and pollutant concentrations) are required. The introduction of treatment facilities with aeration tanks and controlled lime milk supply will increase the mixing rate and extend the interaction time between acidic waters and the reagent promoting the formation of more stable and selective sediments.
- Advanced treatment and flocculation. To further treat mine drainage and bring the pH to regulatory levels, it is necessary to use radial settling tanks with an integrated flocculation chamber. Applying specific flocculants (e.g., anionic polymers) in the flocculation chamber will improve the precipitation of fine particles and coagulated metal complexes.
- Final metal stabilization. Cascades of clarification ponds will ensure the final stabilization of metals in immobile forms (sulphides, sorbed phases). These facilities will create stable geochemical barriers, minimize the risk of secondary pollution, and enable safe sludge disposal.
Reconstructing the existing mine water treatment system using three process stages – advanced neutralization in aeration tanks, radial settling tanks with flocculation, and a cascade of clarification ponds – will contribute to reducing the contamination of surface- and groundwater.
Conclusion
At present, acidic, highly mineralized sulphate waters with high metal content are discharging to the surface at the Levikhinsky copper‑pyrite mine. After neutralization and settling in the clarification pond, the treated wastewater enters the river network.
Significant exceedances of element clarks are detected in water samples from the collapse zone and after neutralization, with the most substantial exceedances (thousands of times) for Cd, Co, Cu, Zn, Pb, Fe, and Al. In the clarification pond, clark concentration values decrease by one to two orders of magnitude. In the Levikha River after discharge from the pond, element clark exceedances (hundreds of times) were detected for Co, Zn, and Cd. At the Levikha River mouth, a notable increase in concentration clarks was observed for Al, Cu, and Ni.
In acidic environments, metal desorption from bottom sediments is activated. For instance, in the anthropogenic reservoir, the concentration ratio has minimal values for almost all elements. When pH values increase after neutralization, accumulation of several metals in bottom sediments occurs, with the most significant indicators recorded for Zn and Mn. Intensive precipitation and sorption of Al, Fe, Cu, and Pb in bottom sediments take place in neutral environments – in the Levikha River (after discharge from the pond and at the Levikha River mouth).
Migration of the main macro‑ and trace components occurs mainly in the form of free ions.
In the anthropogenic reservoir and the clarification pond (acidic environment), the water is supersaturated with respect to minerals of the oxide and oxide‑hydroxide groups. After neutralization (highly alkaline water) and in the Levikha River after discharge from the pond (slightly acidic environment), the water is most supersaturated: dominant SI values are observed in the groups of oxides, oxide‑hydroxides, hydroxides, and sulphates. At the Levikha River mouth, slight supersaturation is noted with respect to the groups of hydroxides, sulphates, and oxide‑hydroxides.
The overall result of the processes occurring from the release of acid mine drainage to discharge into the hydrographic network is a significant decrease in the concentrations of chemical elements. The main factors controlling this decrease are neutralization and dilution by surface- and groundwater, which leads to an increase in pH and a decrease in pollutant concentrations. However, at the discharge point into the hydrographic network, pollutant concentrations do not reach the regulatory standards (MPC) for fishery purposes: maximum exceedances for zinc is 590 times, manganese – 950 times; minimum exceedances for calcium is 3 times, iron – 4 times.
The transfer of metals (Cu, partially Zn) from dissolved forms to bottom sediments reduces their concentration in the aquatic environment and acute toxicity for organisms. However, this simultaneously leads to the formation of high concentrations of toxic elements in bottom sediments. Thus, the immediate threat to the hydrosphere decreases, but the danger for organisms inhabiting water bodies increases, and the risk of secondary pollution arises when physicochemical conditions change (floods, decrease in Eh/pH).
The performed assessment of the equilibrium degree of anthropogenically impacted waters with respect to minerals allowed to identify processes of secondary mineral formation, forms of metal migration in water bodies, and their impact on the environment.
To effectively treat acid mine drainage at the mine, it is necessary to reorganize the treatment system. The optimal solution is to implement a more controllable neutralization stage using systems with aeration tanks and radial settling tanks, as well as a passive treatment stage in the form of a cascade of ponds. Implementing these measures will reduce pollutant concentrations in treated water to regulatory standards, control the discharge rate, stimulate precipitation, transform metals into less mobile forms, and create stable natural-engineered systems. This will lead to a significant improvement in the environmental situation both at the Levikhinsky mine site and in adjacent water bodies.
References
- Espinoza Tumialán P., Tantavilca Martinez N., Barreto Hinostroza C., Arana Ruedas D.P.R. Acid mine water treatment using neutralizer with adsorbent material. Journal of Mining Institute. 2024. Vol. 267, p. 381-387.
- Fetisova N.N., Fetisov V.V. Choosing purification systems for drainage water from abandoned mines in the Kizel Coal Field. Mining Informational and Analytical Bulletin. 2024 N 1, p. 109-124 (in Russian). DOI: 10.25018/0236_1493_2024_1_0_109
- Pashkevich M.A., Alekseenko A.V., Nureev R.R. Environmental damage from the storage of sulfide ore tailings. Journal of Mining Institute. 2023. Vol. 260, p. 155-167. DOI: 10.31897/PMI.2023.32
- Nordstrom D.K., Blowes D.W., Ptacek C.J. Hydrogeochemistry and microbiology of mine drainage: An update. Applied Geochemistry. 2015. Vol. 57, p. 3-16. DOI: 10.1016/j.apgeochem.2015.02.008
- Rybnikova L.S., Rybnikov P.A., Navolokina V.Yu. Reducing Negative Impacts of Dormant Pyrite Copper Ore Mine on the Geosphere in the Urals. Journal of Mining Science. 2022. Vol. 58. N 3, p. 519-525. DOI: 10.1134/S1062739122030188
- Menshikova E., Osovetsky B., Blinov S. et al. Ochre Particles in River Sediments in Coal Mining Areas (A Study of the Kizel Coal Basin, Russia). Mine Water and the Environment. 2022. Vol. 41. Iss. 4, p. 1040-1054. DOI: 10.1007/s10230-022-00905-3
- Maksimovich N.G., Khmurchik V.Т., Berezina О.А., Demenev A.D. Migration of microelements in river system in impact zone of acid mine water discharge in the Kizel Coal Basin. Mining Informational and Analytical Bulletin. 2024. N 2, p. 23-34 (in Russian). DOI: 10.25018/0236_1493_2024_2_0_23
- Abramov S.M., Tejada J., Grimm L. et al. Role of biogenic Fe(III) minerals as a sink and carrier of heavy metals in the Rio Tinto, Spain. Science of the Total Environment. 2020. Vol. 718. N 137294. DOI: 10.1016/j.scitotenv.2020.137294
- Maksimovich N.G., Berezina O.A., Meshcheriakova O.Yu., Demenev A.D. Research of migration of technogenic bottom sediments with application of modern geoinformation systems. InterCarto. InterGIS. GI support of sustainable development of territories. 2020. Vol. 26. Part 2, p. 201-211 (in Russian). DOI: 10.35595/2414-9179-2020-2-26-201-211
- Guan Chen, Yicheng Ye, Nan Yao et al. A critical review of prevention, treatment, reuse, and resource recovery from acid mine drainage. Journal of Cleaner Production. 2021. Vol. 329. N 129666. DOI: 10.1016/j.jclepro.2021.129666
- Maksimovich N.G., Khmurchik V.Т., Berezina О.А. Forms of transfer of microelements in river network and their distribution in bottom sediments in coal mining regions. Mining Informational and Analytical Bulletin. 2022. N 11, p. 52-66 (in Russian). DOI: 10.25018/0236_1493_2022_11_0_52
- Kharko P.A., Nureev R.R., Pashkevich M.A. Possibility of using limestone-based geochemical barriers for purification of waste water from metals. The Eurasian Scientific Journal. 2020. Vol. 12. N 6, p. 9 (in Russian).
- Fetisova N.F. Study of migration forms of metals in rivers affected by acid mine drainage of the Kizel coal basin. Bulletin of the Tomsk Polytechnic University. Geo Аssets Engineering. 2021. Vol. 332. N 1, p. 141-152 (in Russian). DOI: 10.18799/24131830/2021/1/3007
- Hongbing Ji, Hongxia Li, Yan Zhang et al. Distribution and risk assessment of heavy metals in overlying water, porewater, and sediments of Yongding River in a coal mine brownfield. Journal of Soils and Sediments. 2018. Vol. 18. Iss. 2, p. 624-639. DOI: 10.1007/s11368-017-1833-y
- Rybnikova L.S., Rybnikov P.A., Galin A.N. Processes of formation of waste waters and measures to minimize their impact on the hydrosphere (on the example of the Levikhinsky mine, Middle Urals). Bulletin of the Tomsk Polytechnic University. Geo Assets Engineering. 2025. Vol. 336. N 2, p. 102-115. DOI: 10.18799/24131830/2025/2/4517
- Rybnikova L.S., Rybnikov P.A. Regularities in the Evolution of Groundwater Quality at Abandoned Copper Sulfide Mines at the Levikha Ore Field, Central Urals, Russia. Geochemistry International. 2019. Vol. 57. N 3, p. 298-313. DOI: 10.1134/S0016702919030091
- Rybnikova L.S., Rybnikov P.A., Navolokina V.Yu. Assessment of the efficiency of acid mine drainage purification (using the example of copper-pyrite mines in the Middle Urals). Journal of Mining Institute. 2024. Vol. 267, p. 388-401.
- Jacobs J.A., Testa S.M. The Iron Mountain Mine in Shasta County, California. Acid Mine Drainage, Rock Drainage, and Acid Sulfate Soils: Causes, Assessment, Prediction, Prevention, and Remediation. Wiley, 2014, p. 355-360. DOI: 10.1002/9781118749197.ch31
- Jacobs J.A., Testa S.M., Alpers C.N., Nordstrom D.K. An Overview of Environmental Impacts and Mine Reclamation Efforts at Iron Mountain, Shasta County, California. Applied Geology in California. Association of Environmental & Engineering Geologists, 2016, p. 427-446.
- Donald A.N., Sanders B.L., Halma M. The Search for Potential Remediation Strategies and Sustainable Alternatives for Safe use of US EPA Superfund Sites. Trends in Ecological and Indoor Environmental Engineering. 2025. Vol. 3. N 1, p. 11-24. DOI: 10.62622/TEIEE.025.3.1.11-24
- Vasileva A.A., Boduen A.Ya. Mineralogical features and processing of copper zinc-containing concentrates (Uchalinsky mining and processing plant). Bulletin of the Tomsk Polytechnic University. Geo Assets Engineering. 2023. Vol. 334. N 3, p. 61-72 (in Russian). DOI: 10.18799/24131830/2023/3/3956
- Rybnikova L.S., Rybnikov P.A., Shapochkin R.A. Rationale for alternative water sources for mining regions with high environmental footprint on the example of Levikha village of the Sverdlovsk region. Minerals and Mining Engineering. 2023. N 2, p. 74-86 (in Russian). DOI: 10.21440/0536-1028-2023-2-74-86
- Chukaeva М.А., Sapelko T.V. Assessment of the ecological state of aquatic ecosystems by studying lake bottom sediments. Journal of Mining Institute. 2025. Vol. 271, p. 53-62.
- Gijung Pak, Minjae Jung, Hwansuk Kim et al. Assessment of Metals Loading in an Acid Mine Drainage Watershed. Mine Water and the Environment. 2016. Vol. 35. Iss. 1, p. 44-54. DOI: 10.1007/s10230-015-0336-6
- Korneeva T.V., Yurkevich N.V., Saeva O.P. Geochemical modeling of heavy metals behavior in technogenic systems. Bulletin of the Tomsk Polytechnic University. Geo Аssets Engineering. 2018. Vol. 329. N 3, p. 89-101 (in Russian).
- Khalid S., Shahid M., Alothman Z.A. et al. Predicting chemical speciation of metals in soil using Visual Minteq. Soil Ecology Letters. 2023. Vol. 5. Iss. 3. N 220162. DOI: 10.1007/s42832-022-0162-2
- Environmental indicators in metal mining. Ed. by B.Lottermoser. Springer, 2017, p. 428. DOI: 10.1007/978-3-319-42731-7
- Mugova E., Molaba L., Wolkersdorfer C. Understanding the Mechanisms and Implications of the First Flush in Mine Pools: Insights from Field Studies in Europe’s Deepest Metal Mine and Analogue Modelling. Mine Water and the Environment. 2024. Vol. 43. Iss. 1, p. 73-86. DOI: 10.1007/s10230-024-00969-3
- Wolkersdorfer C. Mine Water Treatment – Active and Passive Methods. Springer, 2022, p. 367. DOI: 10.1007/978-3-662-65770-6
- Yurkevich N.V., Bortnikova S.B., Saeva O.P., Korneeva T.V. Hydrochemical anomalies in the surroundings of the sulfide gold mining wastes (Vershino-Darasun, Trans-Baikal region). Water-Rock Interaction: Geological Evolution: Proceedings of the Fourth all-Russian Scientific Conference with International Participation 17-20 August 2020, Ulan-Ude, Russia. Ulan-Ude: Buryat Scientific Center of the Siberian Branch of the Russian Academy of Sciences, 2020, p. 282-285 (in Russian). DOI: 10.31554/978-5-7925-0584-1-2020-282-285
- Zakrutkin V.E., Gibkov E.V., Reshetnyak O.S., Reshetnyak V.N. River Sediments as River Waters’ Primary Pollution Indicator and Secondary Pollution Source in East Donbass Coal-Mining Areas. Izvestiya Rossiiskoi Akademii Nauk. Seriya Geograficheskaya. 2020. Vol. 84. N 2, p. 259-271 (in Russian). DOI: 10.31857/S2587556620020168
- Tokar E., Kuzmenkova N., Rozhkova A. et al. Migration Features and Regularities of Heavy Metals Transformation in Fresh and Marine Ecosystems (Peter the Great Bay and Lake Khanka). Water. 2023. Vol. 15. Iss. 12. N 2267. DOI: 10.3390/w15122267
- Davydova O.A., Korovina E.V., Vaganova E.S. et al. Physical-chemistry aspects of migratory processes of heavy metals in natural aqueous systems. Bulletin of the South Ural State University. Series “Chemistry”. 2016. Vol. 8. N 2, p. 40-50 (in Russian). DOI: 10.14529/chem160205
- Nordstrom D.K. Geochemical Modeling of Iron and Aluminum Precipitation during Mixing and Neutralization of Acid Mine Drainage. Minerals. 2020. Vol. 10. Iss. 6. N 547. DOI: 10.3390/min10060547
- El-Sharkawy M., Alotaibi M.O., Jian Li. et al. Heavy Metal Pollution in Coastal Environments: Ecological Implications and Management Strategies: A Review. Sustainability. 2025. Vol. 17. Iss. 2. N 701. DOI: 10.3390/su17020701
- Saeva O.P., Bortnikova S.B., Yurkevich N.V., Gaskova O.L. Metal deposition by sulfides during neutralization of acid drainage solution. XX Mezhdunarodnyi nauchnyi kongress “Interekspo GEO-Sibir”: Materialy Mezhdunarodnoi nauchnoi konferentsii “Nedropolzovanie. Gornoe delo. Napravleniya i tekhnologii poiska, razvedki i razrabotki mestorozhdenii poleznykh iskopaemykh. Ekonomika. Geoekologiya”, 15-17 May 2024, Novosibirsk, Russia. Novosibirsk: Sibirskii gosudarstvennyi universitet geosistem i tekhnologii, 2024. Vol. 2. N 4, p. 80-87 (in Russian). DOI: 10.33764/2618-981X-2024-2-4-80-87
- Malov A.I., Sidkina E.S., Ryzhenko B.N. Model of the Lomonosov Diamond Deposit as a Water–Rock System: Migration Species, Groundwater Saturation with Rock-Forming and Ore Minerals, and Ecological Assessment of Water Quality. Geochemistry International. 2017. Vol. 55. N 12, p. 1118-1130. DOI: 10.1134/S0016702917090038