
Three-dimensional modeling of stress-strain state and rock massif stability analysis during the construction of an underground research laboratory
- 1 — Ph.D., Dr.Sci. Head of Laboratory Geophysical Center RAS ▪ Orcid
- 2 — Ph.D., Dr.Sci. Head of Laboratory Nuclear Safety Institute RAS ▪ Orcid
- 3 — Ph.D. Senior Researcher Geophysical Center RAS ▪ Orcid
- 4 — Researcher Geophysical Center RAS ▪ Orcid
- 5 — Ph.D. Senior Researcher Geophysical Center RAS ▪ Orcid
- 6 — Ph.D. Senior Researcher Geophysical Center RAS ▪ Orcid
- 7 — Junior Researcher Geophysical Center RAS ▪ Orcid
Abstract
The paper presents the results of modeling stress fields and analyzing the strength of the rock mass at the Yeniseiskiy site (Krasnoyarsk Region), selected for the construction of an underground research laboratory. Variants of boundary loading conditions along the model boundaries are substantiated, and the results of modeling the distribution of stress tensor components for four loading scenarios are presented, along with an assessment of rock mass stability using well-known strength criteria, including Hoek – Brown, Mohr – Coulomb, von Mises, and others. Regularities in the distribution of stress fields within the rock mass and differences associated with the tectonic conditions of the area are identified. It is established that the localization of zones of stress intensity concentration depends on the ratio of the principal stress components. Orientation of compression in the submeridional direction leads to an increase in stress intensity by 10-15 % relative to other modeling variants. Zones of anomalous stress intensity values are located within blocks as well as in the footwalls of tectonic faults. The models are characterized by high values of the potential energy of distortion in fault zones (as parts of the rock mass most susceptible to deformation) and at their intersections. Three-dimensional modeling makes it possible to identify effects that are weakly expressed in plane strain models. The results of geomechanical modeling are required for planning experiments in the underground research laboratory in order to refine the isolation properties of the rock mass during the disposal of high-level radioactive waste. Methodological approaches of three-dimensional modeling are applied by geomechanical and geotechnical services of industrial enterprises and other hazardous facilities (underground gas storage facilities, mineral deposits, etc.).
This work was conducted in the framework of budgetary funding of the Geophysical Center RAS, adopted by the Ministry of Science and Higher Education of the Russian Federation.
Introduction
Information on the stress-strain state (SSS) of a rock mass is required to address applied geotechnical problems in underground construction and mineral resource extraction [1, 2]. The primary function of the geological environment during the operation of underground repositories for high-level radioactive waste (HLW) is to ensure isolation properties over an extremely long period exceeding 10 thousand years [3-5]. In the Krasnoyarsk Region, construction of an underground research laboratory (URL) is underway [6-8]. The rock mass hosting the HLW is a key object of geomechanical investigations within the URL, since its stability directly determines the geoecological safety of HLW disposal [9-11]. Three-dimensional geodynamic, geomechanical, and geotechnical models are widely applied at foreign URLs – Äspö, Onkalo, Forsmark, Beishan, and others-primarily to solve problems aimed at assessing the geodynamic stability of rock masses [12-14].
The stress-strain state of the geological environment represents a combination of uniform hydro-static compression (lithostatic pressure of the overlying rock sequence) and deviatoric (excess) tectonic stress. Uniform hydrostatic compression corresponds to the mean of the three principal stresses and is responsible for changes in the volume of the medium (dilatancy). If the value of uniform hydrostatic compression is subtracted from the principal components of the stress tensor, the remaining values characterize the principal deviatoric stresses, which are responsible for changes in the shape of structural rock blocks. These two parameters determine the potential for rock failure in zones of maximum stress concentration or in areas with high gradients of variation of stress components. Such processes are accompanied by the formation of fracture systems and loosening of the rock mass, which facilitate fluid migration and thereby reduce the isolation properties of the rock mass [15, 16].
Stability is defined as the ability of the geological environment, as a multicomponent system, to function without altering its inherent structure. Our conceptual approach is based on the paradigm that the geological environment is initially fault-block in nature. This concept is reflected in the fundamental works of S.V.Goldin, M.A.Goncharov, G.G.Kocharyan, P.V.Makarov, A.V.Nikolaev, D.N.Osokina, M.A.Sadovsky, V.G.Talitsky, S.I.Sherman, and others. Particular attention should be paid to the studies by I.M.Batugina, I.M.Petukhov, and A.S.Batugin, in which an approach based on accounting for the SSS and the hierarchically block-structured nature of the geological mass is substantiated when assessing the stability of underground structures in tectonically complex regions [17, 18].
Structural-tectonic models that account for anisotropy of elastic-strength properties within zones of dynamic fault influence, exhibiting different responses to tension and compression, occupy an inter-mediate position between continuous and discrete medium models [19-21]. When assessing the SSS, it is also important to consider the vertical anisotropy of stress fields [22]. Three-dimensional models make it possible to incorporate these important features of the geological environment [23-25].
In the authors’ publications [26, 27], a three-dimensional structural-tectonic model of the site and the results of rock stability assessment in the area of URL construction were presented. The pre-sent study is a continuation of that work and describes variants of boundary loading conditions applied to the model, the results of numerical modeling of the distribution of stress tensor components, and an assessment of rock mass stability using well-known strength criteria, including Hoek – Brown, Mohr – Coulomb, von Mises, and others [28-31].
Data and methods
The geological structure of the Yeniseiskiy site of the Nizhnekanskiy massif is described in detail in works [4, 32]. Figure 1 presents a three-dimensional schematic of the geological structure of the site with approximate dimensions of 2×1.5×0.5 km. The central part shows the layout of underground excavations intended for HLW disposal.
To analyze the stress-strain state of the rock mass, a previously developed structural-tectonic model of the site was used [26], on the basis of which a three-dimensional geomechanical model was constructed in the Micromine environment [27]. The site was discretized into three-dimensional cells, each of which was assigned data on rock properties. The cell size depended on the distance to faults. Fault zones were assigned elastic strength properties that were significantly (approximately by an order of magnitude) weaker than those of the central parts of structural-tectonic blocks. The width of zones of dynamic fault influence was specified as a function of fault length [15].
Subsequently, wireframe models of the computational-geological elements of the site were created, and their frames were exported to the COMSOL Multiphysics 5.6 software. Then, the type of boundary-value problem to be solved and the boundary conditions were selected, after which calculations of the stress-strain state were performed for various boundary-condition scenarios. The resulting data on stress distribution were imported into the mining GGIS Micromine environment in the form of block (cell-based) models and visualized therein for strength analysis. Model verification was carried out by com-paring model results with actual observations, including GNSS measurement data [32]. The calculations were performed using the finite element method, based on variational calculus and the mechanics of deformable solids [33, 34]. The computational domain is divided into a large number of small elements, within which the potential varies linearly, and a system of linear algebraic equations with a large number of nodal displacements is solved. Subsequently, strains and stresses are calculated using the generalized Hooke’s law:
where σij, cijkl, εkl – the stress, elastic modulus (elastic constants, material stiffness matrix), and strain tensors respectively.
In the case of an isotropic material, the components of the tensor cijkl are expressed in terms of Young’s modulus E and Poisson ratio ν as follows:
where δij – is the Kronecker delta, δij=1 for i = j, δij=0 for i ≠ j; λ=Eν/(1+ν)(1-2ν) – first Lame parameter; μ=E/2(1+v) – shear modulus (second Lame parameter).
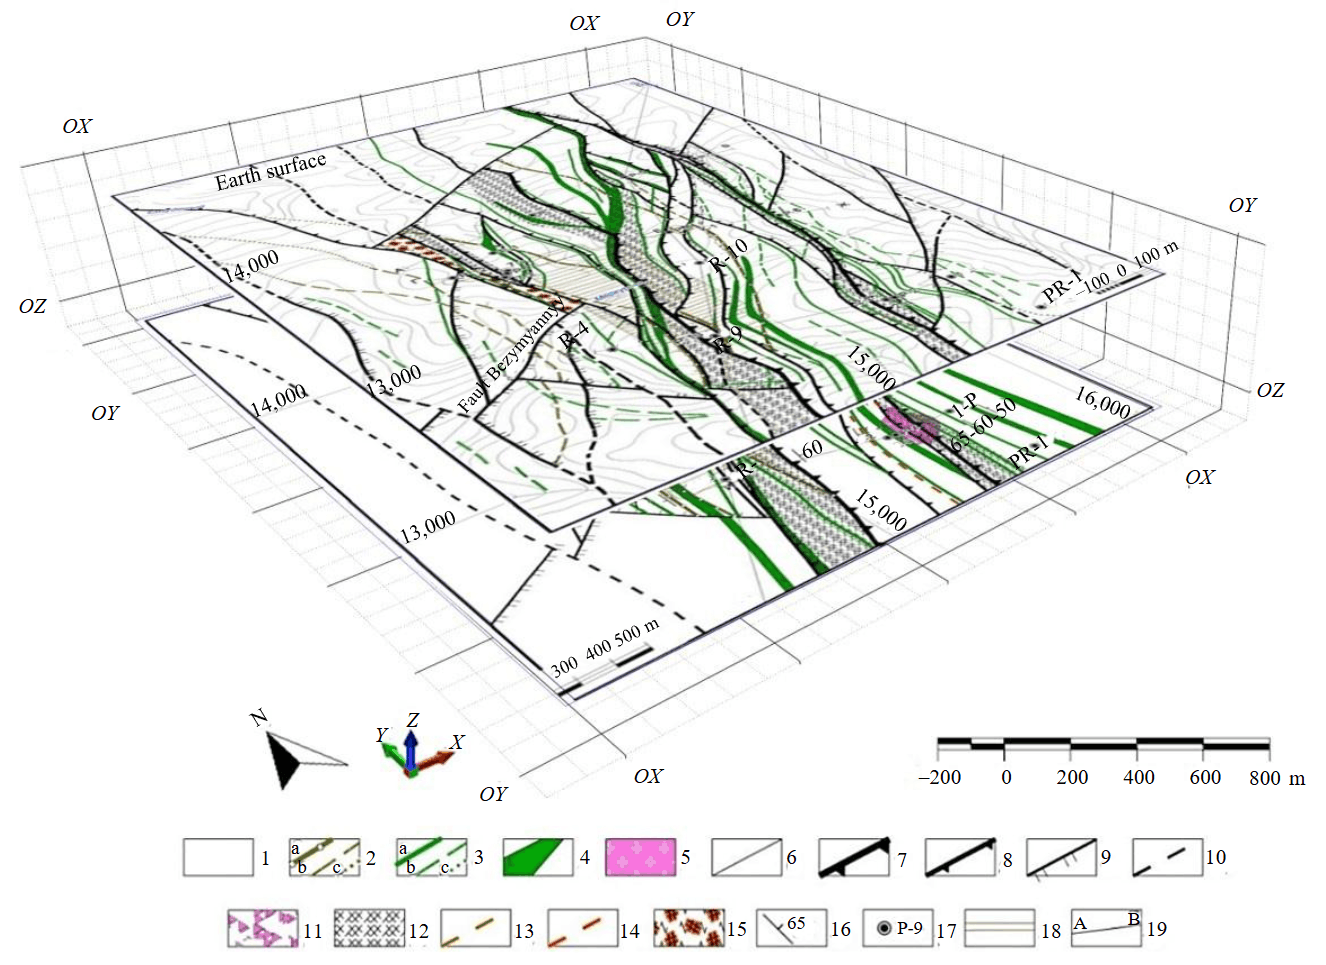
Fig.1. Geological structure of the Yeniseiskiy site [27]
1 – Archean gneisses; 2-4 – dikes: dolerites (2), trachydolerites (3), identified from drilling data (a), geophysical data (b), and inferred (c), metadolerites (4); 5 – gneiss granites; 6 – geological boundaries; 7-10 – faults: 7, 8 – major (7) and minor (8) faults identified from drilling data, 9 – faults identified from geophysical data, 10 – inferred faults; 11 – breccias; 12, 13 – zones of increased fracturing (12) and out-of-scale zones (13); 14 – mylonitization zones; 15 – crush zones; 16 – bedding elements; 17 – boreholes; 18 – contour of the deep geological repository at the +5 and −70 m levels; 19 – lines of geological cross-sections
For numerical implementation of relation (1), the reduced form of the tensor cijkl is used in the form of a 6×6 matrix of elastic constants (stiffness matrix):
The three-dimensional structural-tectonic model of the site was subdivided into 33 computational-geological elements (CGE) corresponding to domains (tectonic blocks) and one separate CGE representing the fault system of the site (Fig.2). Each CGE was characterized by averaged physical and mechanical properties, including bulk density ρ, Young’s modulus, Poisson’s ratio, uniaxial compressive strength σс, tensile strength σt, the Geological Strength Index (GSI), as well as the parameters of the Mohr – Coulomb criterion – the internal friction angle φ and cohesion С. Disturbed zones were distinguished by reduced GSI values, with minimum values of about 35 near the fault core, increasing to 65 with distance from its center and approaching values typical of tectonic blocks.
The wireframe model has dimensions of 7×6×1.5 km, whereas the working domain considered in the analysis is smaller, with dimensions of 2×1.5×0.5 km. This was done to reduce boundary effects arising in SSS calculations at the model boundaries. The minimum finite element size was set to 10 m in zones of intersection of discontinuities, underground excavations, and other geometrically complex features of the wireframe model, and it increased toward the model boundaries.
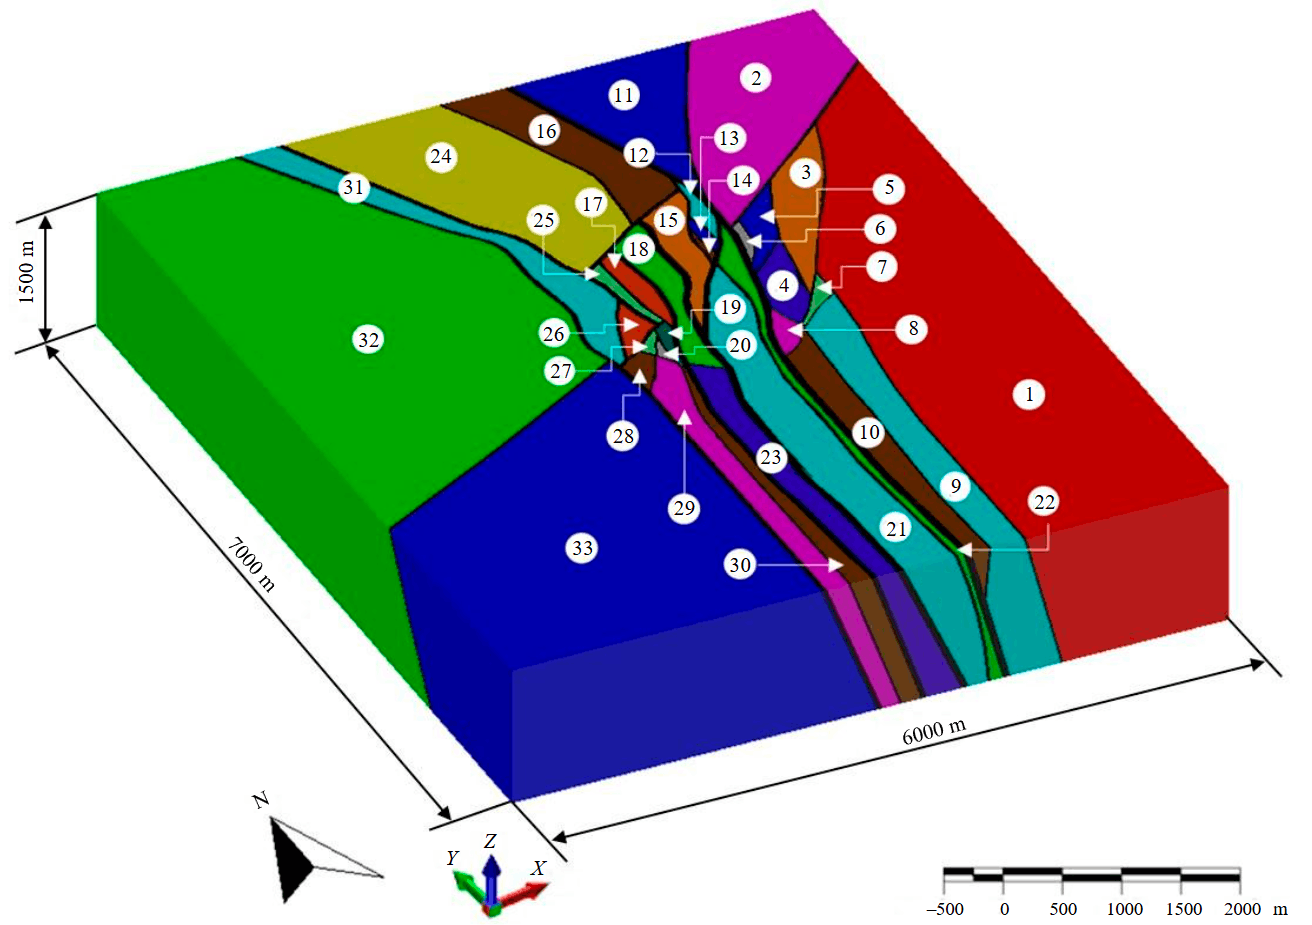
Fig.2. Model of the CGE of the site (the serial numbers of the model elements are shown in circles)
Figure 3 presents the variants of boundary conditions applied in numerical modeling of the SSS of the rock mass. Due to the absence of reliable instrumental data on tectonic stresses, four variants of boundary conditions were adopted. Along the lateral boundaries of the model (in the directions of the X and Y axes), horizontal tectonic stresses were applied, the magnitudes of which were determined proportionally to the vertical stress caused by gravitational loading. The lower boundary of the model was fixed in the vertical direction, while horizontal displacements were not constrained; the upper surface of the model was free. The boundary forces along the lateral sides of the model were varied depending on the calculation scenarios (Fig.3), reflecting different assumptions about the stress state of the rock mass – from standard lithostatic pressure to conditions of tectonic compression and anisotropy defined on the basis of GNSS observation data.
Vertical stresses were calculated using the classical expression for lithostatic pressure:
where σv – effective vertical stress; ρ – rock density; g – acceleration due to gravity; γ – unit weight of rocks; Н – depth; dz – infinitesimal depth increment.
Effective horizontal stresses were determined as a function of the vertical stresses and Poisson’s ratio, which characterizes the elastic properties of the rocks, in accordance with the principles of linear elasticity theory (the lateral pressure coefficient for case a, Fig.3):
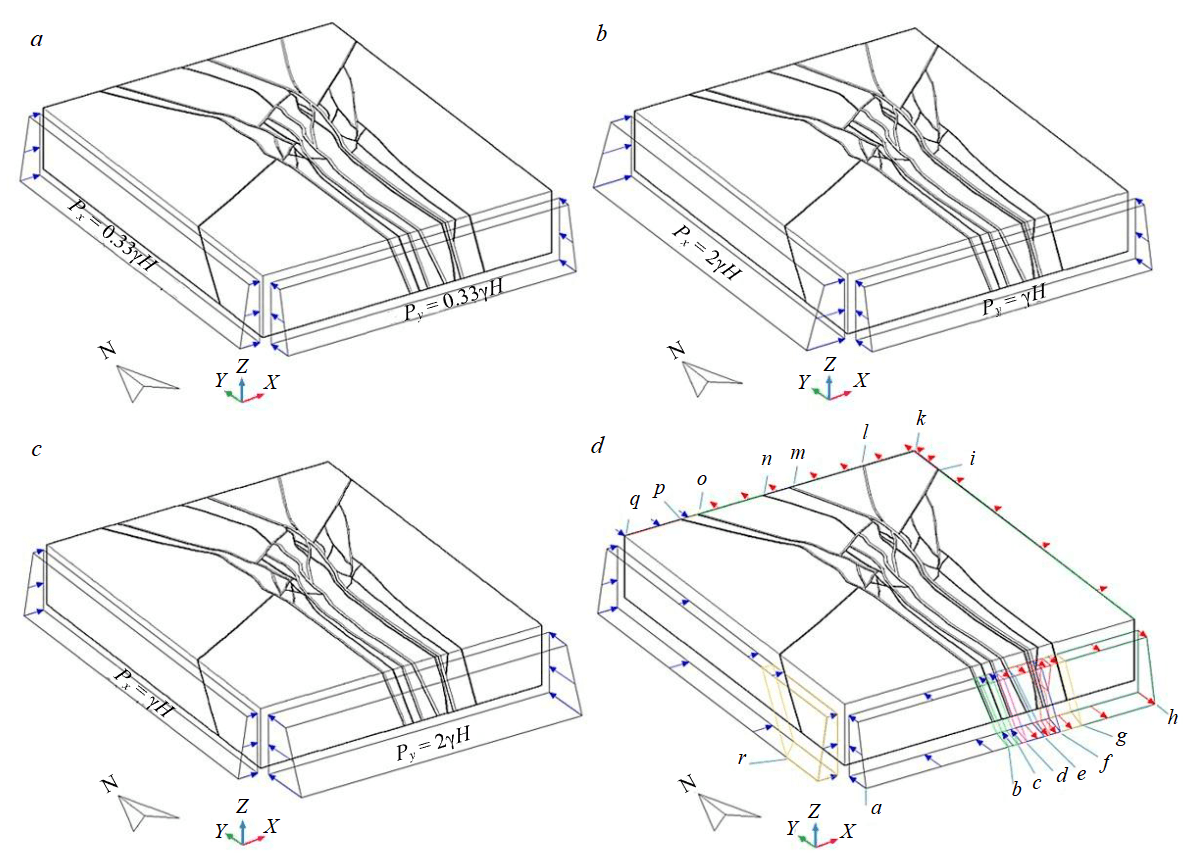
Fig.3. Variants of boundary condition specification (tectonic stresses) within the modeling area: a – based on gravitational pressure σyy/σxx = 1; b – based on geological data σyy/σxx = 0.5; c – based on a conservative forecast σyy/σxx = 0.5; d – based on GNSS measurement results; piecewise heterogeneous distribution, segments a-r sites of the contour Boundary actions are shown schematically as surface pressures applied to the corresponding faces of the model (Рх, РуalongaxesX, Y). Blue arrows indicate compression, red arrows indicate tension
Results of stress field calculation
As a result of numerical modeling of the SSS, models of the distribution of stress tensor components were obtained for four variants of loading applied to the model. The most representative visual models of the simulation results are shown in Fig.4 and 5.
Figure 4 shows the distribution of the vertical stress field σzz = γH (lithostatic stresses) at a depth of 450 m from the ground surface for different variants. It can be seen that the results adequately (in a classical sense) reflect the stress field. The vertical component increases systematically from the ground surface to a depth of 450 m, from 0 to −13 MPa. In the locations of faults, zones of stress relief are formed with σzz values from −5 to −8 MPa, whereas in the central parts of blocks, zones of stress concentration occur with values from −15 to −18 MPa for variant a (see Fig.3, 4). Correspondingly, an increase in these values is observed for variants b and c (see Fig.3, 4).
Figure 5 presents the distribution of stress intensity σi in the horizontal and vertical planes within virtual boreholes (Fig.6, I). Stress intensity is calculated using formula (2):
где σx, σy, σz – normal stresses along the X, Y, Z axes respectively; τxy, τyz, τxz – shear stresses in the corresponding planes.
Strength is evaluated using the equivalent stress
where σ1, σ2, σ3 – principal stress; [σ] – allowable stress.
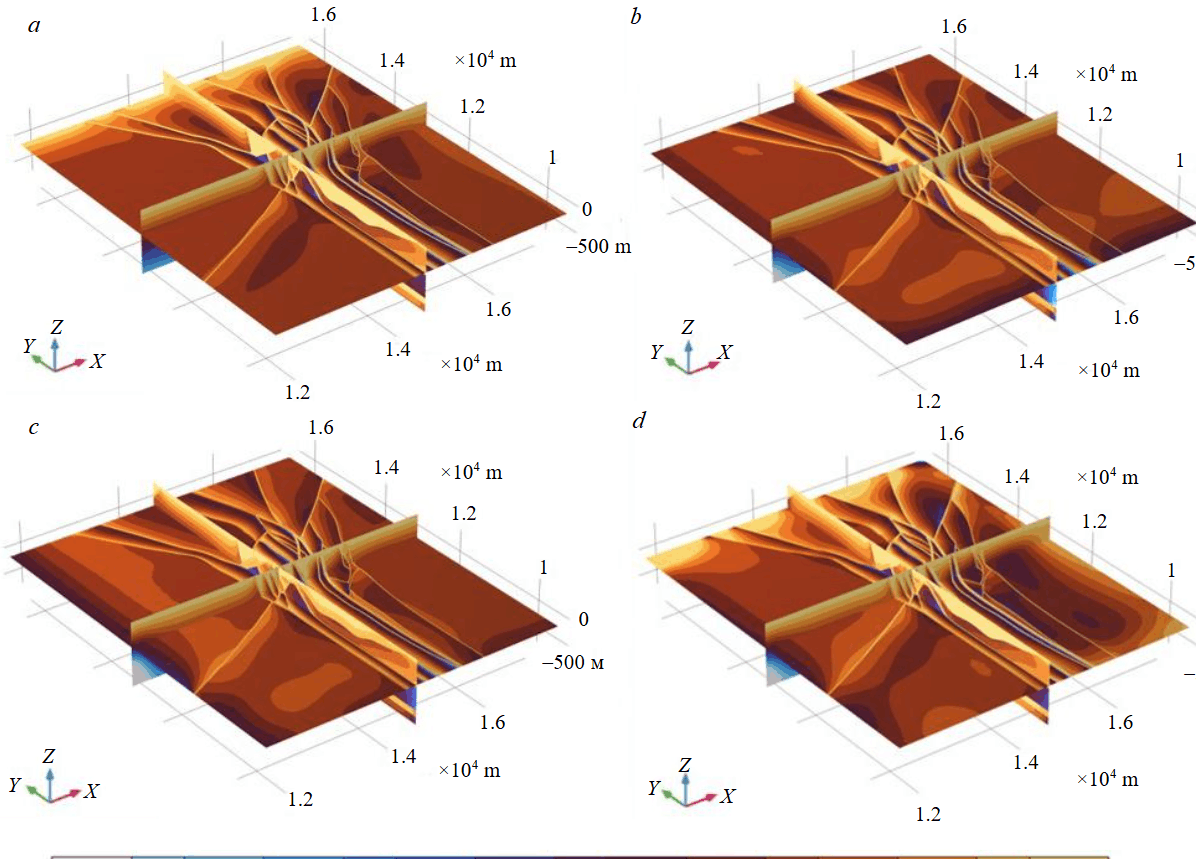
Fig.4. Distribution of vertical stresses σzz for boundary-condition variants a-d (see Fig.3)
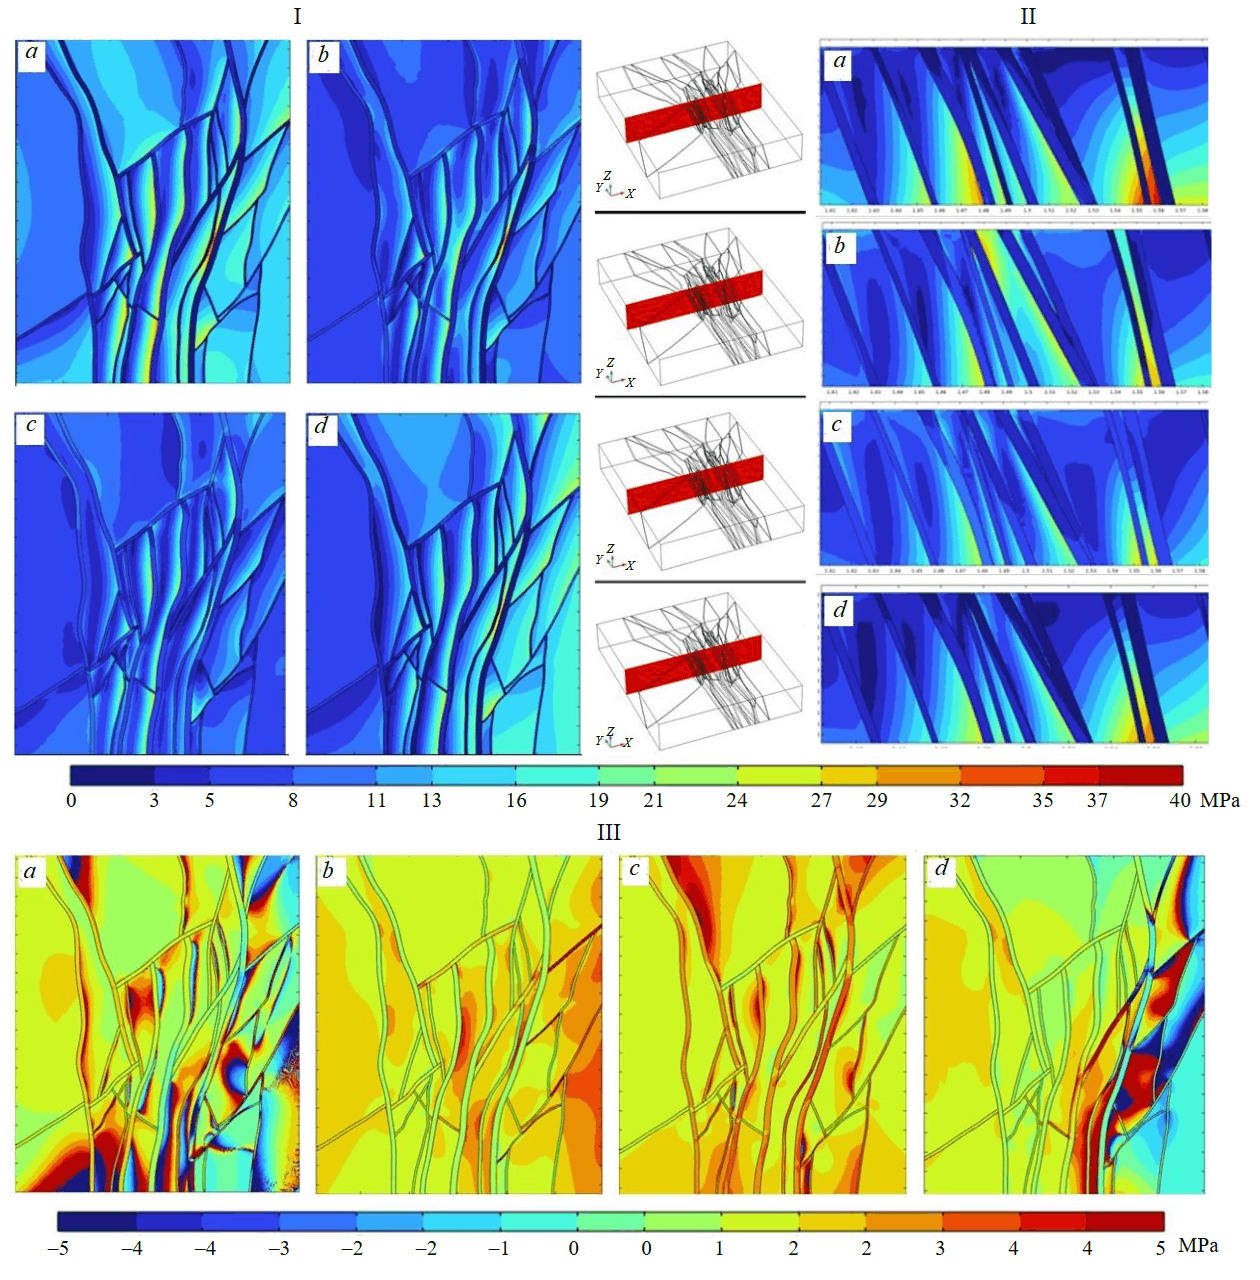
Fig.5. Stress distribution at a depth of 450 m: stress intensity σi with depth in horizontal (I) and vertical (II) planes, and distribution of the ratio of horizontal stresses σyy/σxx (ΙΙΙ) for variants a-d (see Fig.3); schematic insets at the top indicate the positions of the vertical plane sections (ΙΙ)
The distributions of the stress intensity σi for variants a and d (see Fig.3, 5) are very similar. The σi values vary from 0 to 40 MPa, while zones of reduced stresses in the range of 0-8 MPa are spatially associated with fault zones. Maximum stress intensity values of 35-40 MPa are observed at contact areas between fault influence zones and tectonic blocks. It should be recalled that variant d (see Fig.3) was constructed based on actual observations of ground surface deformations. An important preliminary conclusion can be drawn that under present-day conditions, the stress-strain state of rocks at a depth of 500 m is governed by lithostatic pressure with a lateral pressure coefficient in accordance with Dinnik’s hypothesis (3). Variants b and c (see Fig.3, 5), in which the horizontal components are increased by a factor of two relative to γH, differ from variant d (Fig.5) toward higher stress values.
Figure 5, III shows the distribution of the ratio of horizontal stresses σyy/σхх. It is known that the higher this ratio, the greater the likelihood of failure in a given location. This is well substantiated in studies devoted to seismic hazard assessment [35-37]. Zones with anomalous ratios of the acting stresses σyy/σхх > 3-5 indicate areas of the rock mass where conditions for rupture formation develop from the standpoint of release of accumulated elastic potential energy. The probable direction of fault formation is determined by the direction of the maximum decrease in the gradient of elastic potential energy. Variants a and d differ significantly from variants b and c, especially in the southeastern part of the site (see Fig.3, 5).
Figure 6 presents the locations of virtual boreholes within the geomechanical model of the site (Fig.6, I) and the graphs of stress intensity σi distribution along virtual borehole N 4 (Fig.6, II), which intersects a fault zone and is representative for the analysis. Comparison of the stress intensity distribution curves for different boundary-condition variants makes it possible to identify differences in the localization of anomalous stress zones associated with tectonic structures. For variants a-c (see Fig.3, 6, II), similar behavior is observed – linear stress increase due to lithostatic pressure with a pronounced anomaly of reduced σi values within the fault zone. Variant d, based on GNSS observation data [32], differs significantly; it is characterized by higher absolute stress values and shows an anomaly of increased stress intensity between the design horizon of the URL and the fault influence zone.
Analysis of stability of the rock massif
There are several strength theories that characterize the ability of rocks to resist mechanical loads. They have both advantages and limitations [35, 38, 39]. To ensure a comprehensive assessment, the following strength criteria were used: maximum shear stress (Tresca model); maximum specific distortion energy (von Mises model); the Mohr – Coulomb model; and the Hoek – Brown model, which is particularly widespread in the mining industry.
According to the Hoek – Brown criterion, rock failure occurs when the maximum of the three principal stresses reaches a critical value that depends on the tensile and compressive strength of the rock. This critical stress level is determined by the expression
where σ1, σ3 – the maximum and minimum principal stresses, MPa; σci – uniaxial compressive strength of a core specimen, МPа; mb, s, a – Hoek – Brown constants,
mi – parameter of the disturbed rock; D – disturbance factor of the rock mass, 0 ≤ D ≤ 1; е – base of the natural logarithm (Euler’s number, approximately equal to 2.71828). The parameters mi, GSI, D are determined empirically.
Numerical calculation of the GSI index was performed using empirical relationships with the rock quality designation (RQD), the RMR rating, or the Q-index in the Bieniawski and Barton classification systems. The parameter D = 0, since underground excavations of the URL have not yet been driven within the considered section of the geological mass. The absence of technogenic impact on the rocks makes it possible to regard the rock mass structure as being formed exclusively by natural fracturing.
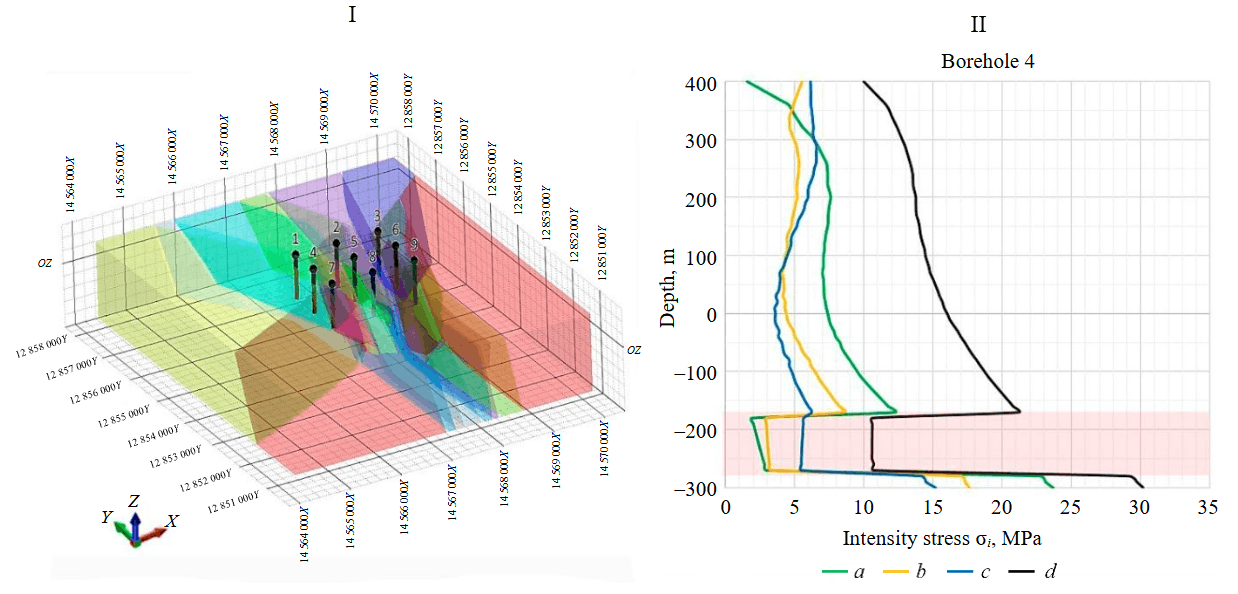
Fig.6. Analysis of virtual boreholes: location within the geomechanical model of the site (I) and the distribution of stress intensity si along virtual borehole 4 (II) for boundary condition variants a-d (see Fig.3)
Stress intensity is an indicator of the energy saturation of a fragment of the geological environment, since the potential energy of distortion is calculated as
where V – volume.
The distribution of the potential energy of distortion, from the standpoint of geomechanical process analysis, reflects the work accumulated in a body during its deformation under the action of external forces or loads. This is the energy that is stored as a result of changes in the shape and structure of the rock mass without failure. Figure 7, I presents the results of calculating the potential energy of distortion in horizontal and vertical planes within virtual boreholes (see Fig.6, I). The overall morphology of the energy distribution at a qualitative level is reproduced in all four variants. In terms of absolute values of U, the first model exhibits the lowest background energy levels, of about 1000 J/m3. In contrast, the fourth model shows the highest energy values, reaching up to 1300 J/m3. In general, anomalously high values of U are characteristic of fault domains, near-fault zones, and fault intersection zones, which serves as one of the markers for model verification, since maximum deformation energy should be accumulated in fault zones [40].
Figure 7, II and III demonstrate the distribution of maximum shear stress according to the Hoek – Brown criterion σmax and the Mohr – Coulomb criterion τmax at a depth of 450 m, in horizontal and vertical planes within virtual boreholes (see Fig.6, I). The presented models show stress distributions with pronounced anomalous zones associated with faults, where stress values vary from −29 to −23 MPa.
The greatest changes in the stress state are concentrated along fault zones and in their immediate vicinity. In inter-fault areas (tectonic blocks), the stress distribution is more uniform, with a predominance of moderate values of maximum shear stresses. It should be noted that in variant d in Fig.7, a pronounced anisotropy of the stress field is observed, manifested in the formation of zones with sharp stress gradients at the boundaries between areas of reduced and elevated stress values. This effect is caused by the nonuniform distribution of horizontal tectonic loads specified in the modeling conditions. The formation of high stress gradients indicates potential zones of local rock mass failure [36, 41, 42].
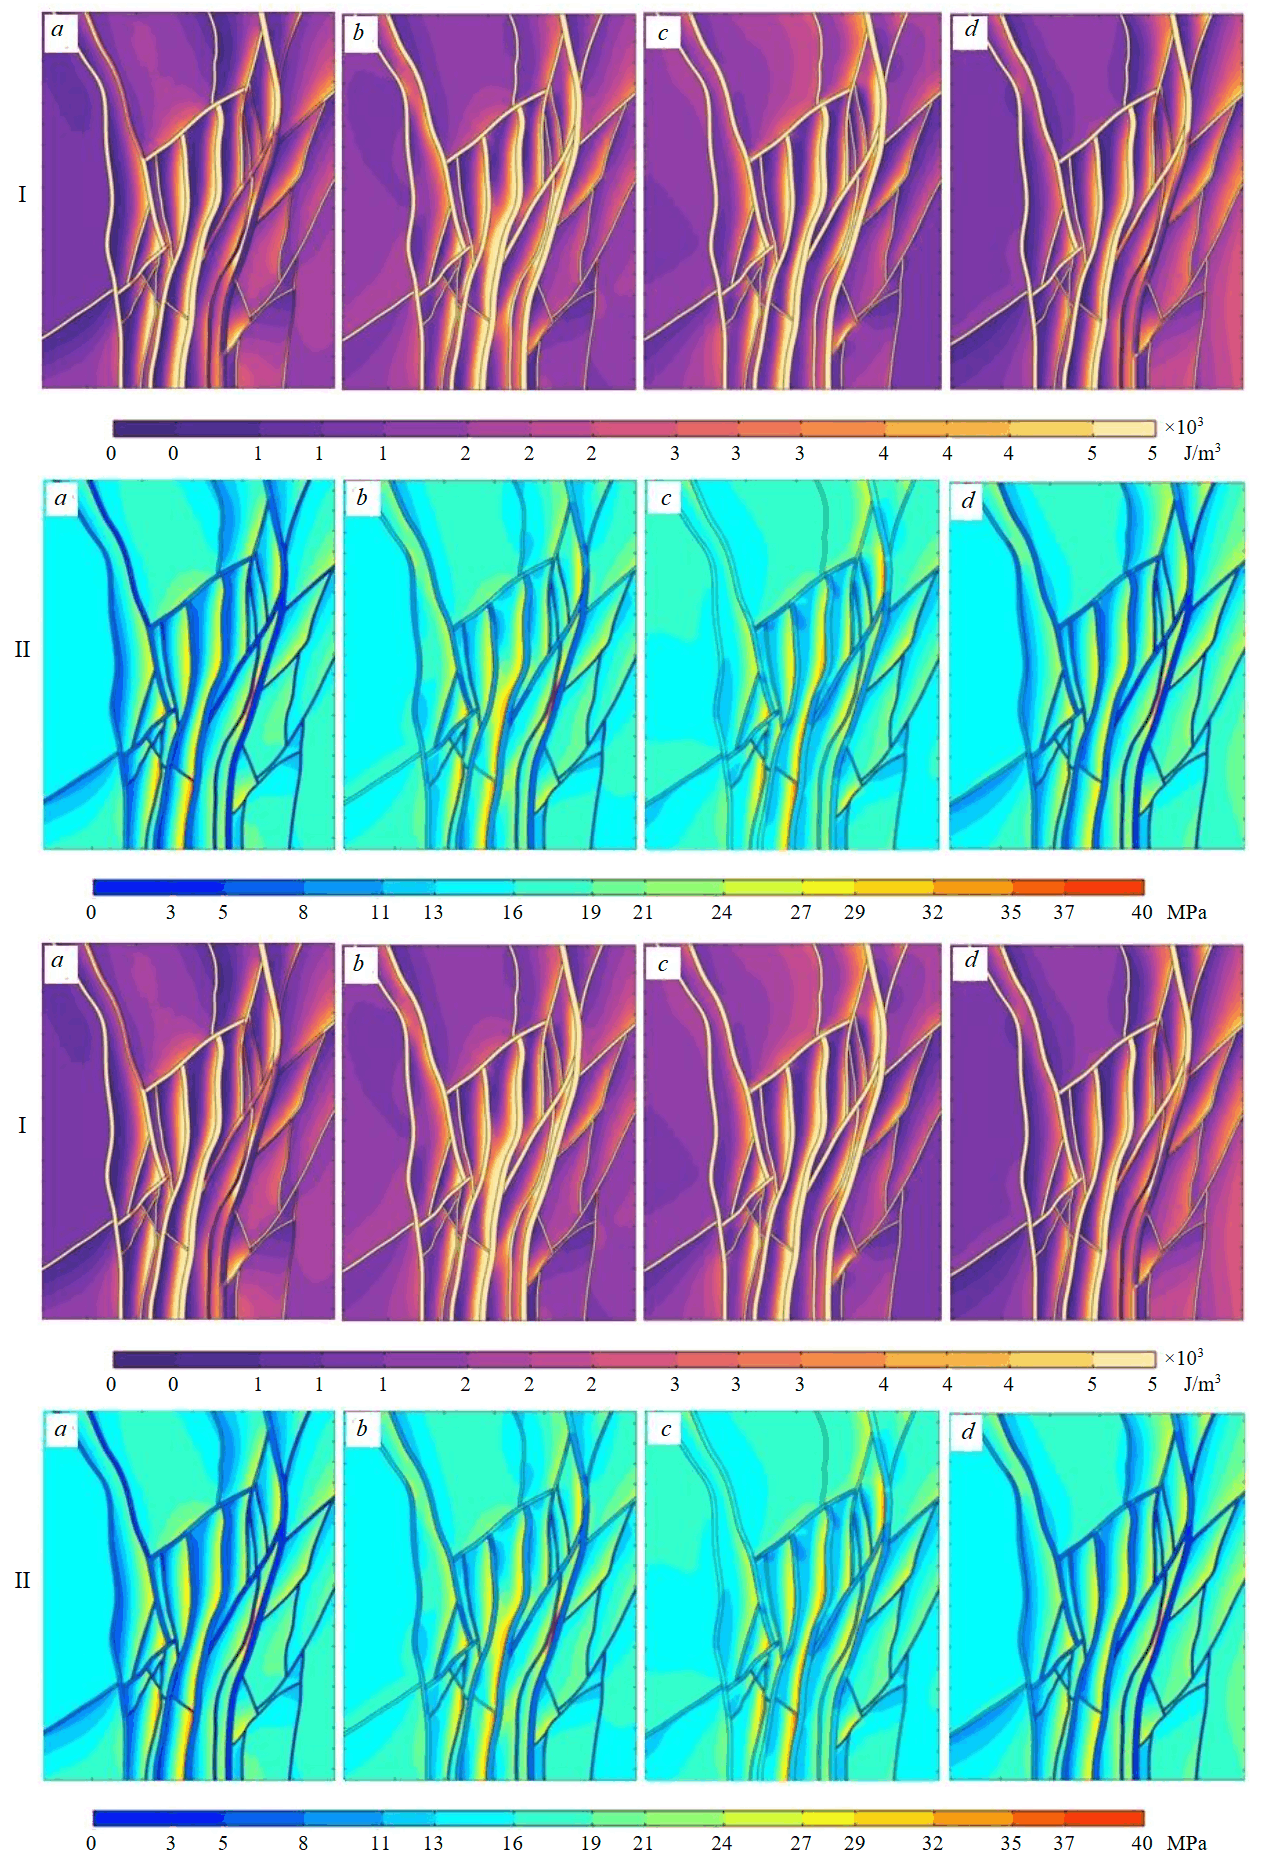
Fig.7. Analysis of modeling results at a depth of 450 m: distribution of the potential energy of distortion (I), stresses according to the Hoek – Brown criterion σmax (II) and the Mohr – Coulomb criterion τmax (III) for variants a-d (see Fig.3)
Discussion
The performed multi-variant modeling of the stress-strain state of rocks revealed the presence of both general regularities and local differences in the distribution of stress fields. In particular, a clear relationship is observed between zones of stress concentration and the depth and geometry of faults.
General trends in the distribution of stress fields for all models are as follows:
- With respect to faults, the effective/maximum values of stress intensity are localized within structural blocks and, depending on the applied external loads, amount to 12/24, 10/20, 10/20, and 9/19 MPa for the four models respectively (see Fig.4). The mean values are close to the stresses caused by the weight of rocks γН at a depth ~ 500 m. This is a completely natural phenomenon, since disturbed zones of the rock mass have a lower load-bearing capacity and transfer stresses to adjacent, more elastic portions of the mass.
- Zones of elevated stresses are localized in the footwalls of discontinuities. This is frequently confirmed by instrumental measurements in underground excavations and deep boreholes [37, 39], as well as by the analysis of seismological data [43, 44].
Thus, the validity of the assumptions adopted in the modeling with respect to the specification of the external stress field and the formation of a computational-geological model adequate to the real geological environment is substantiated.
Differences in the distribution of stress fields are as follows:
- Analysis of virtual boreholes shows that stepwise changes in stress intensity occur at intersections with fault zones (see Fig.6, II). The most characteristic stress distribution behavior is observed for the curve of the fourth model (see Fig.6, II, d). Down to a depth of 400 m, stress values vary smoothly within the range of 5-15 MPa. Within the fault zone (to depths of approximately 550 m), a decrease in stresses to 3-13 MPa is observed. Beyond the fault zone, a sharp increase in stresses occurs, reaching values of about 24 MPa.
- The location of stress concentration zones depends on the direction of (tectonic) loads and the ratio of stress components σуу/σхх. Orientation of stresses in a submeridional direction relative to a sublatitudinal one leads to an increase in stresses by 10-15 %.
Within the framework of the adopted boundary conditions, four strength models were used to assess rock mass stability, yielding the following results:
- The potential energy of distortion most accurately reflects the process of rock mass failure. In the models, high values of U are characteristic precisely of fault zones (as parts of the medium most susceptible to deformation), near-tectonic zones, and their intersections.
- According to the Mohr – Coulomb criterion, the τmax values are very similar, with the maximum shear stress reaching up to 35 MPa.
- The distribution according to the Hoek – Brown criterion σmax is generally consistent with the previous cases; however, the maximum principal stress is somewhat lower than 25 MPa.
- In the schemes of maximum shear stress distribution according to the Tresca criterion τmax, which is oriented toward brittle rocks, more contrasting patterns are obtained. Background values of τmax are observed in the range of 4-16 MPa. For the fourth model, higher values were obtained in the eastern part of the area.
Conclusion
The performed 3D modeling of the stress-strain state of rocks made it possible to obtain the distribution of stress fields in the rock mass down to a depth of 500 m within the Yeniseiskiy site. An assessment was carried out of the relationships between the stress tensor components obtained in the models and the strength properties of the rocks using four of the most widely known strength models. Analysis of the results for four variants of boundary conditions applied along the site boundaries showed that the rock mass is sufficiently stable and possesses the required margin of strength.
Analysis of three-dimensional SSS models demonstrated that they have a number of advantages over models formulated in a 2D setting. The main effect is that 3D modeling allows the identification of spatial effects that are weakly manifested in plane strain models, in particular due to the lack of accounting for fault dip angles. This is especially important for discontinuities with dip angles of less than 60°. The results will be used in planning geomechanical experiments in the underground research laboratory to refine the isolation properties of the rock mass.
Improving the quality of design for underground construction and mineral deposit exploitation is based on the active use of digital geological and technological models (digital twins) [45]. The development of 3D SSS models of rocks facilitates data analysis and informed engineering decision-making. The implementation of 3D models makes it possible to significantly increase the efficiency of working with geological and geophysical databases, the reliability of predictive calculations, and the safety of mining operations.
References
- Protosenya A.G., Belyakov N.A., Bouslova M.A. Modelling of the stress-strain state of block rock mass of ore deposits during development by caving mining systems. Journal of Mining Institute. 2023. Vol. 262, p. 619-627.
- Eremenko V.A. Stress state modeling of coaxial three-level open stoping in Map3D. Mining informational and analytical bulletin. 2018. N 11, p. 5-17 (in Russian). DOI: 10.25018/0236-1493-2018-11-0-5-17
- Abalkina I.L., Bolshov L.A., Kapyrin I.V. et al. Radioactive waste and spent nuclear fuel deep geological disposal long-term safety assessment for 10 000 years and over: methodology and the current state. Preprint N IBRAE-2019-03. Moscow: Nuclear Safety Institute, 2019, p. 40 (in Russian).
- Anderson E.B., Belov S.V., Kamnev E.N. et al. Underground Isolation of Radioactive Waste. Мoscow: Gornaya kniga, 2011, p. 592.
- Kochkin B.T., Malkovskii V.I., Yudintsev S.V. Scientific Foundations for Safety Assessment of Geological Disposal of Long-Lived Radioactive Waste (Yeniseiskiy Project). Мoscow: Institut geologii rudnykh mestorozhdenii, petrografii, mineralogii i geokhimii RAN, 2017, p. 384.
- Abramov A.A., Bolshov L.A., Dorofeeev A.N. et al. Underground Research Laboratory in the Nizhnekanskiy Massif: Evolutionary Design Study. Radioactive Waste. 2020. N 1 (10), p. 9-21 (in Russian). DOI: 10.25283/2587-9707-2020-1-9-21
- Gupalo V.S., Kazakov K.S., Minaev V.A. et al. Results of studies in the existing wells of the Yeniseyskiy subsurface site including those performed to identify the main fracture systems and rock anisotropy. Radioactive Waste. 2021. N 1 (14), p. 76-86 (in Russian). DOI: 10.25283/2587-9707-2021-1-76-86
- Tatarinov V.N., Morozov V.N., Kaftan V.I. et al. Underground Research Laboratory: Problems of Geodynamic Research. Radioactive Waste. 2019. N 1 (6), p. 77-89 (in Russian).
- Tsebakovskaya N.S., Utkin S.S., Kapyrin I.V. et al. Review of International Practices for Spent Nuclear Fuel and Radioactive Waste Disposal. Мoscow: Komtekhprint, 2015, p. 208.
- Rutqvist J., Tsang C.-F. Modeling nuclear waste disposal in crystalline rocks at the Forsmark and Olkiluoto repository sites – Evaluation of potential thermal-mechanical damage to repository excavations. Tunnelling and Underground Space Technology. 2024. Vol. 152. N 105924. DOI: 10.1016/j.tust.2024.105924
- Chenxi Zhao, Qinghua Lei, Martin Ziegler, Simon Loew. Structurally-controlled failure and damage around an opening in faulted Opalinus Clay shale at the Mont Terri Rock Laboratory: In-situ experimental observation and 3D numerical simulation. International Journal of Rock Mechanics and Mining Sciences. 2024. Vol. 180. N 105812. DOI: 10.1016/j.ijrmms.2024.105812
- Hongsu Ma, Ju Wang, Ke Man et al. Excavation of underground research laboratory ramp in granite using tunnel boring machine: Feasibility study. Journal of Rock Mechanics and Geotechnical Engineering. 2020. Vol. 12. Iss. 6, p. 1201-1213. DOI: 10.1016/j.jrmge.2020.09.002
- Yue Zhang, Qiang-Yong Zhang, Kang Duan et al. Reliability analysis of deep underground research laboratory in Beishan for geological disposal of high-level radioactive waste. Computers and Geotechnics. 2020. Vol. 118. N 103328. DOI: 10.1016/j.compgeo.2019.103328
- Zhiguo An, Qingyun Di, Changmin Fu, Zhongxing Wang. CSAMT-Driven Feasibility Assessment of Beishan Underground Research Laboratory. Sensors. 2025. Vol. 25. Iss. 14. N 4282. DOI: 10.3390/s25144282
- Kocharyan G.G. Nucleation and Evolution of Sliding in Continental Fault Zones under the Action of Natural and Man-Made Factors: A State-of-the-Art Review. Izvestiya, Physics of the Solid Earth. 2021. Vol. 57. N 4, p. 439-473. DOI: 10.1134/S1069351321040066
- Fraser Harris A.P., McDermott C.I., Kolditz O., Haszeldine R.S. Modelling groundwater flow changes due to thermal effects of radioactive waste disposal at a hypothetical repository site near Sellafield, UK. Environmental Earth Sciences. 2015. Vol. 74. Iss. 2, p. 1589-1602. DOI: 10.1007/s12665-015-4156-6
- Petukhov I.M., Batugina I.M. Geodynamics of the Earth’s Interior. Мoscow: Nedra kommyunikeishens LTD, 1999, p. 287.
- Batugin A., Ogadzhanov V., Khan S. et al. Exploring the Nature of Seismic Events in the Underground Gas Storages Area of the Volga Federal District. Russian Journal of Earth Sciences. 2022. Vol. 22. N 6. N ES6010. DOI: 10.2205/2022ES000819
- Zuev B.Yu. Methodology of modeling nonlinear geomechanical processes in blocky and layered rock masses on models made of equivalent materials. Journal of Mining Institute. 2021. Vol. 250, p. 542-552. DOI: 10.31897/PMI.2021.4.7
- Danda Shi, Jinzhong Niu, Jiao Zhang et al. Effects of particle breakage on the mechanical characteristics of geogrid-reinforced granular soils under triaxial shear: A DEM investigation. Geomechanics for Energy and the Environment. 2023. Vol. 34. N 100446. DOI: 10.1016/j.gete.2023.100446
- Torabi A., Rudnicki J., Alaei B., Buscarnera G. Envisioning faults beyond the framework of fracture mechanics. Earth-Science Reviews. 2023. Vol. 238. N 104358. DOI: 10.1016/j.earscirev.2023.104358
- Qiangyong Zhang, Chuancheng Liu, Kang Duan et al. True Three-Dimensional Geomechanical Model Tests for Stability Analysis of Surrounding Rock During the Excavation of a Deep Underground Laboratory. Rock Mechanics and Rock Engineering. 2020. Vol. 53. Iss. 2, p. 517-537. DOI: 10.1007/s00603-019-01927-0
- Ziegler M.O., Heidbach O. The 3D stress state from geomechanical–numerical modelling and its uncertainties: a case study in the Bavarian Molasse Basin. Geothermal Energy. 2020. Vol. 8. N 11. DOI: 10.1186/s40517-020-00162-z
- Ziegler M.O., Heidbach O. Increasing accuracy of 3-D geomechanical-numerical models. Geophysical Journal International. 2024. Vol. 237. Iss. 2, p. 1093-1108. DOI: 10.1093/gji/ggae096
- Ahlers S., Henk A., Hergert T. et al. 3D crustal stress state of Germany according to a data-calibrated geomechanical model. Solid Earth. 2021. Vol. 12. Iss. 8, p. 1777-1799. DOI: 10.5194/se-12-1777-2021
- Akmatov D.Zh., Manevich A.I., Tatarinov V.N. et al. Assessment of rock massif sustainability in the area of the underground research laboratory (Nizhnekanskii Massif, Enisei site). Journal of Mining Institute. 2024. Vol. 266, p. 167-178.
- Akmatov D.Zh., Manevich A.I., Tatarinov V.N., Shevchuk R.V. 3D structure tectonics model of Yenisei site of the Nizhnekansk Massif. Gornyi zhurnal. 2023. N 1, p. 69-74 (in Russian). DOI: 10.17580/gzh.2023.01.11
- Hoek E., Brown E.T. The Hoek-Brown failure criterion and GSI – 2018 edition. Journal of Rock Mechanics and Geotechnical Engineering. 2019. Vol. 11. Iss. 3, p. 445-463. DOI: 10.1016/j.jrmge.2018.08.001
- Reches Z., Wetzler N. An energy-based theory of rock faulting. Earth and Planetary Science Letters. 2022. Vol. 597. N 117818. DOI: 10.1016/j.epsl.2022.117818
- Korshunov V.A., Pavlovich A.A., Bazhukov A.A. Evaluation of the shear strength of rocks by cracks based on the results of testing samples with spherical indentors. Journal of Mining Institute. 2023. Vol. 262, p. 606-618. DOI: 10.31897/PMI.2023.16
- Morozov O.A., Rastorguev A.V., Neuvazhaev G.D. Assessing the State of the Geological Environment at the Yeniseyskiy Site (Krasnoyarsk Region). Radioactive Waste. 2019. N 4 (9), p. 46-62 (in Russian). DOI: 10.25283/2587-9707-2019-4-46-62
- Gvishiani A.D., Tatarinov V.N., Kaftan V.I. et al. The Velocities of Modern Horizontal Movements of Earth Crust in the South Sector of Yenisei Ridge According to GNSS Observations. Doklady Earth Sciences. 2020. Vol. 493. N 1, p. 544-547. DOI: 10.1134/S1028334X20070077
- Kruszewski M., Hofmann H., Alvarez F.G. et al. Integrated Stress Field Estimation and Implications for Enhanced Geothermal System Development in Acoculco, Mexico. Geothermics. 2021. Vol. 89. N 101931. DOI: 10.1016/j.geothermics.2020.101931
- Kruszewski M., Montegrossi G., Balcewicz M. et al. 3D in situ stress state modelling and fault reactivation risk exemplified in the Ruhr region (Germany). Geomechanics for Energy and the Environment. 2022. Vol. 32. N 100386. DOI: 10.1016/j.gete.2022.100386
- Baron I., Melichar R., Sokol L. et al. 3D active fault kinematic behaviour reveals rapidly alternating near-surface stress states in the Eastern Alps. Geological Society, London, Special Publications. 2024. Vol. 546, p. 119-133. DOI: 10.1144/SP546-2023-32
- Bramham E.K., Wright T.J., Paton D.A., Hodgson D.M. A new model for the growth of normal faults developed above pre-existing structures. Geology. 2021. Vol. 49. N 5, p. 587-591. DOI: 10.1130/G48290.1
- Grishchenko A.I., Semenov A.S., Melnikov B.E. Modeling the processes of deformation and destruction of the rock sample during its extraction from great depths. Journal of Mining Institute. 2021. Vol. 248, p. 243-252. DOI: 10.31897/PMI.2021.2.8
- Ahlers S., Röckel L., Hergert T. et al. The crustal stress field of Germany: a refined prediction. Geothermal Energy. 2022. Vol. 10. N 10. DOI: 10.1186/s40517-022-00222-6
- Rebetsky Yu.L., Sycheva N.A. The stressed state of the Earth’s crust in the Altai-Sayan mountain region: reconstruction based on the modified algorithms of the cataclastic method. Geosystems of Transition Zones. 2024. Vol. 8. N 4, p. 261-276 (in Russian). DOI: 10.30730/gtrz.2024.8.4.261-276
- Junjie Xiao, Jiacun Liu, Ying Xu et al. An improved three-dimensional extension of Hoek-Brown criterion for rocks. Geomechanics and Geophysics for Geo-Energy and Geo-Resources. 2024. Vol. 10. Iss. 1. N 129. DOI: 10.1007/s40948-024-00841-2
- Budkov A.M., Kishkina S.B., Kocharyan G.G. Modeling Supershear Rupture Propagation on a Fault with Heterogeneous Surface. Izvestiya, Physics of the Solid Earth. 2022. Vol. 58. N 4, p. 562-575. DOI: 10.1134/S1069351322040012
- Budkov A.M., Kocharyan G.G. Formation of the Near-Fault Damage Zone during Dynamic Rupture in a Crystalline Rock Mass. Physical Mesomechanics. 2024. Vol. 27. N 3, p. 303-316. DOI: 10.1134/S102995992403007X
- Qiang Xu, Qiangling Yao, Changhao Shan, Chuangkai Zheng. A New Hydraulic Fracturing Instrument to Measure In Situ Stress and Its Application in Chahasu Coal Mine. Geotechnical Testing Journal Logo. 2022. Vol. 45. Iss. 5, p. 901-914. DOI: 10.1520/GTJ20210207
- Heidbach O., Rajabi M., Xiaofeng Cui et al. The World Stress Map database release 2016: Crustal stress pattern across scales. Tectonophysics. 2018. Vol. 744, p. 484-498. DOI: 10.1016/j.tecto.2018.07.007
- Biryuchev I.V., Makarov A.B., Usov A.A. Geomechanical model of underground mine. Part I. Creation. Gornyi zhurnal. 2020. N 1, p. 42-48 (in Russian). DOI: 10.17580/gzh.2020.01.08