
Electromagnetic sounding of deep lithosphere of the Belomorian Block (Fennoscandian Shield): the experiment “Kovdor-2023”
- 1 — Leading Engineer Geological Institute KSC RAS ▪ Orcid
- 2 — Ph.D. Senior Researcher Geological Institute KSC RAS ▪ Orcid
- 3 — Junior Researcher Geological Institute KSC RAS ▪ Orcid
- 4 — Ph.D. Leading Researcher Northern Energetics Research Centre KSC RAS ▪ Orcid
- 5 — Researcher Northern Energetics Research Centre KSC RAS ▪ Orcid
- 6 — Leading Programmer Geological Institute KSC RAS ▪ Orcid
Abstract
The results of the “Kovdor-2023” experiment on deep electromagnetic sounding of the Earth’s crust within the Archean basement of the southwest of the Kola Region with natural (magnetotelluric sounding, MTS) and artificial (controlled source audio magnetotelluric sounding, CSAMT) sources are presented. The experiment was intended to study the electrical conductivity of the upper Earth’s crust in the area of the Belomorian Block of the Fennoscandian Shield in continuation of the work of 1995, as well as the “Kovdor-2015” experiment, which suggested that the presence of a heterogeneous conductive layer (DD layer) with longitudinal conductivity from tenths to units of siemens in the upper part of the Precambrian crystalline crust at depths of up to ten kilometers is an inherent regional characteristic of the Fennoscandian Shield. During the 2023 experiment, technologically improved versions of field generating and measuring equipment and the new data processing methods were used. The earlier studies have identified the need for the modified measuring equipment with the frequency range expanded towards high frequencies, as well as for better synchronization between the source and receiver. Thus, to carry out the experiment, a new generator group and a new electronic unit combining functions of the control unit for the generator and the source output recorder, as well as a technique for synchronous processing of time series of current in the source and the electromagnetic field component at the observation point, were developed. The “Kovdor-2023” experiment was carried out using a new generator and a new measuring system, which made it possible to obtain additional information about the upper part of the object studied. Synchronous processing of new data was carried out, taking into account the materials and experience of the previous experiment, including static distortions and displacement currents. MTS and CSAMT data were used to construct a geoelectric section using the MARE2DEM program.
The work was supported by RSF foundation, grant N 22-17-00208.
Introduction
Electromagnetic prospecting of the Earth’s crust may involve a variety of methods aimed at solving global and engineering problems. The theoretical basis, measurement technologies, processing, and interpretation of data are constantly being perfected. Electromagnetic methods are used to study various structures, ranging from plain layered media and heterogeneities modelled by simple geometric shapes to complex asymmetric heterogeneous environment. The high resistivity and heterogeneity of the near-surface layers of crystalline shields, such as Fennoscandian, introduce specific requirements on electromagnetic research methods [1, 2].
Magnetotelluric sounding (MTS) is one of the most common methods of electromagnetic exploration of the Earth’s interior [3-5]. The main advantage of this method is that it does not require artificial source (generator) of electromagnetic field. The sources of the magnetotelluric field are natural processes in the ionosphere and magnetosphere, which have been thoroughly studied by now [6]. Principal faults of the MTS method are – signal distortions caused by inhomogeneities near the observation point, sensitivity to interference, especially near artificial sources of electromagnetic fields, such as power lines, and the indeterminacy of the natural sources [7]. Nevertheless, magnetotelluric soundings still find their application in such conditions [8].
The controlled-source audio-frequency magnetotelluric method (CSAMT) has proven effective in suppressing external noise, resulting in a relatively high signal-to-noise ratio [9-11]. Modern sources can generate a powerful signal over a wide frequency range [12], and measurement systems offer high resolution. This makes the method particularly effective for mineral and hydrocarbon exploration [13, 14], geothermal studies, detection of long and deep tunnels, and for solving groundwater contamination problems [15-17].
The development of MTS and CSAMT methods proceeded in parallel, with the former allowing data to be obtained from greater depths, and the latter from shallower layers of the subsurface. As technologies and data processing methods improved, it became possible to obtain information from the same depth range using both methods [17, 18]. Furthermore, the development of computing technologies made it possible to proceed from a one-dimensional to a two-dimensional approximation for both methods. The results of the both electromagnetic methods, however, are not always consistent with each other [18].
An intermediate conductive layer was discovered in 1997 in the Central Finland Granitoid Complex using frequency sounding [19]. It is located in the upper crust at depths of up to 10 km and has insignificant longitudinal conductivity, from fractions to units of siemens. The nature of the layer was interpreted within the framework of the dilatant-diffusion conductivity hypothesis (DD layer) [20]. According to this hypothesis, the direction of cracks in brittle rock changes from subvertical to subhorizontal under the action of tangential stresses. Ion-conducting fluids penetrate to depth from the daylight surface along this system of cracks. Dilatancy phenomena, i.e., irreversible loosening, arise due to brittle fracture of rocks under conditions of interaction of tangential and lithostatic pressures. This facilitates the emergence of free fluids in the opening cavities and increases the electrical conductivity of rocks within a fairly narrow depth range (from 2 to 10 km) in the form of an intermediate conductive layer. The DD layer is not a continuous, homogeneous region, but a heterogeneous zone of low resistivity caused by the influence of numerous small fractures. The layer is of interest mainly due to the possible presence of free fluids in the upper crust of the Earth at depths ranging from 2-3 to 7-10 km.
In 2015, sounding was conducted within the Kovdor-Yena segment of the Belomorian Block. The goal of the “Kovdor-2015” experiment was to study the parameters of the DD layer. The result was a series of one-dimensional geoelectric sections revealing an intermediate conductive layer at depths ranging from 2 to 10 km.
The study area is composed primarily of Archean granite-gneisses, amphibolites, and muscovite and apatite-magnetite ore zones of varying composition and structure [21].
The aim of this study is to investigate the deep electrical conductivity of the crust of the Belomorian block of the Fennoscandian Shield in the Kola Region. This research is a continuation of the 2015 experiment [1]. The objectives were, firstly, to improve the synchronization of the source and receiver, and secondly, to obtain information in the higher-frequency range. To address these objectives, new data acquisition systems were introduced and a new generator unit was built. This made it possible to increase the information value of the data obtained during the 2023 measurements and supplement the results of the “Kovdor-2015” experiment.
Archean rocks have high resistivity, up to 106 Ohm∙m. Zones of low resistivity may be associated with the concentration of ion-conducting fluids in zones of increased fracturing, as well as with fault zones containing electron-conducting sulfides and graphites.
Data from both experiments along a single profile were analyzed in a two-dimensional approximation using modern methods of data processing and inversion.
Measurement methodology
Measurements were conducted along the sublatitudinal profile of Kovdor – Polyarnye Zori at intervals of 12-15 km using a mutually orthogonal power supply setup in the form of L-shaped grounded lines (dipoles) 1.5-1.8 km long (Fig.1). Such measurements had been carried out at seven locations.
Compared to previous experiments, operational frequency range was expanded towards the high frequency. The effective depth of electromagnetic frequency methods (the depth from which the maximum contribution to the electromagnetic field response at the surface for a given frequency is determined) was estimated using the skin effect formula [10]:
where ρ is the resistivity of the underlying rock, Ohm·m; T is the period of electromagnetic field oscillations, s.
During the 2015 experiment, the upper boundary of the signal frequency was approximately 2000 Hz. This allowed signal acquisition from depths of a few kilometers. Increasing the signal frequency and decreasing the minimum survey depth required modification of the source and receiver.
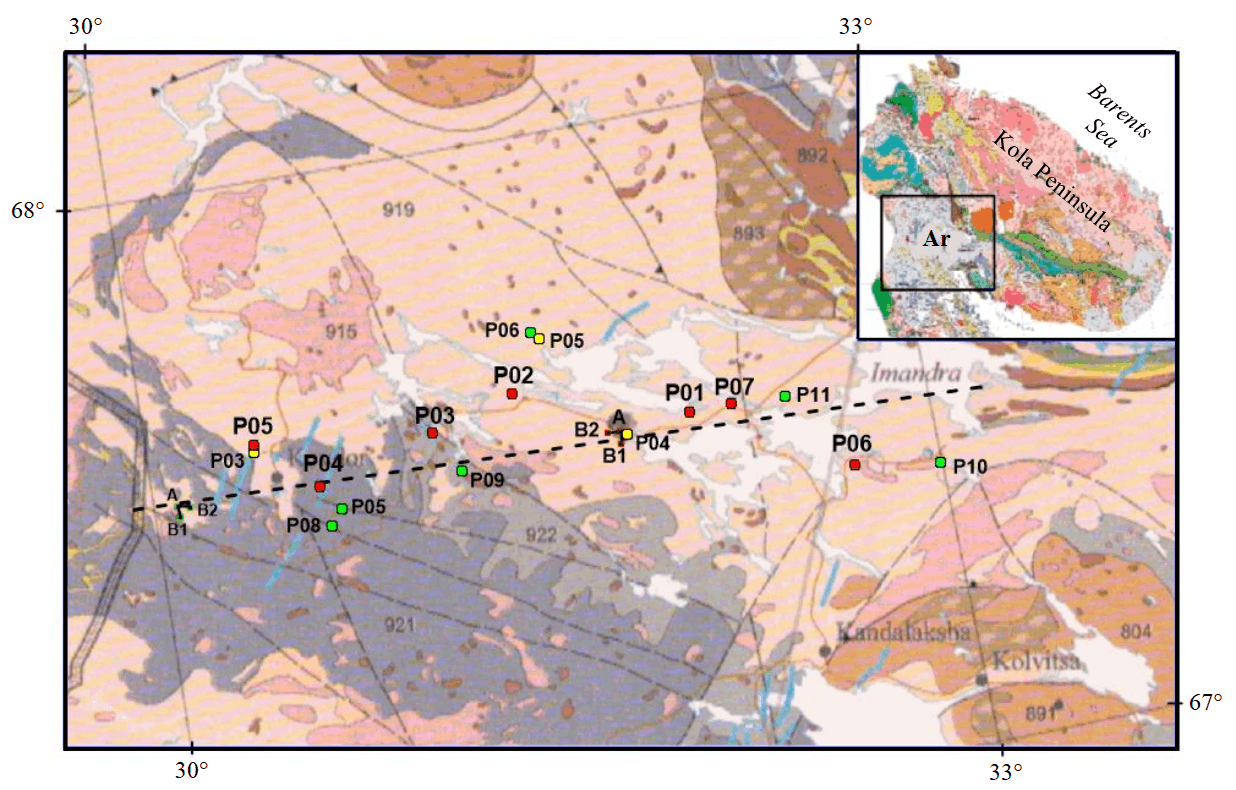
Fig.1. Layout of transmitter lines and observation points on the geological map of Fennoscandia [22]
Red dots are observation points in the “Kovdor-2023” experiment, green dots are observation points in the “Kovdor-2015” experiment, black lines are feeding lines, yellow dots are observation points of MTS 2016, dotted line – position of the Kovdor – Polyarnye Zori profile
Ar – Kovdor-Yena segment of the Belomorian Block, composed predominantly of Archean rocks
The electromagnetic field was generated by the “Energia-5” generator, which was developed for this experiment based on the “Energia-4” generator [12]. The generator’s power unit is a single-phase bridge inverter based on insulated-gate bipolar power transistors. This inverter uses three-level pulse-width modulation to generate arbitrary current waveforms in the frequency range of 0.001-2000 Hz, as well as a bipolar square-wave signals with variable pulse ratio in the frequency range of 0.07-10,000 Hz.
The “Energia-5” generator was mounted in the body of a KamAZ-43101 truck and was powered by an AZIMUT ED 100-T400-1RKM11 diesel generator with an output voltage of 380 V and a power output of 100 kW. The “Energia-4” generator was powered by a 29 kW alternator mounted in the body of a ZIL-131 truck and connected to the engine via a power take-off shaft.
The use of new transistors and a more advanced and powerful powertrain in the “Energia-5” generator allowed for an increase in the output signal amplitude, especially at high frequencies, resulting in an increase in the upper signal frequency from 2 kHz in 2015 to 4 kHz in 2023. This allowed for a reduction in the minimum exploration depth [1] by a factor of 1.4 (less than 1 km).
The generator's adjustable output current waveform ensured its versatility, allowing it to be used for various deep electromagnetic sounding methods. In particular, a sinusoidal waveform or square wave can be used for frequency sounding, while a modified square wave with variable duty cycle can be used for near-field sounding using the transient electromagnetic field method.
To ensure a higher radiating magnetic moment, the generator and dipoles must be installed in geological zones with high soil resistivity, which ensures greater depth for the dipole return current. On the other hand, this leads to difficulties in constructing grounding devices and a higher impedance for the source dipoles. The location of the transmitter lines in this experiment was chosen to ensure the lowest grounding resistance also taking into account the azimuth of the survey profile. In the “Kovdor-2015” experiment, two feeder layouts were deployed – in the eastern and western sectors of the study area (Fig.1). In 2023, a layout was almost identical to the eastern setup used in 2015.
Two measuring stations were used in the 2023 experiment: a broadband magnetotelluric VMTU-10 (fifth generation) and a KVVN-7 (fourth generation) [23], developed by staff from the Northern Energetics Research Centre KSC RAS and Polar Geophysical Institute KSC RAS. The VMTU-10 station has an internal GPS-synchronized logger operating in five-channel mode with a sampling frequency of up to 1000 Hz and up to 32 sensitivity bits. It also may be connected to an external logger. The KVVN-7 station records signals on seven channels via an external recorder and has notch filters for the first five odd harmonics of the 50 Hz industrial frequency.
The frequency range of the VMTU-10 station was insufficient to achieve the objectives of the “Kovdor-2023” experiment. The need to measure signals in the range of 1 Hz to 4 kHz required modifications to the signal recording system. To address this issue, measurements were performed using an external analog-to-digital converter (ADC) of the QMBox17-16 series. Using the QMBox ADC, the VMTU-10 station recorded signals at a frequency of 20 kHz. The KVVN-7 station and the “Energia-5” generator also used ADC data operating in the same mode. In the “Kovdor-2015” experiment were also used 14-bit AD converters without synchronization. Thus, in the 2023 experiment, compared to the 2015 experiment, it was possible to expand the range of studied frequencies to 10 kHz, increase the measurement accuracy from 14 to 16 bits, and synchronize GPS data with an accuracy of 0.00001 s.
The measured parameters were identic to those of magnetotelluric soundings, i.e. the horizontal electric and total magnetic fields. The electric components of the field were measured using mutually orthogonal grounded lines 200 m long. The magnetic field was measured using inductive sensors. The intrinsic noise of the magnetic sensors of the KVVN-7 [23] and VMTU-10 stations is 20-30 fT/Hz1/2 in the frequency range of 10-300 Hz, which is an order of magnitude lower than the noise of the natural field. Thanks to the rejector filters, the KVVN-7 station could record the signal under the conditions of high industrial interference (point P06). The VMTU-10 magnetic sensors have smooth amplitude and phase-frequency characteristics, therefore the measurements performed without interference (all points except P06) were of higher quality. The recording was carried out during the generator operation session, and variations in the natural field were also measured after the session to measure the MTS in the absence of a source signal.
Results
Since the measurements were identical to those of magnetotelluric studies, data processing was performed using both the MTS technique [24, 25] and the CSAMT technique [10, 26]. The task of processing data from the “Kovdor-2023” experiment was to obtain the values of the absolute vectors of the electric and magnetic fields and the value of the total impedance module.
The search for a useful CSAMT signal in the time series of measured electromagnetic field components was carried out automatically, synchronously with the processing of the time series of the source signal. This scheme was implemented to process data from a series of FENICS experiments [27]. Calculations of apparent resistivity and geometric coefficients were performed using the following formulas [10]:
- for electric field
- for magnetic field
where Ех – electric field strength along the axis х, V/m; Еу – electric field strength along the axis y, V/m; Нх – magnetic field strength along the axis x, A/m; Нy – magnetic field strength along the axis y, A/m; I – current amplitude, A; L – length of the source dipole, m; r – distance between source and receiver, m; θ – angle between the source axis and direction r, deg; f – signal frequency, Hz.
Calculation of apparent resistivity from impedance was carried out according to the following equations:
Data processing using the MTS technique was carried out using the VMTU-1d program, developed for processing and one-dimensional interpretation of data from the VMTU-10 station. It implements a standard procedure for processing magnetotelluric data, proposed by V.Yu.Semenov in 1985 [28]. The data measured through the QMBox ADC from the KVVN-7 and VMTU-10 stations was reformatted for processing in this program.
For each measured field component, averaged spectra and correlation relationships between conjugate and anti-conjugate components of the electromagnetic field are calculated. Then, based on the frequencies that satisfy the selection criteria, the response of the medium is determined Zxx, Zxy, Zyx, Zyy (components of the impedance tensor, Ohm) from the relations
Next, the apparent resistivity, impedance phase and asymmetry parameter were calculated [29]:
At each point, according to formulas (5), (6), we determined the directions of the main field components relative to the magnetic meridian and the values of the apparent resistivity ρxy, ρyx (Fig.2, a), impedance phases φxy, φyx (Fig.2, b) in the frequency range of ca. 1-300 Hz. In addition, formula (7) was used to compute parameter skew (Fig.2, c) defining the dimension of the lower half-space.
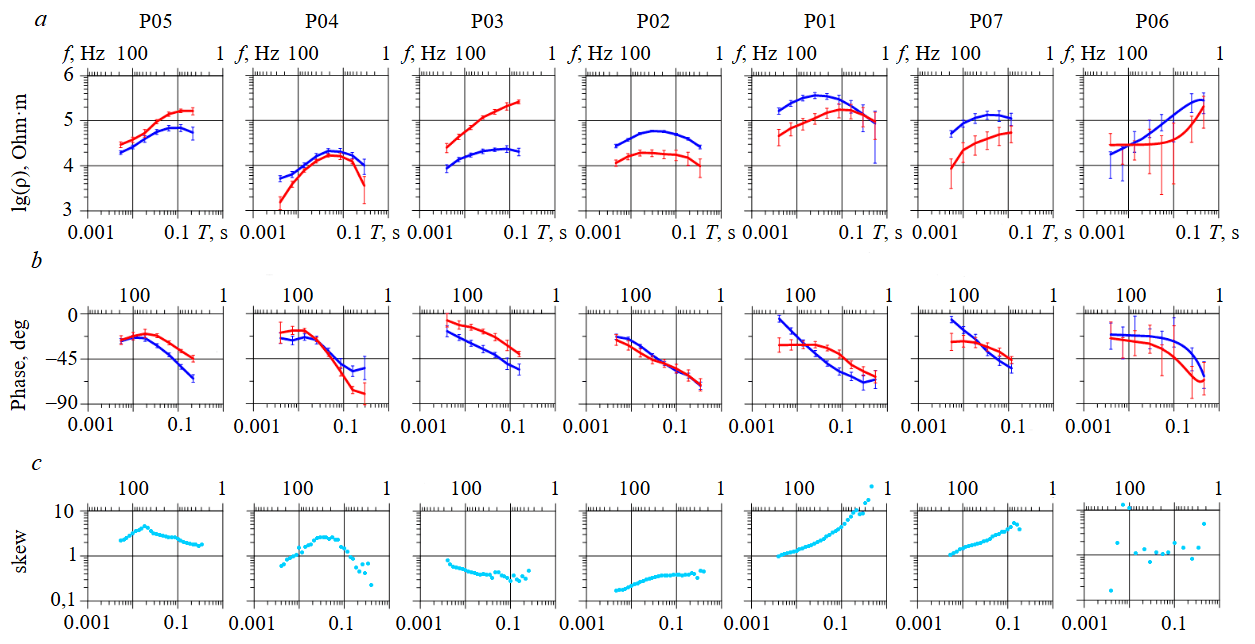
Fig.2. Results of MTS measurements on the Kovdor – Polyarnye Zori profile: a – apparent resistivity curves (blue – transverse, red – longitudinal); b – impedance phase curves (blue – transverse, red – longitudinal); c – asymmetry parameter skew
According to formula (1), the effective exploration depth for the study area varies from 1 to 40-60 km depending on the resistivity of the underlying space and the lower frequency of the useful signal.
Magnetotelluric soundings, in addition to the influence of regional inhomogeneities [30], are subject to static distortions caused by near-surface inhomogeneities, usually of low resistivity [31-33]. There are different ways to account for these distortions [34, 35]. This work uses the method proposed by A.A.Zhamaletdinov [36]. To account for static shear distortions, this method analyzes the apparent resistivity curves of frequency sounding with an artificial source (Fig.3).
Curves calculated from the magnetic component (3) are not affected by static distortions, but are influenced by the ionosphere and displacement currents in the high-frequency branch. The horizontal magnetic field is not subject to static distortion, since it has no galvanic connection with the ground and reflects the true resistivity of the upper layer of the Earth’s crust. Correction of distortions is carried out by parallel displacement of the electrical ρE and impedance ρZ curves along the resistivity axis until they coincide with the level of the ρH curve along the horizontal magnetic field within the action of the quasi-stationary wave zone [35].
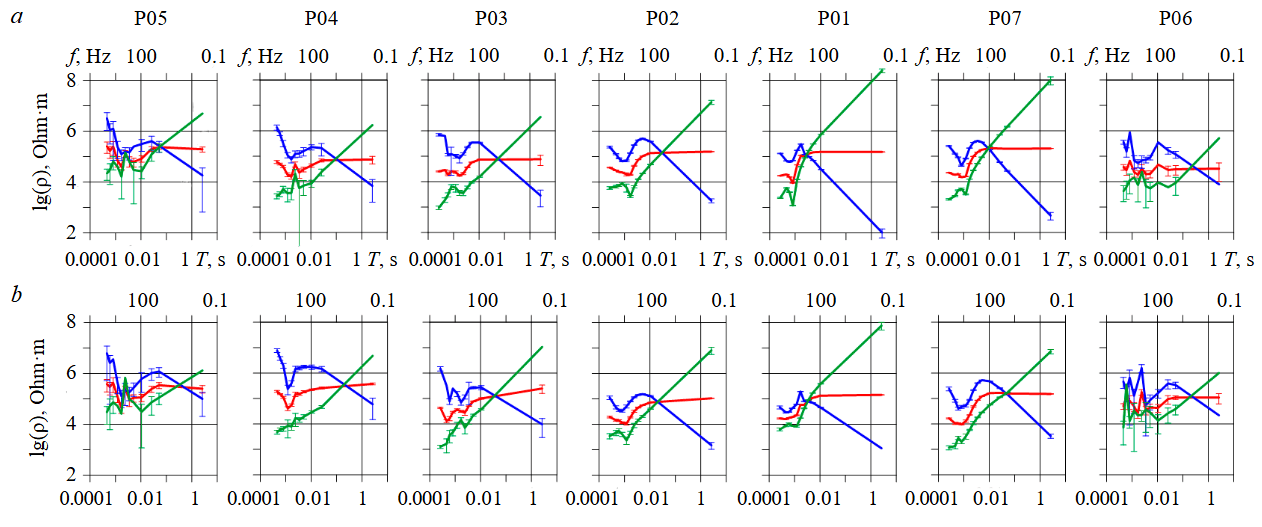
Fig.3. CSAMT apparent resistivity curves obtained along the Kovdor – Polyarnye Zori profile according to data from sources AB1 (a) and AB2 (b)
Blue lines – ρH, red lines – ρЕ, green lines – ρZ
When sounding with an artificial source, a transition to the near zone occurs at low frequencies when the wavelength becomes comparable to the distance between the source and the receiver. The transition from a quasi-stationary wave to the near zone can be approximately determined using the parameter kr, where k – wave number in quasi-stationary approximation, m–1, k = π/λ; λ – wavelength, m; r – distance between source and receiver, m.
The condition kr ≥ 1 is satisfied for the near zone, and for the far quasi-stationary zone – kr ≤ 1. Between them there is a frequency range of the intermediate zone [18].
The “magnetic” resistivity curve (3) in the near zone bears information about the deep distribution of electrical conductivity with decreasing frequency. The resistivity curve calculated from the electric field (2) becomes independent of frequency, and the resistivity curve calculated from the impedance (4), accordingly, increases with decreasing frequency. This discrepancy in the experimental curves in the low-frequency part at all measurement points can be seen in Fig.3.
To account for static distortion, we used the impedance curve of the apparent resistivity of frequency sounding, adjusted to the level of the “magnetic” curve in the quasi-stationary zone. For the intermediate and near zones, the low frequency portion of the apparent “magnetic” resistivity curve was used.
The wave quasi-stationary zone is observed in the frequency range from 100 to 500 Hz (Fig.3). At higher frequencies, the apparent resistivity curves calculated from the electric and magnetic fields are distorted due to the influence of displacement currents, and the impedance ρZ curves are not affected by the ionosphere and displacement currents.
Discussion
The main difference between the “Kovdor-2015” and “Kovdor-2023” experiments is that the observation points of the 2015 experiment were located in areas with a homogeneous, poorly conductive base to maximize the penetration of the field to depth and avoid the influence of lateral inhomogeneities, and the observation points of 2023 were located at approximately the same distance along the single profile (see Fig.1).
The results of “Kovdor-2023” provide information for constructing a two-dimensional model of the distribution of electrical conductivity of the Earth’s crust of the Belomorian Block along the Kovdor – Polyarnye Zori profile. The results of the “Kovdor-2015” experiment and additional MTS 2016 were also used.
The symmetry parameter skew is an indicator of the dimension of the medium [25, 26]. Parameter analysis shows that the measured data can only be partially approximated by a two-dimensional medium, but they can also be interpreted as two-dimensional [37].
Data inversion was carried out using the MARE2DEM software developed by K.Key (Lamont-Doherty Earth Observatory, Columbia University, USA) for two-dimensional inversion of both frequency soundings with an artificial source and magnetotelluric soundings [38]. The program was developed for seabed research, but can also be applied in shield conditions. MARE2DEM uses a polygonal model and a finite element method for solving a direct problem.
The data inversion procedure requires significant computational resources, so to solve the inverse problem it is necessary to carefully select the initial model. Figure 4 shows the result of the 14th iteration, where the a priori model is the averaged model obtained from the results of the “Kovdor-2015” experiment [1], in which an intermediate conducting layer is present.
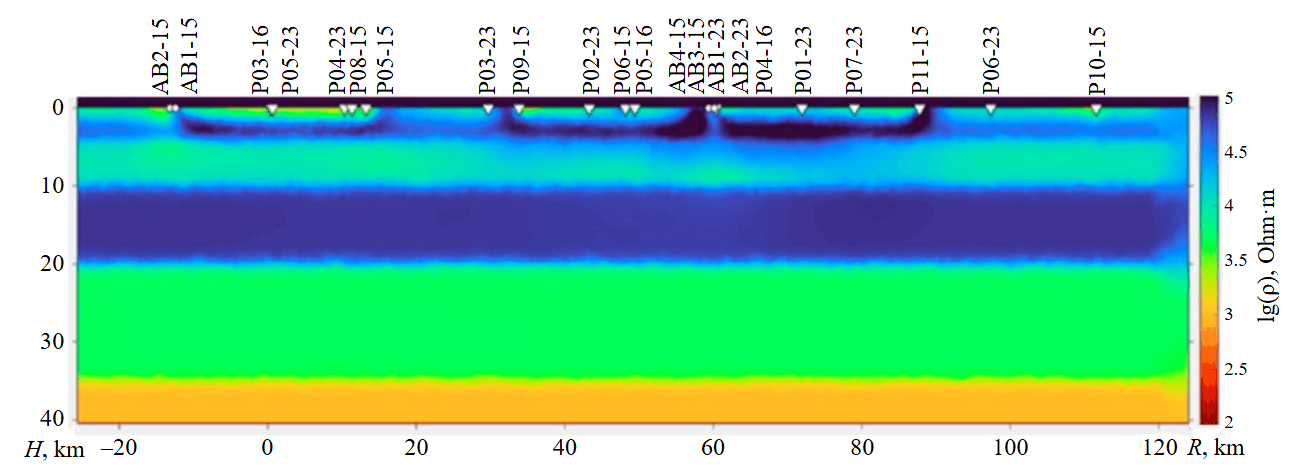
Fig.4. Geoelectric section along the Kovdor – Polyarnye Zori profile according to MTS and CSAMT data, obtained using the MARE2DEM program
The combination of CSAMT and MTS sounding methods with a new source-receiver system made it possible to obtain more detailed information for each measurement point. The new findings are generally consistent with previous studies in the area. By expanding the frequency range of both research methods, an additional information was obtained for the upper part of the section (1-3 km) at seven points, which makes it possible to identify heterogeneities near the surface, but does not greatly affect the deep part of the section.
The presence of near-surface inhomogeneities in electrical resistivity leads to static distortion of the measured data. The more information in the high-frequency region, the greater the opportunity to take this influence into account. According to the resulting model (Fig.4), at depths of up to 2-4 km, resistivity inhomogeneities are in a range of one order of magnitude (104-105 Ohm∙m), which generally corresponds to the rocks that make up this area. Magnetotelluric data (see Fig.2) also have a scatter of one order of magnitude from point to point.
The profile in relation to the source is conventionally divided into two areas, the western, composed mainly of Proterozoic rocks, and the eastern, composed of Archean rocks (see Fig.1). The regions differ not only in the age and composition of the rocks, but also in the predominant strike of the faults, sublatitudinal for the western region and submeridian for the eastern region. The difference between these parts is expressed in magnetotelluric data (see Fig.2), according to which the western part has a greater scatter of data from point to point.
New data confirms the presence of an intermediate conductive layer. In particular, a minimum observed in the region of a period of 0.001 s in all curves of the apparent resistivity of CSAMT (see Fig.3), can be interpreted in one-dimensional and two-dimensional approximations as an intermediate conducting layer. The presence of this layer is difficult to explain by the presence of electron-conducting zones in the study area [21]. In the section, such a zone is located at depth from 4 to 10 km, its resistivity varies from point to point, but in general is one or two orders of magnitude lower than the surrounding rocks. The nature of this layer is apparently explained by dilatant-diffusion phenomena in the upper, fragile part of the Earth’s crust [1, 20].
The resulting section depends on the a priori model; it has yet to be refined. To create a more correct initial model [38, 39], one should take into account data from other geophysical methods and additional information.
Conclusion
The “Kovdor-2023” experiment was carried out on electromagnetic sounding of the lithosphere of the Belomorian Block along the Kovdor – Polyarnye Zori profile to a depth of 40 km. Compared to the previous experiment [1], the measurement scheme was changed. Due to the new source and modification of the data recording system, sensitivity has been increased and the operating frequency range has been expanded. For the first time, a geoelectric section was obtained in this area of the Belomorian Block using two-dimensional data inversion. Inhomogeneities of electrical resistivity were distinguished in the upper part of the block.
The data obtained confirm the presence of a conductive zone at a depth of 4 to 10 km. This layer was discovered during previous studies; its nature is explained by the dilatation-diffusion phenomenon in the upper part of the Earth’s crust.
As a result of the “Kovdor-2023” experiment, a two-dimensional geoelectric section was obtained in the range of 0.1-40 km along the Kovdor – Polyarnye Zori profile. Unlike the 2015 experiment, in which a series of one-dimensional sections were obtained with the presence of an intermediate conductive layer at depths from 2 to 10 km [1], now the layer with variable electrical conductivity was established at the same depth along the entire profile.
References
- Zhamaletdinov A.A., Velikhov E.P., Shevtsov A.N. et al. The Kovdor-2015 Experiment: Study of the Parameters of a Conductive Layer of Dilatancy–Diffusion Nature (DD Layer) in the Archaean Crystalline Basement of the Baltic Shield. Doklady Earth Sciences. 2017. Vol. 474. Part 2, p. 641-645. DOI: 10.1134/S1028334X17060095
- Zhamaletdinov A.A., Velikhov E.P., Shevtsov A.N. et al. Deep Electrical Conductivity of the Archaean Blocks of Kola Peninsula in the Light of the Results of Murman-2018 Experiment: A Review. Izvestiya, Physics of the Solid Earth. 2021. Vol. 57. N 1, p. 61-83. DOI: 10.1134/S1069351321010110
- Sysoev B.K., Yagafarov A.K., Arsan Sh.A. et al. Features of magnetotelluric scanning of the Earth’s crust while searching and exploring hydrocarbon deposits. Oil and Gas Studies. 2019. N 5, p. 40-45 (in Russian). DOI: 10.31660/0445-0108-2019-5-40-45
- Berdichevsky M.N., Bubnov V., Aleksanova E. et al. Magnetotelluric Studies in Russia: Regional-Scale Surveys and Hydrocarbon Exploration. Electromagnetic Sounding of the Earth’s Interior. Theory, Modeling, Practice. Elsevier, 2015, p. 379-401. DOI: 10.1016/B978-0-444-63554-9.00013-1
- Palshin N.A., Aleksanova E.D., Yakovlev A.G. et al. Experience and prospects of magnetotelluric sounding applications in sedimentary basins. Geophysical Research. 2017. Vol. 18. N 2, p. 27-54 (in Russian). DOI: 10.21455/gr2017.2-2
- Garcia X., Jones A.G. Atmospheric sources for audio-magnetotelluric (AMT) sounding. Geophysics. 2002. Vol. 67. N 2, p. 448-458. DOI: 10.1190/1.1468604
- Ermolin E.Yu., Ingerov O., Yankilevich A.A., Pokrovskaya N.N. AMT soundings in the dead band within the Chukotka region (Russian Far East). Journal of Mining Institute. 2019. Vol. 236, p. 125-132. DOI: 10.31897/PMI.2019.2.125
- Hao Xu, Xiaodong Yang, Xiangyang Cai et al. Exploring geothermal resources with the CSAMT and microtremor methods: a case study in Tangquan, Jiangsu Province, China. Frontiers in Earth Science. 2024. Vol. 12. N 1437850. DOI: 10.3389/feart.2024.1437850
- Xian Zhang, Diquan Li, Jin Li et al. Magnetotelluric Signal-Noise Separation Using IE-LZC and MP. Entropy. 2019. Vol. 21. Iss. 12. N 1190. DOI: 10.3390/e21121190
- Younis A., El-Qady G., Abd Alla M. et al. AMT and CSAMT methods for hydrocarbon exploration at Nile Delta, Egypt. Arabian Journal of Geosciences. 2015. Vol. 8. Iss. 4, p. 1965-1975. DOI: 10.1007/s12517-014-1354-6
- Cao Yan-ling, Cheng Gang-jian, Zhao Cheng-liang et al. Application of CSAMT in hydrogeology exploration in Shandong Province – An example from geothermal exploration in Changdao County (south four islands). Journal of Groundwater Science and Engineering. 2018. Vol. 6. N 1, p. 58-64. DOI: 10.19637/j.cnki.2305-7068.2018.01.007
- Kolobov V.V., Barannik M.B., Ivonin V.V. et al. Experience of application of the “Energy-4” generator for DC and CSAMT electromagnetic soundings in the “Murman-2018” experiment. Transactions of the Kola Science Centre. Energy Technology. 2018. Vol. 9. N 8 (17), p. 7-20 (in Russian). DOI: 10.25702/KSC.2307-5252.2018.9.8.7-20
- Zhamaletdinov A.A., Shevtsov A.N., Kolobov V.V., Petrishchev M.S. Pilot electromagnetic soundings with the use of industrial power transmission line “Urengoy – Pangody” along with AMT-MT-Soundings. Journal of Mining Institute. 2015. Vol. 212, p. 101-112 (in Russian).
- Peng-liang Yu, Ting Qu, Ri-zheng He et al. Application of tensor CSAMT with high-power orthogonal signal sources in Jiama porphyry copper deposit, South Xizang. China Geology. 2023. Vol. 6. Iss. 1, p. 37-49. DOI: 10.31035/cg2021065
- Su Chao, Hou Yanwei, Wang Cheng, Li Dan. CSAMT phase correction and its application in detection of water-accumulating area of goaf in coal mine. Coal Geology & Exploration. 2019. Vol. 47. Iss. 6. N 28. DOI: 10.3969/j.issn.1001-1986.2019.06.027
- Zhu Yunqi, Li Diquan, Liu Zoiliang, Zhang Xin. Processing of coal mine CSAMT data with wide field electromagnetic method. Coal Geology & Exploration. 2023. Vol. 51. Iss. 4. N 15. DOI: 10.12363/issn.1001-1986.22.09.0676
- Chuantao Yu, Suoliang Chang, Yu Han et al. Characterization of Geological Structures Under Thick Quaternary Formations with CSAMT Method in Taiyuan City, Northern China. Journal of Environmental and Engineering Geophysics. 2019. Vol. 24. N 4, p. 621-628. DOI: 10.2113/JEEG24.4.621
- Kulikov V.A., Kaminskii A.E., Yakovlev A.G. Combined 2D inversion of electrotomographic and audio-magnetotellurgic sounding data to solve mining problems. Journal of Mining Institute. 2017. Vol. 223, p. 9-19. DOI: 10.18454/PMI.2017.1.9
- Zhamaletdinov A.A., Shevtsov A.N., Tokarev A.D. et al. Electromagnetic Induction on the Earth. 14-th Workshop in Sinaia (Romania). Mexico, 1998, p. 83.
- Zhamaletdinov A.A. On the Fluid Nature of Intermediate Conductive Layers in the Earth’s Crust: Evidence from Electromagnetic Sounding and Superdeep Well Logging. Izvestiya, Physics of the Solid Earth. 2011. Vol. 47. N 2, p. 127-137. DOI: 10.1134/S1069351311010137
- Miller Yu.V. Belomorian mobile belt of Baltic Shield. Regionalnaya geologiya i metallogeniya. 2006. N 27, p. 5-14.
- Geological map of the Fennoscandian Shield. Scale 1:2000000. Geological Surveys of Finland, Norway and Sweden and the North-West Department of Natural Resources of Russia, 2001.
- Kolobov V.V., Kuklin D.N., Shevtsov A.N., Zhamaletdinov A.A. The KVVN-7 Multifunction Digital Measuring Station for Electromagnetic Monitoring of Seismoactive Zones. Seismic Instruments. 2012. Vol. 48. N 1, p. 75-84. DOI: 10.3103/S0747923912010069
- Lilley F.E.M. The distortion tensor of magnetotellurics: a tutorial on some properties. Exploration Geophysics. 2016. Vol. 47. Iss. 2, p. 85-99. DOI: 10.1071/EG14093
- Berdichevsky M.N., Dmitriev V.I. Models and Methods of Magnetotellurics. Springer, 2008, p. 564. DOI: 10.1007/978-3-540-77814-1
- Tao Wang, Kun-Peng Wang, Han-Dong Tan. Forward modeling and inversion of tensor CSAMT in 3D anisotropic media. Applied Geophysics. 2017. Vol. 14. Iss. 4, p. 590-605. DOI: 10.1007/s11770-017-0644-7
- Hannibal A.E. Software for Processing Primary Data in the Fenics Experiment. Seismic Instruments. 2021. Vol. 57. N 3, p. 287-291. DOI: 10.3103/S074792392103004X
- Semenov V.Yu. Magnetotelluric Sounding Data Processing. Moscow: Nedra, 1985, p. 133.
- Gómez-Treviño E., Muñiz Y., Cuellar M., Calderón-Moctezuma A. Invariant TE and TM magnetotelluric impedances: application to the BC87 dataset. Earth, Planets and Space. 2018. Vol. 70. N 133. DOI: 10.1186/s40623-018-0900-y
- Ivanov P.V., Pushkarev P.Yu. Possibilities of Interpretation of the Magnetotelluric Data, Obtained on a Single Profile over 3D Resistivity Structures. Izvestiya, Physics of the Solid Earth. 2010. Vol. 46. N 9, p. 727-734. DOI: 10.1134/S1069351310090016
- Sukonkin M.A., Pushkarev P.Yu. Near-Surface distortions in magnetotelluric data on example of a graben. Voprosy teorii i praktiki geologicheskoi interpretatsii gravitatsionnykh, magnitnykh i elektricheskikh polei: Materialy 50-i yubileinoi sessii Mezhdunarodnogo seminara im. D.G.Uspenskogo – V.N.Strakhova, 29 yanvarya – 2 fevralya 2024, Moscow, Russia. Moscow: Pero, 2024, p. 324-328.
- Skorokhodov A.A., Zhamaletdinov A.A. Computer Modeling of Lateral Influence of the Ladoga Anomaly (Janisjarvy Fault Zone) on the AMT Sounding Results. Practical and Theoretical Aspects of Geological Interpretation of Gravitational, Magnetic and Electric Fields. Springer, 2019, p. 181-186. DOI: 10.1007/978-3-319-97670-9_21
- Feldman I.S., Ermolin E.Yu. Amplitude-phase correction of magnitotellurie impedance curves. Journal of Mining Institute. 2011. Vol. 194, p. 200-210 (in Russian).
- Ermolin E.Yu., Ingerov A.I., Shaaban K.M. Application of vertical magnetic component in magnetotelluric method to estimate parameters of anomalous objects away from the profile line. Journal of Mining Institute. 2015. Vol. 212, p. 95-100 (in Russian).
- Zhamaletdinov A.A. A Method for Quantifying Static Shift Distortions Using a Magnetic Field of Controlled Source (CSAMT). Seismic Instruments. 2020. Vol. 56. N 5, p. 555-563. DOI: 10.3103/S0747923920050138
- Shevtsov A.N. Joint Interpretation of Magnetotelluric and CSAMT Data on the Kola Peninsula (Kovdor Area). Practical and Theoretical Aspects of Geological Interpretation of Gravitational, Magnetic and Electric Fields. Springer, 2019, p. 23-30. DOI: 10.1007/978-3-319-97670-9_3
- Susilawati, Mustopa E.J. 2D Interpretation Of Controlled Source Audio Magnetotelluric (CSAMT) Data Integrated With Borehole Data In Kamojang Geothermal Field West Java, Indonesia. Journal of Physics: Conference Series. 2019. Vol. 1127. N 012021. DOI: 10.1088/1742-6596/1127/1/012021
- Key K. MARE2DEM: a 2-D inversion code for controlled-source electromagnetic and magnetotelluric data. Geophysical Journal International. 2016. Vol. 207. Iss. 1, p. 571-588. DOI: 10.1093/gji/ggw290
- Rung-Arunwan T., Siripunvaraporn W., Utada H. The effect of initial and prior models on phase tensor inversion of distorted magnetotelluric data. Earth, Planets and Space. 2022. Vol. 74. N 51. 2022. DOI: 10.1186/s40623-022-01611-8