


Physical modeling of saturation formation in the transition zone of a gas-water contact under the elastic-water drive during underground gas storage in low-permeability reservoirs operation
- 1 — Postgraduate Student Ufa State Petroleum Technological University ▪ Orcid
- 2 — Ph.D. Associate Professor Ufa State Petroleum Technological University ▪ Orcid
- 3 — Ph.D., Dr.Sci. Professor Ufa State Petroleum Technological University ▪ Orcid ▪ Scopus ▪ ResearcherID
Abstract
The growth of gas consumption associated with the Russian regions gasification requires the construction of new underground gas storages (UGS) and increase existing gas storages capacity. The creation of new underground gas storages and the expansion of existing ones involve expensive investments. The most significant items of expenditure are the costs of cushion gas injection, which is necessary to maintain reservoir pressure and UGS capacity during gas extraction period. The gas provides a “dry” region within the location of production wells and forms a transition zone at the gas-water contact under the elastic-water drive. The size of the transition zone in the area of the gas-water contact and the irreducible cushion gas volume required for its formation depend on the type of reservoir and its filtration and capacity properties. During modeling reservoir processes in cycles of gas injection and gas extraction from UGS, gas and water filtration is characterized by hysteresis of relative phase permeability (RPP) dependencies. There is also a shift for relative permeability curves when creating UGS. It has been observed in filtration processes (injection or extraction of gas) of the same flow direction. The paper presents the results of laboratory experiments on filtration modeling of counter-directional filtration flows of gas and water in a carbonate reservoir with an active aquifer in order to determine the number of cycles required to stabilize the position of the relative permeability curves and the points of residual gas and water saturation when modeling injection and production gas from UGS.
None
Introduction
The majority of underground gas storages (UGS) in Russia and around the world, created in porous permeable formations, operate under an elastic-water drive. The presence of active water in the reservoir leads to a cyclic movement of the gas-water contact (GWC) during the periods of gas extraction and injection [1, 2]. A gas-saturated area and a transition zone at the gas-water contact are formed in the first cycles, when creating or expanding the capacity of existing UGS facilities. The size and distribution of gas and water saturation within the transition zone will stabilize during cyclic storage operation [3].
The shape and dimensions of the gas-water contact transition zone are influenced by the technological parameters of gas injection and extraction, the reservoir geometry, the reservoir porous media structure, the distribution of filtration and capacitance parameters, the activity of reservoir waters, and other factors [4-6].
The direction of two-phase gas and water flow changes periodically in the transition zone of the GWC during injection and extraction gas in the processes of creation and cyclic operation of UGS. It leads to a change in phase permeability, which is called relative permeability hysteresis. Early research in this field is presented in the works [7-9].
A shift in the curves of the relative permeability is also observed during the implementation of water-alternating-gas (WAG) injection [10-12]. A decrease in gas phase permeability during WAG occurs due to an increase in residual gas saturation (i.e. an increase volume of trapped gas) [13, 14]. This phenomenon helps to align the pickup profile of injection wells in heterogeneous formations and increase the coverage coefficient of the oil reservoir by flooding [15, 16].
The questions of shifting the curves of relative phase permeabilities during fluid filtration are also studied in relation to UGS, where, depending on the period of operation, the gas-water front can move either towards the well location area or away from it. Physical modeling of cyclic operation of UGS with the influence of active aquifer is carried out on horizontal core models. There is a decrease in the gas-saturated pore volume and an increase in the size of the transition zone of the GWC, which in some cases can stabilize after 8-10 cycles. The processes which occur in reciprocating motion of the gas and water depend on the structure of the pore medium and the distribution of the phases in areas of stable viscous and capillary displacement [17-19]. One of the factors influencing the change in the gas saturation of the model is the presence of the relative permeability hysteresis. It was shown in [20-22] works that the stabilization of the relative permeability occurs from three to five injection cycles.
As opposed to the mentioned works, in [23] the physical modeling of cyclic gas injection and extraction processes was carried out on volumetric models, where core models were placed in parallel core holders. The results of the experiments on the relative permeability shift were used to construct a three-dimensional hydrodynamic model for further investigation of the transition zone of the GWC. The importance of taking into account the hysteresis effect is presented in [24, 25]. The hydrodynamic model with hysteresis effect showed better convergence with the historical data of a real gas storage facility [24].
In the [26] work physical experiments were carried out on sandstone (permeability 65 mD, length 60 cm) under two scenarios of initial water saturation – 18 and 100 %. The dependence of relative permeability changing in the simulation of cyclic injection on the initial state (drainage or imbibition) has been established.
The experience in studying the permeability hysteresis effect became the basis for the development of mathematical models to describe changes in filtration properties depending on the conditions of imbibition and drainage during fluid filtration. Carlson and Killough hysteresis models are widely used in hydrodynamic simulators [27, 28].
The analysis of published papers in the field of physical modeling has shown the importance of taking into account the permeability hysteresis effect in cyclic processes of water and gas filtration during the operation of UGS. This paper presents the results of physical experiments to study the formation of a transition zone at a GWC in a core model of a carbonate reservoir with an active aquifer to determine the number of cycles of gas injection and extraction necessary to stabilize residual gas saturation and relative permeability. Two options for modeling the creation of UGS with different initial saturation conditions are considered – in a depleted gas reservoir and in an aquifer.
Methods
Physical properties and determination of the pore medium structure of core samples
Information about the physical properties of the formation and their dependencies is obtained in the laboratory experiments [29, 30]. The experiments were performed on core samples from the carbonate reservoir. Sample preparation was carried out according to industry standard OST 39-195-86. It consists of extraction from hydrocarbons, desalinization of pore medium by distilled water, and drying to a constant mass in a drying oven. Porosity and gas permeability were determined on a gas permeameter/ porosimeter PIK-PP (Geologika JSC, Russia).
The results of the determination of core physical properties are presented in Table 1. The average permeability of a model consisting of six cores is defined as the harmonic mean along its length.
Table 1
Results of determination of core samples physical properties
|
Sample |
d, cm |
l, cm |
Vpore, cm3 |
k, mD gas permeability with the Klinkenberg correction |
kav, mD |
|
Core 1 |
2.98 |
4.02 |
4.265 |
26.463 |
20.5 |
|
Core 2 |
2.99 |
3.99 |
5.056 |
23.244 |
|
|
Core 3 |
2.99 |
3.97 |
4.424 |
21.295 |
|
|
Core 4 |
2.99 |
3.96 |
3.502 |
19.25 |
|
|
Core 5 |
2.98 |
4.00 |
3.924 |
19.062 |
|
|
Core 6 |
2.99 |
3.91 |
4.305 |
16.337 |
|
|
Sum |
– |
23.85 |
25.48 |
– |
– |
The methodology of the physical modelling
Figure 1 shows principal schematics of experimental equipment. Piston tanks E1 and E2 were filled with fluids filtered water and gas, respectively. Reservoir pressure conditions were created using high-pressure pumps, and temperature conditions were created using heating elements. A NaCl solution with mineralization 150 g/l was used as a model of reservoir water. Nitrogen was used as the injected gas.
The composite core model (six samples in the row) was placed in the core holder CH in the order shown in Fig.1. Water injection was carried out in the forward direction from core 1 to core 6 (blue lines), gas filtration – in the opposite direction – from core 6 to core 1 (green lines). Two-way valves K1-K7 were used to regulate the flow direction. A high-pressure separator C with a video camera is installed at the outlet of the CH, which makes it possible to measure the volumes of the phases flow out from the CH. A back pressure regulator BPR is installed behind the separator. The pressure drop during fluid injection was measured by a differential pressure gauge DM.
The first experiment was performed on core samples at 100 % initial water saturation. The water permeability of the composite model was 16.4 mD, which is slightly less than the gas permeability of 20.5 mD. The decrease in rock water permeability compared to gas permeability can be explained by the formation of polymolecular adsorption on the solid surface, which reduce the cross-section of pore channels [31, 32].
The second experiment was performed on core samples with 30 % residual water content and began with gas injection and determination of gas permeability in bound water.
The reservoir conditions in both experiments were the same – temperature 23 °С, formation pressure 7 МPa, effective pressure 4 MPa. The core samples inside the CH for the two experiments were installed in the same sequence.
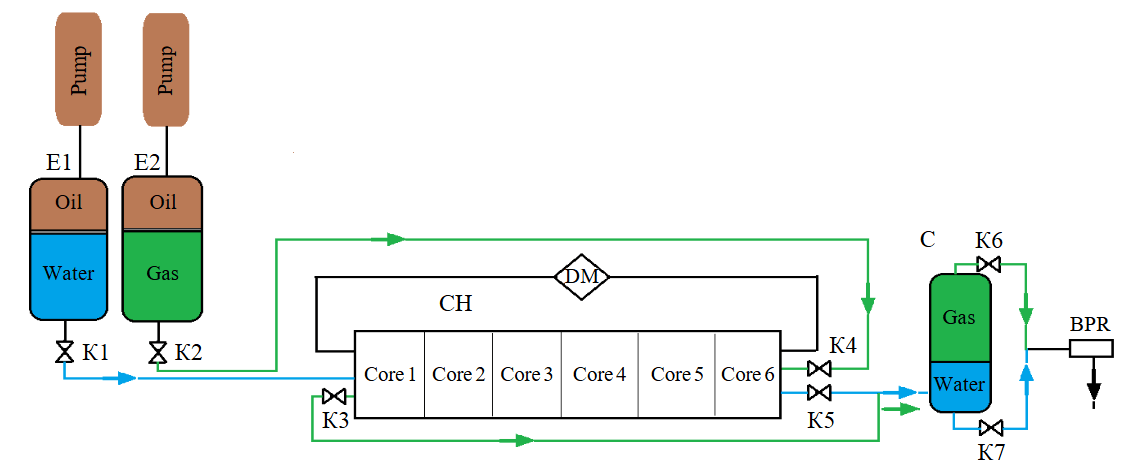
Fig.1. Principal schematics of experimental equipment
Water injection through the core model was carried out in a forward direction with a constant flow rate 0.02 ml/min, which corresponds to the speed of movement ≈ 0.16⋅10–4 m/s, defined by the formula
where Q – flow rate, m3/s; m – average porosity of the core model, f.u.; S – cross-sectional area of the core model, m2; α1 – gas saturation by the end of the gas injection cycle in the core model, f.u.; α2 – gas saturation by the end of the water injection cycle in the core model, f.u.
The chosen velocity of water movement corresponds to the velocity of water movement through the reservoir in the UGS with the 6° angle of inclination of the reservoir when the gas – water contact is moved by ~ 20 m in the projection onto the vertical axis during the gas extraction cycle. The volume of displaced gas was measured in the separator to record the water saturation change of the core model.
Gas injection into the core model was carried out at a flow rate of 0.02 ml/min with a subsequent increase to 0.4 ml/min after the gas breakthrough and a sharp decrease in the pressure drop. To measure the change in the water saturation of the core model, the volume of displaced water was measured in the separator С.
The water saturation was also determined by the dependence of the model water saturation on the electrical resistivity according to the Archie formula. The one cycle consisted of injecting water and then injecting gas in the opposite direction. Water or gas injection into the composite core model was carried out until the pressure drop and electrical resistance were stabilized. At the same time, water was pumped in a volume of at least three pore volumes of the model (3Vpore). It had to inject in the model up to twelve (12Vpore) pore volume of gas to stabilize the flow parameters.
During the experiment, the dynamics of the following parameters were recorded: the pressure drop on the differential pressure gauge, the electrical resistivity of the core model, the volume of fluid displaced into the separator, and the volume of fluid injected.
Discussion of results
To analyze the pore structure of the core samples, the results of porous disk method were used, and the results were processed according to the methodology described in the work [33]. Based on the analysis of the size distribution of pore channels and their participation in fluid flow, it was found that most of the void space is represented by pores with dimensions 0.27-3.57 µm. This size of the pore channels characterizes a microporous structure in which fluid movement occurs with significant participation of capillary forces.
Results of physical modelling
During the first experiment, nine cycles of gas and water injection through the core model were carried out. Based on the results of the injections, the dependences of the relative phase permeability of gas and water on the current water saturation are obtained for each cycle. The calculation of the relative phase permeability was carried out using the Toth method for the non-stationary method [34]. The gas relative permeability was based on the results obtained at the stage of gas injection, and water relative permeability – at the stage of water injection. Figure 2 shows relative phase permeability of the gas – water system for the first, second, third and ninth cycles of injecting. The dependencies for cycles 4-8 are not presented, as they may complicate the perception of the overall trend pattern of the offset of relative permeability shift position when adjacent lines overlap each other.
Relative phase permeability is often approximated in hydrodynamic simulators by using the mathematical Corey model [35-37] that is a power-law dependence of phase permeability on water saturation. The configuration of this model is carried out using empirical parameters that affect the forms of relative permeability. Table 2 shows the initial data for the construction of relative permeability shown in Fig.2.
Table 2
Data for setting up the Corey correlation of the first experiment
|
Parameter |
Cycle 1 |
Cycle 2 |
Cycle 3 |
Cycle 9 |
|
Minimum water saturation Swl |
0.630 |
0.614 |
0.612 |
0.543 |
|
Maximum water saturation Swu |
0.779 |
0.779 |
0.741 |
0.6917 |
|
Critical water saturation Swcr |
0.630 |
0.614 |
0.656 |
0.573 |
|
Critical gas saturation Sgcr |
0.230 |
0.230 |
0.280 |
0.360 |
|
Gas phase permeability krgu at S = Swu |
0.086 |
0.091 |
0.077 |
0.081 |
|
Water phase permeability krwu at S = Swu |
0.142 |
0.132 |
0.117 |
0.088 |
|
Exponent indicator ng for gas relative phase permeability krg |
2 |
1.5 |
3.5 |
1.5 |
|
Exponent indicator nw for water relative phase permeability krw |
3.5 |
5.5 |
2 |
5.5 |
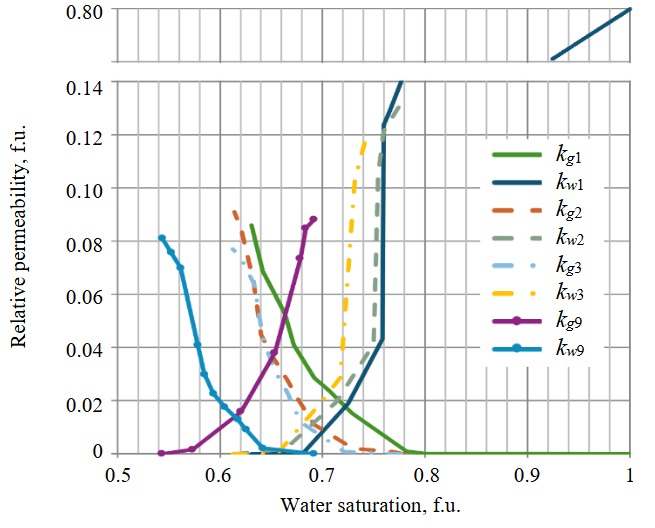
Fig.2. Relative permeability shift of the first experiment
kg1, kg2, kg3, kg9 – gas relative permeability; kw1, kw2, kw3, kw9 – water relative permeability at the end of cycles 1, 2, 3, 9
Figure 3 shows the change of the endpoints of the gas and water relative permeability in cycles 1-9 of the first experiment.
Figure 4 shows the changes in water saturation values by the end of the gas and water injection cycles.
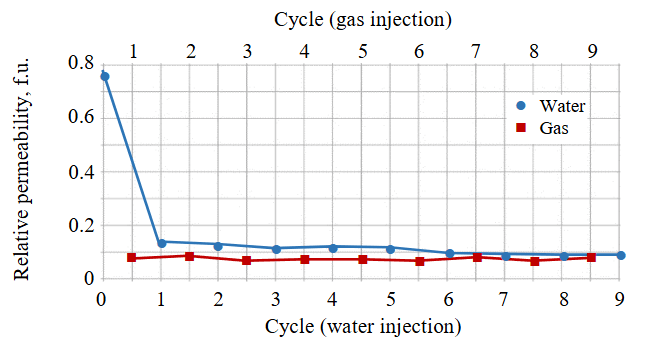
Fig.3. Relative permeability endpoints change for experiment of 100 % initial water saturation
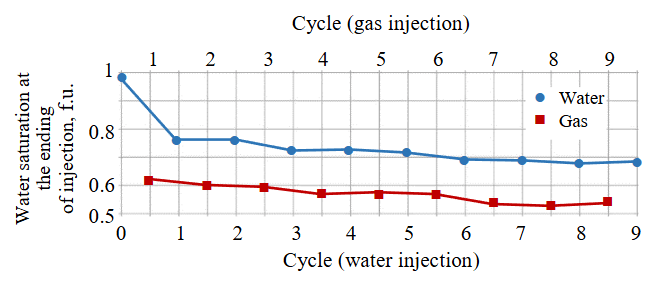
Fig.4. Water saturation change at the end of water/gas injection cycle for experiment of 100 % initial water saturation
According to the results of the first experiment, the relative phase permeability curves shift was established. The relative permeability for water reaches stabilization by the eighth cycle of water injection at the 0.08 f.u. (Fig.3). The point of the zero cycle of water injection characterizes the relative phase permeability in water at 100 % water saturation. At the same time, the relative permeability for gas decreased slightly and settled at the level of 0.08-0.09 f.u. During eight cycles of variable gas and water injection, the gas-saturated pore volume of the model increases and the relative permeability and their saturation endpoints shift due to the trapping of gas bubbles. This trapping occurs due to a change in the cross-section of the conductive capillaries in the wetting collector (a manifestation of the Jamin effect [38]). Saturation stabilization occurs after the eighth cycle and is set at 70 and 53 % water saturation at the end of the water and gas injection stage, respectively.
In the second experiment, for a model with an initial 30 % water saturation the dependence of the relative permeability in cyclic injection processes was also obtained. In Fig.5 the dependences of the relative permeability for gas and water are presented in cycles of alternating injection of water and gas. Four injection cycles were performed. At the first stage, gas was injected and the relative permeability was shown for gas at the initial water saturation (gas injection 1 cycle) (Fig.6).
Table 3 shows the initial data for the construction of the relative permeability, presented in Fig.5.
Table 3
Data for setting up the Corey correlation of the second experiment
|
Parameter |
Cycle 1 |
Cycle 2 |
Cycle 4 |
|
Swl |
0.298 |
0.420 |
0.423 |
|
Swu |
0.578 |
0.545 |
0.543 |
|
Swcr |
0.349 |
0.470 |
0.473 |
|
Sgcr |
0.474 |
0.505 |
0.497 |
|
krgu |
0.070 |
0.062 |
0.071 |
|
krwu |
0.061 |
0.032 |
0.029 |
|
ng |
1.3 |
1.8 |
1.8 |
|
nw |
8 |
4 |
4 |
It can be seen from Fig.5 that the relative permeability curves shift during the experiment on a model with an initial 30 % water saturation is directed towards the zone of increased water saturation after the first gas/water injection cycle. The discrepancy between the results obtained after the second and fourth cycles is insignificant.
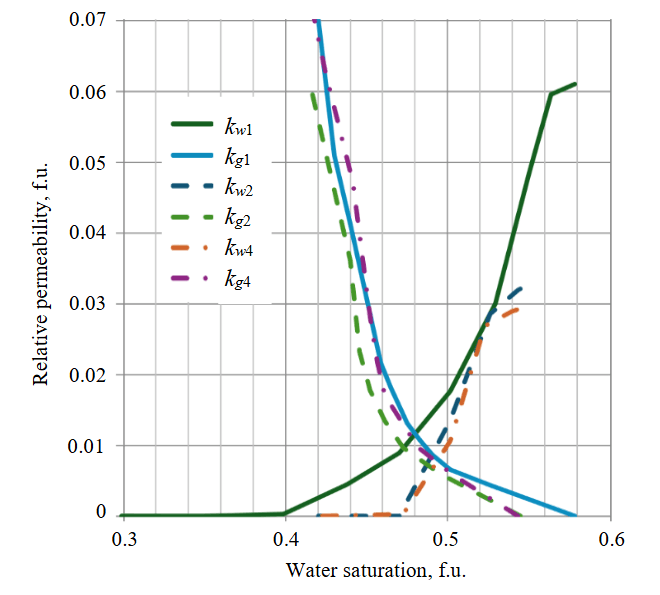
Fig.5. Relative permeability curves for experiment of 30 % initial water saturation
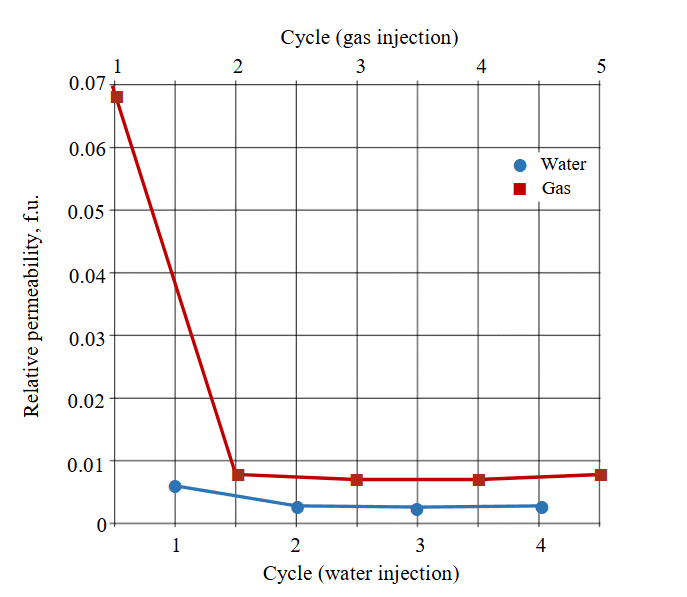
Fig.6. Relative permeability endpoints change for experiment of 30 % initial water saturation
It can be seen from Fig.6 that the hysteresis of phase permeability in water was observed only after one cycle of water injection. Further cyclic injection of water and gas does not lead to a decrease in the water relative permeability. After stabilization, the water relative permeability was set at 0.03 f.u., which is 2.7 times lower than in the previous experiment (Fig.3). The decrease in gas phase permeability between 1 and 2 cycles (gas injection) is due to a decrease in the gas-saturated pore volume and an increase in water saturation after the first water injection cycle. There was no further decrease in the gas relative permeability as in the previous experiment. The gas relative permeability in this experiment is comparable with previous experiment (Fig.3).
In this experiment, there is a decrease in water saturation to 58 % at the end of the water injection stage in cycles 1 and 2 and its stabilization in cycles 2-4 at the level of 54-55 %. The water saturation at the end of the gas injection stage also stabilized after a single cycle at 41 %.
Conclusion
The paper describes two experiments on a composite core model of a carbonate reservoir with a permeability of 20.5 mD for cyclic counter-directional gas and water injection with different initial conditions (at 100 and 30 % initial water saturation), simulating the movement of a gas-water contact during the periods of gas injection and extraction during the operation of UGS. According to the results of experiments the following was established:
- For a reservoir zone with 100 % initial water saturation (when creating a gas storage in a water-bearing reservoir or for a zone below the initial location of a GWC in a depleted gas reservoir), stabilizations of saturations and relative phase permeability during the operation of an UGS may take about eight cycles of gas injection/extraction.
- For the gas-saturated zone of the reservoir, which is characterized by 30 % residual water saturation, stabilization of parameters during cyclic operation of UGS occurs after two injection/extraction cycles.
References
- Ermolaev A.I., Efimov S.I., Kharitonov I.P. Assessment of the Methods Application Extent for Wells Stimulation at Underground Gas Storage. Science & Technology in the Gas Industry. 2021. N 3 (87), p. 73-79 (in Russian).
- Ponomarev A.I., Vladimirov I.V., Kalinovskiy Yu.V. et al. Analytical substantiation of aquifer parameters at adjustment of a digital model simulating underground gas storages in depleted gas-condensate fields. Vesti gazovoy nauki. 2018. N 1 (33), p. 203-206 (in Russian).
- Engibaryan M.A., Povarov D.A. Increase of operating efficiency of underground gas storages, created in porous formations with active water drive system, as a part of Unified Gas Supply System. Gas Industry. 2018. N 6 (769), p. 72-77 (in Russian).
- Gaysin A.R., Shayahmetov A.I., Ponomarev A.I. et al. Features of the Formation of a Gas-Saturated Area During the Creation of an Underground Gas Storage in a Depleted Gas Reservoir in a Fractured-Pore Type Reservoir with an Active Aquifer. Georesursy. 2024. Vol. 26. N 1, p. 136-144 (in Russian). DOI: 10.18599/grs.2024.1.12
- Zhengru Yang, Shabani M., Solano N. et al. Experimental determination of gas-water relative permeability for ultra-low-permeability reservoirs using crushed-rock samples: Implications for drill cuttings characterization. Fuel. 2023. Vol. 347. N 128331. DOI: 10.1016/j.fuel.2023.128331
- Gasumov R.A., Gasumov E.R., Minchenko Yu.S. Features of the underground storages construction in depleted oil and gas condensate fields. Journal of Mining Institute. 2020. Vol. 244, p. 418-427. DOI: 10.31897/PMI.2020.4.4
- Hamid M.A., Musa T.A., Elbaloula H.A.A. et al. Fitting Relative Permeability’s Curves Based on Laboratory Production Data for A Thermal Composite Core Flooding Experiment. Journal of Petroleum Engineering & Technology. 2019. Vol. 9. Iss. 3, p. 41-56. DOI: 10.37591/jopet.v9i3.3426
- Lysyy M., Fernø M.A., Ersland G. Effect of relative permeability hysteresis on reservoir simulation of underground hydrogen storage in an offshore aquifer. Journal of Energy Storage. 2023. Vol. 64. N 107229. DOI: 10.1016/j.est.2023.107229
- Rezaei A., Hassanpouryouzband A., Molnar I. et al. Relative Permeability of Hydrogen and Aqueous Brines in Sandstones and Carbonates at Reservoir Conditions. Geophysical Research Letters. 2022. Vol. 49. Iss. 12. DOI: 10.1029/2022GL099433
- Afzali S., Ghamartale A., Rezaei N., Zendehboudi S. Mathematical modeling and simulation of water-alternating-gas (WAG) process by incorporating capillary pressure and hysteresis effects. Fuel. 2020. Vol. 263. N 116362. DOI: 10.1016/j.fuel.2019.116362
- Ganguly E., Misra S. Spatiotemporal Variations in the Connectivity of Wetting and Nonwetting Phases during Water Alternating Gas Injection. Energy & Fuels. 2021. Vol. 35. Iss. 2, p. 1129-1142. DOI: 10.1021/acs.energyfuels.0c03170
- Drozdov N.A. Filtration studies on cores and sand packed tubes from the Urengoy field for determining the efficiency of simultaneous water and gas injection on formation when extracting condensate from low-pressure reservoirs and oil from oil rims. Journal of Mining Institute. 2022. Vol. 257, p. 783-794. DOI: 10.31897/PMI.2022.71
- Zhenkai Bo, Boon M., Hajibeygi H., Hurter S. Impact of experimentally measured relative permeability hysteresis on reservoir-scale performance of underground hydrogen storage (UHS). International Journal of Hydrogen Energy. 2023. Vol. 48. Iss. 36, p. 13527-13542. DOI: 10.1016/j.ijhydene.2022.12.270
- Fatemi M., Shahrokhi O., Sohrabi M. et al. Experimental Investigation of Oil Recovery from Carbonate Reservoir Rocks Under Oil-Wet Condition: Waterflood, Gas Injection, SWAG and WAG Injections. Abu Dhabi International Petroleum Exhibition and Conference, 9-12 November 2015, Abu Dhabi, UAE, OnePetro, 2015. N SPE-177641-MS. DOI: 10.2118/177641-MS
- Afzali S., Rezaei N., Zendehboudi S. A comprehensive review on Enhanced Oil Recovery by Water Alternating Gas (WAG) injection. Fuel. 2018. Vol. 227, p. 218-246. DOI: 10.1016/j.fuel.2018.04.015
- Higgs S., Ying Da Wang, Chenhao Sun et al. Direct measurement of hydrogen relative permeability hysteresis for underground hydrogen storage. International Journal of Hydrogen Energy. 2024. Vol. 50. Part D, p. 524-541. DOI: 10.1016/j.ijhydene.2023.07.270
- Sheng Peng. Gas-water relative permeability of unconventional reservoir rocks: Hysteresis and influence on production after shut-in. Journal of Natural Gas Science and Engineering. 2020. Vol. 82. N 103511. DOI: 10.1016/j.jngse.2020.103511
- Keumarsi M.M., Mollaei R., Fatemi M. Microfluidics simulations of the importance of micro porosity on the dynamic wettability alteration of the porous media: Effects of wettability alteration scenario, mixed-wettability, flow rate and oil viscosity. Geoenergy Science and Engineering. 2025. Vol. 254. N 214034. DOI: 10.1016/j.geoen.2025.214034
- Mikhaylovskiy A.A. Application of simplified gas-hydrodynamic proxy models for real-time technological calculations aimed at gas fields and underground gas storages. Vesti gazovoy nauki. 2018. N 1 (33), p. 193-202 (in Russian).
- Zolotukhin A.B., Yazynina I.V., Shelyago E.V. Relative permeability hysteresis for oil-water system in hydrophilic rocks. Oil Industry. 2016. N 3, p. 78-80 (in Russian).
- Sinan Zhu, Junchang Sun, Guoqi Wei et al. Numerical simulation-based correction of relative permeability hysteresis in water-invaded underground gas storage during multi-cycle injection and production. Petroleum Exploration and Development. 2021. Vol. 48. Iss. 1, p. 190-200. DOI: 10.1016/S1876-3804(21)60015-0
- Troitskiy V.M., Grigoryev B.A., Rassokhin S.G. et al. Physical modelling of gas cycling during development and operation of an underground gas storage. Hysteresis of phase permeability. Vesti gazovoy nauki. 2019. N 1 (38), p. 18-28 (in Russian).
- Jinkai Wang, Jialin Fu, Jun Xie, Jieming Wang. Quantitative characterisation of gas loss and numerical simulations of underground gas storage based on gas displacement experiments performed with systems of small-core devices connected in series. Journal of Natural Gas Science and Engineering. 2020. Vol. 81. N 103495. DOI: 10.1016/j.jngse.2020.103495
- Jinkai Wang, Xiaoyong Feng, Qiqi Wanyan et al. Hysteresis effect of three-phase fluids in the high-intensity injection–production process of sandstone underground gas storages. Energy. 2022. Vol. 242. N 123058. DOI: 10.1016/j.energy.2021.123058
- Ghanizadeh A., Chengyao Song, Clarkson C.R., Younis A. Relative permeability of tight hydrocarbon systems: An experimental study. Fuel. 2021. Vol. 294. N 119487. DOI: 10.1016/j.fuel.2020.119487
- Fatemi S.M., Sohrabi M. Relative permeabilities hysteresis for oil/water, gas/water and gas/oil systems in mixed-wet rocks. Journal of Petroleum Science and Engineering. 2018. Vol. 161, p. 559-581. DOI: 10.1016/j.petrol.2017.11.014
- Krasovskiy A.V., Golofast S.L., Raudanen E.V. The Effect of Dynamic Permeability the Decrease of the Drained Gas Reserves Cenomanian Deposits. SOCAR Proceedings. 2016. N 4, p. 48-54 (in Russian). DOI: 10.5510/OGP20160400297
- Kazakov K.V. Methodological issues of flow simulation during WAG and gas injection. Exposition Oil Gas. 2017. N 3 (56), p. 42-47 (in Russian).
- Zhukov V.S., Kuzmin Yu.O. Experimental evaluation of compressibility coefficients for fractures and intergranular pores of an oil and gas reservoir. Journal of Mining Institute. 2021. Vol. 251, p. 658-666. DOI: 10.31897/PMI.2021.5.5
- Dorfman M.B., Sentemov A.А., Belozerov I.P. The study of displacing ability of lignosulfonate aqueous solutions on sand packed tubes. Journal of Mining Institute. 2023. Vol. 264, p. 865-873.
- Mikhailov N.N., Tumanova E.S. Phase permeability of low-permeable collectors. Oilfield engineering. 2020. N 8 (620), p. 28-38 (in Russian). DOI: 10.30713/0207-2351-2020-8(620)-28-38
- Dmitriev N., Maksimov V., Mikhailov N., Kuzmichev A. Experimental study of filtration properties of hydrocarbons anisotropic fields. Burenie i neft. 2015. N 11, p. 6-9 (in Russian).
- Ratnikov I.B., Shulga R.S., Romanov E.A. Interpretation of research data curves capillary pressure. Mining Science and Technology. 2016. N 4, p. 24-39 (in Russian). DOI: 10.17073/2500-0632-2016-4-24-37
- Orlov D.M., Fedoseev A.P., Savchenko N.V. et al. Estimation of filtration velocity influence on relative phase permeabilities using method of unsteady filtration. Vesti gazovoy nauki. 2015. N 3 (23), p. 8-14 (in Russian).
- Stepanov A.V., Zubareva I.A., Volgin E.R. Hydrodynamic modeling of laboratory experiments related to oil displacement with thermopolymer solution. Tyumen State University Herald. Physical and Mathematical Modeling. Oil, Gas, Energy. 2022. Vol. 8. N 2 (30), p. 77-100 (in Russian). DOI: 10.21684/2411-7978-2022-8-2-77-100
- Stepanov S.V., Vokina V.R. On the question of comparability of relative phase permeabilities obtained by different methods. Tyumen State University Herald. Physical and Mathematical Modeling. Oil, Gas, Energy. 2024. Vol. 10. N 2 (38), p. 45-55 (in Russian). DOI: 10.21684/2411-7978-2024-10-2-45-55
- Galkin S.V., Kochnev A.A., Beltyukov D.A. Approximation of curves of relative phase permeabilities in creating geological and hydrodynamic models of high-viscosity oil reserves. Oilfield engineering. 2022. N 12 (648), p. 28-33 (in Russian). DOI: 10.33285/0207-2351-2022-12(648)-28-33
- Kadet V.V., Galechan A.M. Consideration of Jamin effect in a percolation model of microdispersed water-gas mixtures moving within an oil reservoir. Vesti gazovoy nauki. 2023. N 2 (54), p. 118-123 (in Russian).