Granulometry within the kinematic theory of open system transformation
- Ph.D., Dr.Sci. Professor Tomsk Polytechnic University ▪ Orcid
Abstract
Polymodality of statistical sand grain size distribution is due to the changes in kinematic energy of aquatic environment during the process of sediment deposition in open system-facies. Improving relevance of information about deposition paleoenvironment is of high significance in interpretation of granulometric analysis results. The paper investigates the results of granulometric analysis of sandy-aleuritic deposits confined to different formations in the wells located in the oil fields on the Yamal Peninsula. Based on the kinematic theory of open system transformation, the equation that describes the dependence of grain size on grain kinematic parameters – time period and transport distance – was developed. Therefore, it is possible to calculate these parameters within the studied facies on the basis of available grain sizes and percentage of fraction with diameter range from 0.001 to 1 mm. The aim of this study is to present a new approach to facies identification based on the calculations of kinematic parameters of sand grain flow and fine grains using the equations of open system transformation intensity within the universal kinematic theory. The parameter which was proved the most informative is sediment transport distance during deposition, which is controlled by the size of the settling grains. This parameter is influenced by bed slope angle, grain size, and deposition depth. Comparing the value of this parameter with fraction diameter, it is possible to identify the facies of the studied area.
The study was carried out within the framework of Tomsk Polytechnic University development project.
Introduction
External dynamic force causes exchange of matter and energy with the environment, driving structuralization/destructuralization of an open system. The external force transfers energy, impulse to the elements of the open system, thus, changing the system’s state. It is worth noting that it is not only the state of the environment that changes under the action of external dynamic force, but the elements of the system itself that can transform into qualitatively different elements allowing for non-linear dissipative process [1, 2]. If transformation of systems results in structuralization of the environment (attractor in phase space), the transformation process “carries information” about the regularities in changes of structural elements, i.e. it reveals the state of process-attractor itself [3].
According to the universal kinematic theory of open system transformation, each state of transformation is discrete and linked to the constant of the “golden” ratio [3]. Statistical distribution of the intensities of transformation of various open dynamic systems (geological, geochemical, geographic, biological, etc.) is almost always polymodal [4-6]. Studies have shown that the values of intensity distribution not only of geochemical systems [3, 5], but river systems as well (river flowrate) [4] obey the equations of the universal kinematic theory. It is obvious that polymodality of statistical distribution of open system transformation intensities is an indicator of openness of systems to various external action.
Since the mid-twentieth century, the causes of polymodal sediment grain-size distribution in various facies have been identified [7-9]. Studies have shown that the modes of sand transportation (suspension, saltation, and dragging) and effects of dynamic erosion of clasts result in bimodal or trimodal grain size distribution.
The experimental studies [10] of dynamic characteristics of the equipment for microcrystalline cellulose and α-lactose monohydrate granulation have shown that the degree of granulation and the size of granules significantly depend on the powder feed rate and torque velocity ratio. The number of modes in granule size increases with the decrease in powder feed rate, which indirectly indicates the dependence of modes on the type of action.
In [11], histograms of the sediment prove the distribution of sediment grain size in the river-lake system to be polymodal, namely there are three modes, which are affected by external hydraulic-climatic actions. In addition, the sand grain size measurements (on Fisher Island) have revealed bimodal size distribution, namely coarse sand and medium sand [12]. The size of sand grains is affected by facies conditions of sedimentation.
In oil and gas exploration and production, granulometry studies of sandstone are commonly carried out to find out sedimentary facies which, in its turn, directly affect reservoir properties and hydrocarbon potential. Polymodal distribution of sand grain size is associated with the changes in kinematic energy of water as a transporting medium and depositional history [13, 14]. The less the grain size, the greater the transport distance is from the source area [15]. The study [16] presents the results of granulometry analysis of sandstone facies of Ise formation. The sand grains are of low sphericity and range from angular to sub-rounded. Histograms of grain size distribution show both unimodal and bimodal trends. The probability density function for grain size distribution is basically asymmetrical with the modes varying due to the changes in the energy of transporting medium.
According to the above-mentioned studies, polymodality of sand grain size distribution is due to the changes in kinematic energy of aquatic environment during the deposition process. In this case probability density function for grain size distribution is an equivalent to the deposition intensity within the study area. In the kinematic theory of open system transformation, there is the equation that describes transformation rate of an open system. This equation is a function of internal time period of transformation and external force [3]. Modifying this equation, it is possible to obtain the dependence of grain size (diameter) on the kinematic parameters (grain deposition rate, deposition time period) which are induced by external force. Thus, having defined the grain-size distribution of sand and pelite fractions and calculated the kinematic parameters of each averaged fraction, it is possible to use these data as additional factors in facies analysis. The values of these parameters would indicate the last conventional stage in paleo-depositional environment, which can be traced in core samples.
The current study is aimed at revealing the dynamics of depositional environment based on the calculations of kinematic parameters of the flow carrying sand grains and fine grain particles. The kinematic parameters are calculated using the equations of open system transformation intensity within the universal kinematic theory. Identifying facies (depositional environment) on the basis of the kinematic parameters is possible only if sediment source is uniform and all sediment fractions are subject to transportation.
Methods
The study was carried out using the findings of granulometric analysis of sand-slitstone deposits. The cores were taken from various intervals in the wells located on the Yamal Peninsula – Tambeyskoye, Malyginskoye, and Tasiyskoye oil and gas fields (see Table). The laser diffraction method, which is based on the light scattering phenomenon, was used to determine the size of grains.
Percentage of size-based fractions in oil and gas formation on the Yamal Peninsula, %
|
Core sampling region |
Formation |
Grain size, mm* |
||||||||||||
|
Sand fraction |
Siltstone |
Pelite |
|
|||||||||||
|
0.8-0.5 (0.65) |
0.5-0.4 (0.45) |
0.4-0.315 (0.357) |
0.315-0.25 (0.28) |
0.25-0.2 (0.22) |
0.2-0.16 (0.18) |
0.16-0.1 (0.13) |
0.1-0.05 (0.075) |
0.05-0.01 (0.03) |
0.01-0.005 (0.0075) |
0.005-0.001 (0.003) |
<0.001 (0.001) |
|
||
|
Tasiyskoye field |
TP22 |
1.02 |
1.27 |
2.5 |
3.8 |
6.1 |
19.8 |
27.1 |
18.7 |
7.3 |
1.3 |
2.5 |
2.3 |
|
|
West-Tambeyskoye |
TP22 |
0 |
0 |
0 |
0 |
1 |
1.5 |
13.8 |
52.2 |
17.2 |
1 |
3.45 |
6.9 |
|
|
West-Tambeyskoye |
TP1 |
0 |
0 |
1.24 |
7.13 |
10.0 |
36.7 |
22.9 |
11.2 |
5.2 |
3.4 |
2.2 |
0 |
|
|
Malyginskoye field |
TP15 |
0 |
0 |
0 |
1 |
2.73 |
11.4 |
30.5 |
28.7 |
14.3 |
2.2 |
4.7 |
3 |
|
* Average particle size is given in brackets.
According to the universal kinematic theory of open system transformation, transformation intensity is an equivalent to the percentage (proportion) of the transformed elements of the system. It can be referred to the content of secondary minerals or chemical elements in permeable rocks which are open geological systems [3, 5], or to the river flow rate [4], etc. In this study depositional environment determined by the local condition of granular sedimentation is an open system acted upon by hydrodynamic force. The percentage or proportion of grains corresponds to the intensity of granular sediment deposition. Therefore, using the basic equation of the kinematic theory and its modification, it is possible to deduce the dependences of such kinematic parameters as rate and period of granular sediment deposition which define the degree of impact of external factors on grain size.
Transformation intensity is determined according to equation [3]
where q – proportionality coefficient; Δτ – period of potential transformation of system elements, i.e. internal characteristics of these elements, Δτ = ±(τ – τ0); Δt – the period over which external force acts on the system when the elements of the system start transforming, Δt = ±(t – t0); τ0, t0 – initial time parameters.
The current study investigates sediment deposition as a transformation process within the kinematic theory.
The investigation of coastal dynamics (based on granulometric analysis of superficial deposits and extrapolation of various granulometric indices) reveals the correspondences between wave energy distribution and coastline evolution where the obtained results combined with granulometric analysis disclose the regularities in distribution of sedimentary rock types [17]. The studies of other authors have revealed that sediments sampled along the coastline are commonly coarse-grained sand and medium-grained sand, while sediments sampled in vicinity to the border of subaquatic dune are basically medium-grained sand and fine-grained sand [18]. To predict the transitions between moving/stationary dunes and moving/stationary bed and to outline granulometric phenomena, different models were developed on the basis of the forces acting on a sediment grain, such as the drag, turbulent, apparent gravity, Van der Waals and lift forces [19].
There are also equations for predicting sand erosion velocity and sand deposition velocity [20], in addition, the models of critical velocity of sand transport have been developed. According to these models, the steady state is possible if sand eroded from the top of dune formation is replaced by that supplied from upstream. When velocity is high, dune is broken up into a number of slowly moving dunes, while sand grains are transported downstream from the top of dune to its base. With further increase in velocity, sand dunes are completely destroyed and the layer of sand that moves along the bed forms [21]. Accretion evolution in open bed systems (up to 2.5 m in depth) is primarily stipulated by varying wave velocity and current direction [22, 23].
According to the study results, the steady states of fine-grained sediment deposition are also possible under external hydrodynamic force, however, the kinetic energy should correspond grain mass and size. It is possible to consider the model of water flow impact on sand grains on the basis of kinematic dependences, provided that the density of the analyzed grains is uniform and constant and grain size corresponds to grain mass.
The size of fractions and their percentage are given in Table. As obvious from equation (1), the grain size is affected by transportation peculiarities, i.e. one of the time parameters. To clarify this dependence, let us examine the capabilities of the standard procedure. Using the Stokes equation that describes deposition of sediment grains in calm water, we obtain the dependence of deposition velocity on grain size d within the kinematic theory:
where g – acceleration of gravity, m/s2; µ – water kinematic viscosity, m2/s.
It is not possible to use formula (2) for identifying paleo-depositional environment, since it is necessary not only to know viscosity of water which is dependent on ambient temperature, but, most importantly, to consider the impact of flow velocity on the grains, which is characterized by different transportation modes – suspension of silty-pelite sediments and saltation of sand. This also affects the height up to which the grains can float in water.
When investigating the effect of external hydrodynamic force during the last period of deposition, it is necessary to replace the initial deposition time by the time period during which grain is transported from the last place of erosion to the point where it becomes suspended. The value of this parameter depends on the depth of water body (i.e. the average suspension height in relation to bed), dynamic flow characteristics, and grain diameter. In the case of kinematic model of grain settling, this parameter can be regarded as an average constant value for grains having one and the same size. In grain size distribution equation (1), time parameter t is interpreted as period of water flow impact on grains. The action of hydrodynamic force is an essential parameter that affects sediment deposition, when transport distance during the last stage of transportation remains equal both for water flow and grains themselves. In this case the period of water flow impact on grains is less than grain transport period due to higher velocity of water in relation to the transport velocity of sand-pelite fractions.
The final stage of sedimentation primarily depends on the external factors. Therefore, probability (intensity) of sediment accumulation is stipulated only by external force, if τ = 0. As the first approximation for the studied fractions, let us introduce a constant parameter, which describes intensity of initial stage of accumulation, into equation (1), . Then, intensity of sediment deposition (directly proportional to probability) is transformed into the following:
Let us introduce the following kinematic parameters: average water flow velocity v; deposition velocity υ; final period of sediment deposition tdep. The main deposition condition is L= υtdep = vt. Then, by modifying dependence (3) and considering the main deposition conditions, we obtain the link between water flow velocity and time of sediment transport if sediments are transported to the deposition area:
As known, the size of sand-silt fraction is dependent on the water flow velocity, and if water flow velocity increases, the critical value of size of the transported grains increases as well. The derivative d (size/diameter of fractions) relative to grain transport time represents the velocity of water flow as a function of grain transport time:
Let us take indefinite integral of function v(tdep) over time of grain transport and determine diameter of fraction:
The velocity and period of sediment deposition depend on the size of grains (diameter). Based on the well-known experiment data [24] and the dependence of sediment deposition on water flow velocity and the size of settling grains (Fig.1), polynomial correspondence of boundary deposition velocity (according to the module) and grain size is obtained:
Based on the fraction size data (see Table) and the obtained dependence of deposition velocity on grain diameter (5) (Fig.1), it is possible to calculate the deposition period using formula (4), if parameter t0 is constant.
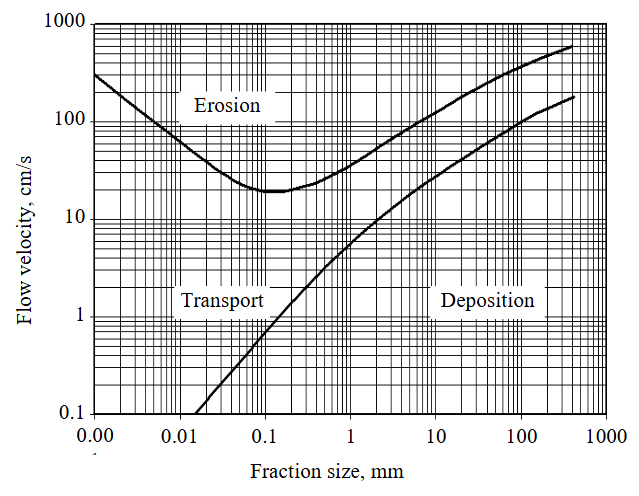
Fig.1. The F.Hjulström curve which shows the relationship between erosion, transport, deposition, grain size and water flow velocity
Let us determine the initial parameter t0, which is an average time period during which grain is transported from the last place where it is eroded to the point where it becomes suspended at the last stage of sediment deposition, if a = 1. Therefore, this parameter must be linked with the average initial erosion velocity ⟨υer⟩ and average transport distance from the place where grain is eroded to the point where it becomes suspended L0. If water is transporting medium, the average transport velocity for each fraction from the place where grain is eroded to the point where it settles is a constant value.
The data presented in Table indicate that the average diameter of fraction characterized by the highest percentage (four average values with total percentage more than 70 %) is 0.1 mm, which corresponds to the critical erosion velocity according to the Hjulström curve. The average erosion velocity of these fractions ≈ 0.1-0.15 m/s. In turn, according to G.I.Shamov’s dependence, the average erosion velo-city is proportional to the average flow depth [25]:
Figure 2 illustrates conventional diagram of erosion and transport of pelite-sand fractions, with maximum suspension height being equal to the average flow depth. Based on G.I.Shamov’s formula, the average height of grain suspension in relation to the maximum and minimum critical erosion velocity values is calculated as follows: ⟨h⟩=1/2(hmin+hmax)≈0.1 m. According to the experiment data, if water is calm and temperature range is 15-20 °C, the average velocity ⟨υh⟩ of grain settling (d ~ 0.1 mm) is approximately 0.007 m/s [9]. In this case, having defined sin α (Fig.2) as the relation of grain settling velocity vector to the minimum critical value sin α=υh/υer=0.07 it is possible to calculate the average value of deposition constant: L0=⟨h⟩/sin α=1.43 m. Then, let us calculate the value of time constant parameter of initial hydrodynamic impact: t0=L0/⟨υer⟩≈14.3 s.
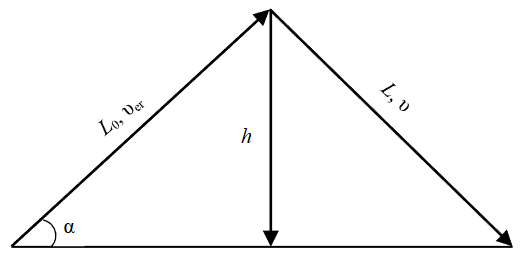
Fig.2. Conventional diagram of the last transport and deposition period due to saltation and suspension
If diameter of the studied grains is significantly different from 0.1 mm, the value of initial time constant will differ from given t0.
Let us consider the other two constants. The invariable Q must be less than the intensity I, therefore, if Imin = 0.01 f.u. in terms of 5 % difference, the constant Q = 0.0095 f.u. The constant c in equation (4) must be less than the minimum diameter of studied fractions. According to the table data, let us find the minimum value (⇐ 0.001 mm) and with 5 % difference let us determine the constant с= 0.00095 mm.
Thus, the obtained values of equation constants (4) are relevant to the studied samples given in the table, therefore, the use of these constants would allow calculating time of the last stage of sediment deposition. Obviously, the use of the obtained constants is limited by fraction diameter ranging from 0.001 to 1 mm, while equation (4) can be applied only if water is a transporting medium and transportation modes are saltation and suspension.
In this case there is the need to prove the validity of the calculated time parameter. It can be done by “correct” dependences, i.e. there is correlation of empirically obtained data of the equations (size of fractions and their percentage) and the calculated parameters. The validity of equation (4) is proved by the following regressions. Firstly, it is proved by the opposite trends in the dependences of deposition time and deposition velocity (at the last period) on grain size in the case of sand fraction and pelite fraction. It is experimentally and theoretically proved [26, 27] that with the flow velocity increase fined fractions go upward and get suspended, while larger fractions (sand) settle moving along the bed as a bedload, which leads to the inverse dependences. Secondly, with grain deposition period increase, the proportion of grains must also correspondingly increase, however, with different trends depending on the fraction size. When adhering to the above-described statements, the validity of equation (4) can be considered to be proved.
Practically, equation (4) can be used as an additional source of information for granulometric analysis. Table presents the results of the analysis of cores sampled from the formations which were subject to the traditional facies analysis based on the standard V.S.Muromtsev’s procedure of facies interpretation according to the standard well logging data [28]. Well log curves are “associated” with certain core sampling intervals, and physical characteristics of the geological section and lithogenous types of deposits are correlated. The shapes of well log curves are defined, well-log-curve sequence along the geological section is outlined, well logging characteristics of the studied intervals and electrometric models of well-known facies are compared [29-31]. The core is investigated by various methods – lithologo-petrographic, geochemical, and paleontological. Based on the obtained results, deposition environment is determined. In this case, there is an opportunity to compare, first of all, the obtained data and, then, to compare them with the findings provided by the investigation based on the kinematic theory.
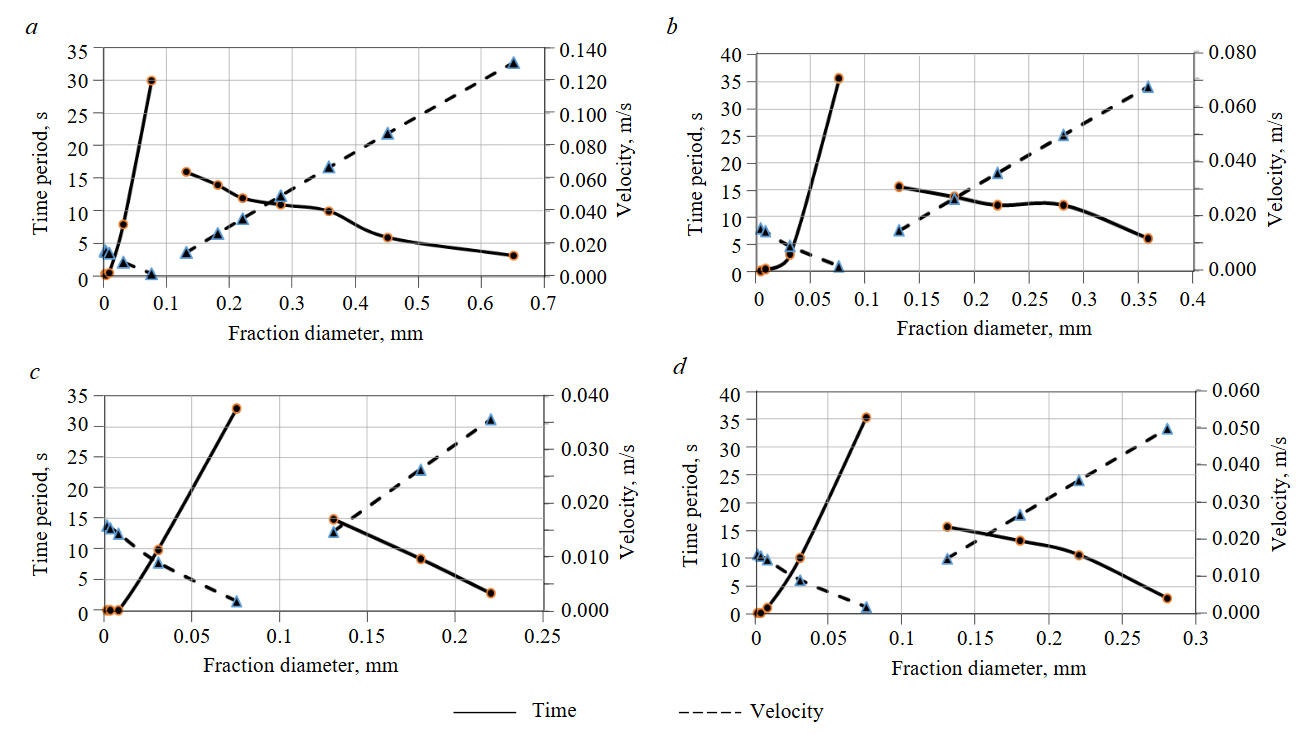
Fig.3. Dependences of grain deposition rate and time on the average diameters of fractions from the studied intervals: Tasiyskoye field – TP22 (а); West-Tambeyskoye field – TP1 (b); West-Tambeyskoye field – TP22 (c); Malyginskoye field – TP15 (d)
Results
The kinematic parameters are non-linearly dependent on the size of settling grains. The use of equation (4) and equation (5) allows calculating the periods of grain deposition and compare the values with the fraction sizes (Fig.3); the trends of deposition periods and deposition rates are inversely proportional, and, most importantly, these parameters demonstrate opposite direction of trends for silty-pelitic and sand fractions.
In terms of dynamic processes, a silty-pelitic fraction obeys the principles of mesodynamics – deposition velocity is affected by the area of grain surface, i.e. the greater the area (size), the significantly greater the resistance force of water molecules. Gravity force plays more crucial role for the sand fraction, mainly, deposition rate is proportional to grain mass/size with regard to the traditional forces of hydrodynamics. In kinematic model of equation (4), these differences in dynamic functions form properly selected constants – Q, a, c.
Fig.4 (Tasiyskoye field) illustrates three direct dependences of fraction proportional content on time. Each regression represents a group of fractions characterized by certain size, and the group of sand grains ⇐ 0.13-0.28 mm is notable for the greatest tilting angle to the x-axis (~78.5°). The remaining dependences of the studied sampling intervals, which are not presented in Fig.4 (TP1, TP22, TP15), form two positive regressions – for pelitic and sand fractions.

Fig.4. Dependences of fraction percentage on deposition time periods for fractions of different size (Tasiyskoye field – TP22)
Obviously, fine sand (diameter up to 0.3 mm) of TP22 formation in Tasiyskoye field is more likely to deposit within the specific deposition conditions tdep= 11-20 s, which may be explained by the decrease in hydrodynamic activity.
Let us consider the facies of the studied fields on the basis of brief description of the findings of standard investigations.
The studied TP22 formation interval in the well located in Tasiyskoye field is related to the facies of submerged elements of regressive bar. To prove this fact, let us provide the lithological description of core. In facies analysis the parameter α-diagram of self-potential logging is used: αSP = (Umax – U)/(Umax– Umin), where U – measured voltage, mV. Fine-grained sandstone and siltstone are characterized by different sorting (αSP = 0.5-0.6). There is a developed thin, gently sloping and horizontal bedding, as well as low angle wavy cross bedding. The rocks contain fine vegetative detritus and rare traces of organisms. The facies are characterized by steady decline in hydrodynamic activity up to the average values.
The TP1 formation interval in the well located in West-Tambeyskoye field is related to the facies of sand and silty sediments of coastal foreland. The formation is underlain by homogenous mudstone with sandstone beds forming sometimes inhomogeneous interbedding. Sediment deposition occurred under conditions of time-varying dynamics of water environment from average up to low and very low. This may be caused by the increase in the depth of sedimentation basin.
The interval of TP22 formation in the well located in West-Tambeyskoye field is related to the facies of siltstone and fine-grained sand within the slopes of underwater bars of the coastline. The geological section is characterized by interbedding of black siltstone and light-grey fine-grained sandstone interbedded with thin horizontal layers of siltstone. Siltstone is dense and contains vegetative detritus. The stable deposition environment contributed to the continuity of accumulated sediments and influenced formation thickness and sandiness. The wave lamination, multidirectional wavy cross bedding and zig-zag shapes of well log anomalies of induced potential logging (SP), which reflect frequent change of hydrodynamic intensity of water medium where sediments deposited, indicate the undulatory movement of water medium. Sediment deposition in TP22 formation occurred in the shelf sea against sea regression. Trace fossils indicate marine sedimentation patterns.
The interval of TP15 formation in the well located in Malyginskoye field is related to the facies of sand sediments in central parts of river beds confined to the meandering rivers of lacustrine-alluvial plain. Sand sediments formed in water medium which is characterized by high hydrodynamic activity. This fact is proved by high values of αSP (0.8-1). SP anomalies are registered in the zone of negative departure; they are of quadrangle shape and are complicated and even strongly complicated with lateral jaggies. These shapes indicate unstable water medium – multiple declines and increases in hydrodynamic activity, which is a characteristic feature of meandering river beds.
One of the kinematic parameters is the transport distance at the last stage of sediment deposition L. It is worth noting that this parameter illustrates not the entire transportation distance, but only the last part before the final stage of deposition. Figure 5 demonstrates the dependences of this parameter on the average size of settling fractions within each study area. Based on the findings, it is possible to draw the following two conclusions:
- the values of peaks (extremum 2) for each study area are different and depend on fraction size and facies;
- there is no extremum 1 for the study area TP1, in other areas this extremum is controlled by the fraction of one and the same diameter – 0.03 mm.
Discussion
To improve the reliability of reconstruction of paleo-depositional environment, it is reasonable to combine various research methods among which granulometric analysis (diagrams of R.Passegi and G.F.Rozhkov) supplemented with other methods of facies analysis contributes to more reliable facies reconstructions [32, 33]. In this respect, facies analysis should be enhanced so that it can provide more accurate and valuable information about sedimentation environment. For example, to calculate stream sediment load, individual formulas from eight alternative groups are used in accordance with the type of dominant water dynamic impact [34].
The analysis of the obtained dependences (see Fig.3, 4) which were developed using equations (4), (5), proves the relevance of these formulas in granulometric analysis. The main practical significance of the obtained equations and constants is that they can be used for the analysis of facies when grain diameter range is 0.001-1 mm.
In [9] three main reasons why size of settling grains depends on spatial morphology of coastal-marine facies are described. Firstly, slope angle directly contributes to increased sediment load, i.e. with steeper slope angles of bed the diameter of settling sediments also increases. Secondly, the size of settling sediments increases with the increased distance from the encroachment line. Thirdly, coarse grains accumulate in the crest of sand bars, with grain size decreasing downslope. The above-enumerated (empirically-based) statements can be applied for the analysis of the obtained dependences Fig.5.
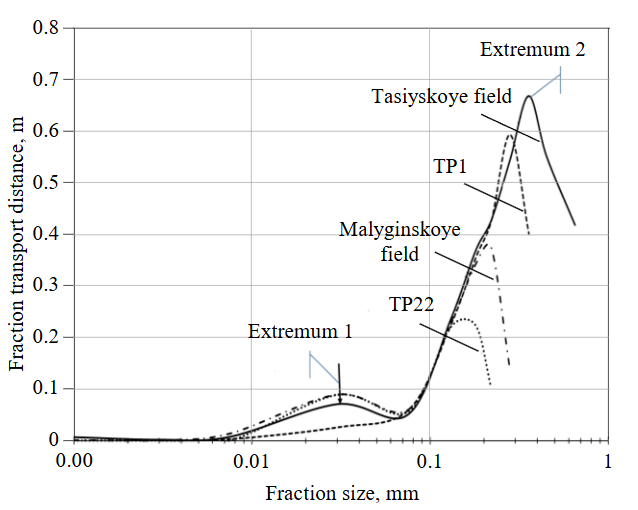
Fig.5. Dependence of fraction transport distance on grain size logarithm
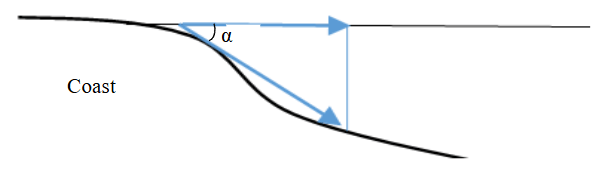
Fig.6. Diagram of sea bed slope in the vicinity of the coastline
Assuming the bed slope angle (hypotenuse of right triangle) is defined as the angle α between normals to coastline, which are parallel to water surface and bed (Fig.6), and assuming the side adjacent the angle is toward the sea, the hypotenuse of right triangle is equal to the transport distance traveled by grains in saltation [25]. With steeper bed slope angle α and constant starting point of grain transport against coastline, the transport distance (with respect to angle cosine) traveled by grains and the size of settling grains increase. Figure 5 illustrates this phenomenon for grains in the size range from 0.075 mm to extremum 2 for grains with different diameters depending on the facies. The further decrease in distance with the increase in grain size (i.e. α increase) can be stipulated by the reduction in deposition depth (regression, sand bar formation).
In turn, suspended fine-grained sediments settle in calm conditions, and there is a sharp increase in proportion of grains in the size range from 0.03 to 0.13-0.18 mm (see Table). As shown in Fig.5, the initial size ⇐ 0.03 mm is presented as extremum 1 only for three facies. It might be stipulated by the beginning of mass vertical deposition of sediments, when in addition to main vertical force component there is also insignificant horizontal velocity component, and the deposition time increases with respect to that required for grains to settle in deeper facies (with one vertical component), for example TP1 formation.
Conclusion
Based on the obtained kinematic dependences, the following conclusions can be drawn:
- The interval in the well drilled into TP22 formation in Tasiyskoye field formed under periodic hydrodynamic action and with the significantly steep slope of sea bed forming sand bar. The greatest extremum 2 – the transport distance with the largest size of fractions (compared to two studied marine deposits) indicates intensive hydrodynamic impact.
- The interval of West-Tambeyskoye well in TP1 formation formed in marine conditions and in the deepest water area (bar foreland from seaward), which is proved by the absence of extremum 1 and relatively high value of extremum 2.
- The interval of Malyginskoye well in TP15 formation formed in water environment under periodic hydrodynamic impact. Having defined by alternative and traditional methods that sedimentation occurred under continental conditions, it is possible to refer the facies to the central part of river channel, which is proved by intensive fraction periodicity with extremum 2 having the average value (see Fig.5). Also, the presence of extremum 1 proves seasonal depth changes.
- The interval of West-Tambeyskoye well in TP22 formation formed in coastal-marine conditions not far from coastline (the lowest value of extremum 2) with wave effect and bar formation.
The transport distance for grain size in the range of 0.1-0.5 mm reflects the intensity of hydrodynamic effect. However, if the grain size range is from 0.03 to 0.04 mm, it indicates presence/absence of horizontal component of velocity vector indirectly caused by deposition depth.
Thus, the calculated kinematic parameters of settling grains allow specifying and updating paleo-depositional environment which has been already studied in the traditional way.
The use of the obtained equations (4) and (5) in facies analysis of sand-siltstone deposits allows determining such kinematic parameters as velocity, time period and transport distance during sediment deposition. These parameters of the studied facies, even if they are not presented as absolute units, but as conditional ones, can be used as an additional source of information which can specify hydrodynamic paleoconditions of sedimentation. In this case, the most informative parameter is “sediment transport distance during deposition”, which is controlled by the size of the settling grains. This parameter is influenced by bed slope angle, grain size, and deposition depth. Comparing the value of the calculated parameter with fraction diameter, it is possible to identify the facies of the studied area.
References
- Vasiljev Yu.S., Volkova V.N., Kozlov V.N. Concept of the open system: history, condition, development prospects. Sistemnyi analiz v proektirovanii i upravlenii: Sbornik nauchnykh trudov XXII Mezhdunarodnoi nauchno-prakticheskoi konferentsii, 10-11 iyunya 2019. Politekh-Press, 2019. Part 1. p. 5-17 (in Russian).
- Haddad W.M., Somers L. Partial stability of nonlinear dissipative feedback systems. International Journal of Control. 2024. Vol. 97. Iss. 6. p. 1432-1443. DOI: 10.1080/00207179.2023.2208690
- Melnik I.A. Polymodality of secondary kaolinite distribution in open sandy reservoir systems. Bulletin of the Tomsk Polytechnic University. Geo Аssets Engineering. 2023. Vol. 334. N 8, p. 17-29 (in Russian). DOI: 10.18799/24131830/2023/8/4163
- Melnik I.A. Polymodal distribution of water discharge probability in river systems. Bulletin of the Tomsk Polytechnic University. Geo Аssets Engineering. 2024. Vol. 335. N 1, p. 46-56 (in Russian). DOI: 10.18799/24131830/2024/1/4411
- Melnik I.A., Nedolivko N.M. Extremes of discrete boron content distribution as indicators of sedimentation hydrodynamics. Oil Industry Journal. 2022. N 10, p. 14-18 (in Russian). DOI: 10.24887/0028-2448-2022-10-14-18
- Sukhanov V.V., Ivanov O.A. On the polymodal distribution of the Kuril epipelagic nekton on a body weight of specimens. Izvestiya Tikhookeanskogo nauchno-issledovatelskogo rybokhozyaistvennogo tsentra. 2001. Vol. 128, p. 390-408 (in Russian).
- Weltje G.J., Prins M.A. Muddled or mixed? Inferring palaeoclimate from size distributions of deep-sea clastics. Sedimentary Geology. 2003. Vol. 162. Iss. 1-2, p. 39-62. DOI: 10.1016/S0037-0738(03)00235-5
- Doeglas D.J. Interpretation of the results of mechanical analyses. Journal of Sedimentary Petrology. 1946. Vol. 16. N 1, p. 19-40. DOI: 10.1306/D426924C-2B26-11D7-8648000102C1865D
- Kotelnikov B.N. Reconstruction of sand genesis. Grain size distribution and analysis of empirical distribution histograms. Leningrad: Izd-vo Leningradskogo universiteta, 1989, p. 132 (in Russian).
- Mendez Torrecillas C., Halbert G.W., Lamprou D.A. A novel methodology to study polymodal particle size distributions produced during continuous wet granulation. International Journal of Pharmaceutics. 2017. Vol. 519. Iss. 1-2, p. 230-239. DOI: 10.1016/j.ijpharm.2017.01.023
- Ashley G.M. Interpretation of Polymodal Sediments. The Journal of Geology. 1978. Vol. 86. N 4, p. 411-421. DOI: 10.1086/649710
- Asthana R., Shrivastava P.K., Srivastava H.B. et al. Hydrochemistry and sediment characteristics of polar periglacial lacustrine environments on Fisher Island and Broknes Peninsula, East Antarctica. Advances in Polar Science. 2013. Vol. 24. N 4, p. 281-295. DOI: 10.3724/SP.J.1085.2013.00281
- Myo Min Htun, Sugeng Sapto Surjono, Jarot Setyowiyoto. Granulometry analysis of Ngrayong sandstone, Tempuran Area, Rembang Zone, North East Java Basin. IOP Conference Series: Earth and Environmental Science. 2020. Vol. 451. N 012082. DOI: 10.1088/1755-1315/451/1/012082
- San Yee Khaing, Yuichi Sugai, Myo Min Tun et al. Textural Characteristics and Depositional Environment of Ngrayong Sandstone (Middle Miocene) from Rembang Area, Northeast Java, Indonesia. Open Journal of Geology. 2022. Vol. 12. N 12, p. 1102-1119. DOI: 10.4236/ojg.2022.1212052
- Ikhane P.R., Akintola A.I., Bankole S.I. et al. Granulometric analysis and heavy mineral studies of the sandstone facies exposed near Igbile, southwestern Nigeria. International Research Journal of Geology and Mining. 2013. Vol. 3. N 4, p. 158-178.
- Madukwe H.Y. Granulometric Analysis Of The Sandstone Facies Of The Ise Formation, Southwestern Nigeria. Journal of Multidisciplinary Engineering Science and Technology. 2016. Vol. 3. Iss. 2, p. 3909-3919.
- Remmache K., Nour El Islam Bachari, Nacef L., Houma F. Granulometric Indices Mapping in Relation to Hydrodynamic Factors for Beach Characterization and Monitoring with Very High Spatial Resolution. Data Science and Application. 2020. Vol. 3. N 1, p. 5-12.
- Das G.K. Granulometry of Beach Sands. Coastal Environments of India. Springer, 2022, p. 79-94. DOI: 10.1007/978-3-031-18846-6_5
- Dabirian R., Mohan R.S., Shoham O. Mechanistic modeling of critical sand deposition velocity in gas-liquid stratified flow. Journal of Petroleum Science and Engineering. 2017. Vol. 156, p. 721-731. DOI: 10.1016/j.petrol.2017.06.006
- Salama M.M. Sand Production Management. Journal of Energy Resources Technology. 2000. Vol. 122. Iss. 1, p. 29-33. DOI: 10.1115/1.483158
- Danielson T.J. Sand Transport Modeling in Multiphase Pipelines. Offshore Technology Conference, 30 April – 3 May 2007, Houston, TX, USA. OnePetro, 2007. N OTC-18691-MS. DOI: 10.4043/18691-MS
- Chechko V.A., Topchaya V.Yu. Long-term data of grain size parameters of bottom sediments as an indicator of stability of sedimentation environment. Advances in Current Natural Sciences. 2021. N 3, p. 86-91 (in Russian). DOI: 10.17513/use.37598
- Krylenko M.V., Krylenko V.V. Study of the Granulometric Composition of Beach and Bottom Sediments of the Bakalskaya Spit. Ecological Safety of Coastal and Shelf Zones of Sea. 2018. N 4, p. 40-49 (in Russian). DOI: 10.22449/2413-5577-2018-4-40-49
- Hjulström F. Transportation of Detritus by Moving Water. Recent Marine Sediments. A Symposium. The American Association of Petroleum Geologists, 1955. Special Publication N 4, p. 5-31. DOI: 10.2110/pec.55.04.0005
- Belolipetskii V.M., Genova S.N. Calculating algorithm for definition of dynamics of suspended and bed sediments in channel. Computational Technologies. 2004. Vol. 9. N 2, p. 9-25 (in Russian).
- Salnikov S.N., Karandaev G.Z. Analysis of distribution of sand concentration by sizes, their average weighted fineness and the slurry flow rate along the cross-sectional height of a slurry pipeline. Bulletin of the South Ural State University. Series “Construction Engineering and Architecture”. 2016. Vol. 16. N 1, p. 26-34 (in Russian).
- Ivanov V.A., Dykman V.Z., Efremov O.I. Kinetics of suspensions in the coastal zone of the sea. Physical Oceanography. 2006. Vol. 16. Iss. 4, p. 234-246. DOI: 10.1007/s11110-006-0028-7
- Muromtsev V.S. Electrometric geology of sand bodies – lithologic petroleum traps. Leningrad: Nedra, 1984, p. 260 (in Russian).
- Chudinova D.Yu., Chibisov A.V., Makhnytkin E.M., Minniakhmetova R.M. Evaluation of the analysis of lithofacies features of deposits of the efficiency of oil recovery. Eurasian Scientific Journal. 2022. Vol. 14. N 6. N 45NZVN622 (in Russian).
- Belozerov B.V. Role of sedimentation models in electric facies analysis of terrigenous deposits. Izvestiya Tomskogo politekhnicheskogo universiteta. 2011. Vol. 319. N 1, p. 116-123. (in Russian).
- Kislukhin I.V. Geological features and oil-gas bearing capacity of the Jurassic-Neocomian deposits of the Yamal Peninsula. Tyumen: Tyumenskii gosudarstvennyi neftegazovyi universitet, 2012, p. 116. (in Russian).
- Khusnullina G.R., Birkle E.A., Lebedev A.I. Granulometric analysis of the Vikulovskaya suite sandstones (Aptian Age, Lower Cretaceous) of Krasnoleninskoye field (West Siberia). Litosfera. 2012. N 6, p. 90-99. (in Russian).
- Vakulenko L.G., Predtechenskaja E.A., Chernova L.S. The experience of granulometric analysis application for the reconstruction of depositional paleoenvironment of the productive beds sandstones of the Vasugan horizon (West Siberian plate). Litosfera. 2003. N 3, p. 99-108 (in Russian).
- Pozdnjakov Sh.R., Shmakova M.V. Calculation of sediment discharge for large fraction bed rivers. Proceedings of the Russian State Hydrometeorological University. 2016. N 45, p. 20-27 (in Russian).