
A method of determining the errors of segmented GRID models of open-pit mines constructed with the results of unmanned aerial photogrammetric survey
Abstract
The methodology of building a digital elevation model based on the results of aerial photogrammetric survey from an unmanned aircraft is proposed, which is based on the division of the initial point cloud into equal segments. This allows, having made an assumption of the linear character of change of height of points in a separate segment, to approximate them by separate planes. RMS errors of the models from the survey data were calculated according to the scattering of the points in relation to the approximating surfaces, which made it possible to reveal the dependence of the model construction error relative to the sizes of their constituent segments, as well as to propose a method for filtering the cells containing outliers with respect to the expected model error. The proposed method was tested on the models of three mining objects – limestone quarry, phosphogypsum dump, and peat cut. The experimental results showed a multiple reduction in model error compared to standard DEM models providing the required accuracy for mining documentation.
None
Introduction
The exploitation of mineral deposits is connected with mine surveying [1], that includes engineering support of mining operations [2], monitoring of geomechanical processes [3, 4], accounting for the movement of mineral resources [5], accumulating, storing and generalizing information about spatial and temporal changes occurring on the Earth’s surface and in the underground [6]. These tasks are united by the conception of mine surveying, which includes the processes of instrumental measurements, their mathematical processing, and the presentation of the obtained data in a form convenient for further works [7, 8]. The order of operations performed at each stage should provide strict quality control of the received, used and output data with the possibility of localization and filtering the data containing unacceptable errors (outliers) [9].
The empirical determination of the errors based on a statistical estimation of the patterns of measurement dispersion. A necessary condition in this case is the presence of redundant measurements, the number of which provides the robustness of the formed estimates. Redundant measurements are formed under certain geometric conditions, such as the equality of repeated measurements among themselves or the equality of zero sums of increments of coordinates or heights in closed polygons [10]. In the absence of redundant measurements, accuracy assessment becomes possible only as an assumption, which is based on extrapolation of measurement errors to the result that allows obtaining only the expected errors, not to find the factual ones.
The most engineering mine surveying surveys, which are connected to geometric support of mining operations related to solving the problems of determining the volume of extracted rock mass, constructing surveying mine graphic documentation, setting out project coordinates, etc., do not form a sufficient volume of redundant measurements. In this case, the quality control of the work requires additional mining surveys, which allow the risk of obtaining false information due to extrapolation of the results of the local inspection to the work as a whole. Modern means of mine surveying measurements, such as ground-based and aerial laser scanning systems, unmanned photogrammetric systems, have been widely introduced [11, 12] because they allow minimizing the time of field work. However, even with all its advantages (the high speed and completeness of the collected data, the safety of work) the issues of processing the received data, assessing their accuracy, comparing of any temporal models and solving engineering mining and geological problems with their help have not been found yet [13, 14].
Problem statement
The high speed of the survey and completeness of the collected data, obtained by laser scanning systems and photogrammetric systems is achieved with automatization of the measurement process, which can be obtained only in the complete absence of a priori selection of specific objects of surveys. In other words, the user can choose only the surveying area, and not individual objects of interest to him. As a result, the “point clouds”-data formed by these systems represent a set of coordinates that irregularly and randomly cover the survey object [15, 16].
The randomness of remote sensing data does not allow a direct comparison of several temporal mine surveys, because each time the points will be placed in a new way on the object being surveyed, not allowing the actual content of the model to be unambiguously predicted in advance and requiring the redundant information to guarantee the result. That is why the amount of data can exceed tens and hundreds of millions of points. Such a volume of information only reduces the randomness and discreteness of the model, without solving the problem, replacing it with difficulties with storing, processing and transmitting big data [17].
If the problem of randomness of the model can be extensively reduced by increasing the density of points, then the problem of discreteness cannot. Whatever the density of the formed cloud, discrete points are not able to completely fill the entire space of the model. In turn, one of the main requirements for mine graphic documentation is the ability to obtain information at any point in the model that is why it is necessary to interpolate points of the cloud [18].
This problem may be solved by constructing digital terrain models (DTM), creation of which is discussed in scientific works [2, 11]. DTMs in mining were used in solving problems of planning and estimating mineral reserves, modeling geomechanical processes [19] by finite element methods, assessing the risks of environmental accidents [20].
The standard way to construct a DTM to solve engineering problems is the interpolation of the space between points with triangular polygons, the vertices of which are determined by the Delaunay algorithm or similar. Such an algorithm of DTM construction works effectively for surveys, the result of which consists of a set of characteristic points of the terrain, selected by the surveyor during the survey work, based on his personal experience and idea of the relief shape. The points selected by the specialist form an array of characteristic relief points, which allow selecting structural lines that form a model suitable to the relief being surveyed [21].
Applying such a procedure to high-density point clouds is not highly efficient, because the volume of the resulting polygonal model doubles relative to the original one due to the fact that it must contain information not only about the points, but also about their relationships with each other. The model itself remains irregular and inherits all the errors of the initial data, while not having the tools to explicitly assess the accuracy of its polygons and requiring additional resources for subsequent work [22]. Reducing the resource requirements required to process such models is achieved mainly by preliminary dilution of the initial point cloud, which reduces the density of the resulting model. At the same time, the detail and informativeness of the model decrease, as well as the previously performed work on determining the position of points removed from processing is devalued [23].
A potential way to reduce the disadvantages of polygonal models is the use of segmented GRID models consisting of a set of geographically conjugate segments of equal type and size, ordered in the form of a matrix [24]. The regularity of the resulting model makes it more resistant to a random distribution of source points on the surface due to the fact that the position of the boundaries of the segments that make up the model is determined by the size of the segment itself and the position of the starting point [25]. The advantage of this approach is also the immutability of the final volume of model data relative to the original point cloud. It is achieved by filling the model with information by creating attributes in each segment that generalize the necessary properties of the points inside the segment [26].
Because of these advantages, segmented models have found wide application in geodesy and cartography, and the issues of their creation and improvement are relevant and are being solved by scientists around the world [27-29].
GRID models are used in cartography [30], forest resource assessment [31, 32] and GIS systems. Despite many obvious advantages of segmented models, the issues of their use for solving mining and surveying tasks remain unresolved [5]. One of the fundamental problems to their implementation in everyday practice is the lack of tools to assess their accuracy [33]. Evaluation of the accuracy of segmented models is carried out by additional measurements by geodetic means for selective quality control of the work performed, but it requires additional time and money [34].
The main purpose of this work is to describe the method developed by the authors for assessing the accuracy of segmented models by their internal content, to identify the main dependencies of the formation of errors of segmented models and to determine their optimal parameters in relation to solving problems in mining and mine surveying.
Methods
The standard form of DTM store is the DEM (Digital elevation model) format. It is a georeferenced raster image, in which pixel values are equal to average elevation in each segment [35]. The format itself and the programs that create it do not provide information about the quality of determining the resulting elevations. Therefore, the team of authors has developed its own program that allows to calculate segmented models from point clouds with the preservation of information about the errors of approximation of points in individual segments, as well as to calculate on their basis the root mean square error (RMSE) of the entire model.
Two variants were considered as approximating functions:
- the average height of all points in the segment (standard DEM);
- the plane defined by a function of the form Z= Ax + By + C, parameters A, B and C were determined by the least squares method (the author's PLANE model):
The RMSE of the approximation of points in the k-th segment can be found with:
where is the height calculated from the approximating function of the k-th segment at the point (xi, yi); zi is the elevation of the point (xi, yi); nk is the number of points in the k-th segment; rk is the number of degrees of freedom in the k-th segment, determined according to the type of approximating surface (rk = nk – 1 for the average height; rk = nk – 3 for the plane).
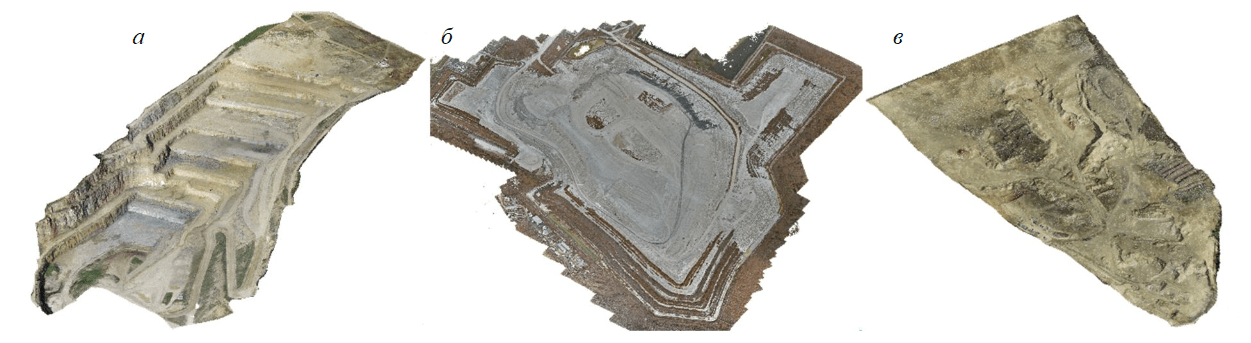
Fig.1. Point clouds of the objects under study in the paper: a – limestone quarry; b – phosphogypsum dump; c – peat deposit
The RMSE of the model can be calculated based on the RMSE of approximation of individual segments (2), taking into account the number of degrees of freedom involved in their determination:
where mk – RMSE of approximation in k-th segment; N – the number of segments in the model.
Three mining objects were selected to study. The models were obtained by photogrammetric method, the calculation of point clouds was performed in the Agisoft Metashape program (Fig.1, Table).
The main characteristics of the studied objects
|
Parameter |
Limestone quarry |
Phosphogypsum dump |
Peat deposit |
|
Square, ha |
41 |
159 |
28 |
|
Height difference, m |
132 |
112 |
23 |
|
Number of points in the initial model, thousand points |
11823 |
16242 |
5331 |
|
Model size (.asci format), Mb |
956 |
529 |
365 |
|
Used UAV |
DJI Phantom 3 PRO |
Autel Robotics EVO II Pro |
DJI Phantom 4 PRO |
|
Flight height, m |
100 |
150 |
150 |
|
Number of shots, pcs. |
127 |
1800 |
536 |
|
Matrix size, inch CMOS |
1/2.3 |
1 |
1 |
|
Resolution of snapshots, Mpixels |
12.4 |
20 |
20 |
Segmented models are built for each point cloud with segment sizes 1; 1.5; 2; 2.5; 5; 10; 15; 20; 25; 50 m, the RMSE of each segment are calculated (with a positive value of rk), the general RMSE of the models are found, and maps of the distribution of standard errors within each model are constructed.
Results discussion
The RMSE of the models calculated for each case with the formula (3) and shown in the graphs (Fig.2).
With the analysis of the obtained dependencies, it can be seen that the errors of DEM models behave the same in all studied objects, proportionally decreasing along with the segment size in the model. For equal values of segment sizes in different models, different values of RMSE are achieved, increasing in direct proportion to the increase in the total height difference in the model shown in the table. The average elevation used in the construction of the DEM model does not allow us to give a consistent estimate of the points in the approximated area due to the presence of non-horizontal sections in it, the error of the resulting height in the segment is directly proportional to the magnitude of the height difference inside it. Reducing the segment size reduces the chance of a large height difference, thereby reducing the model error.
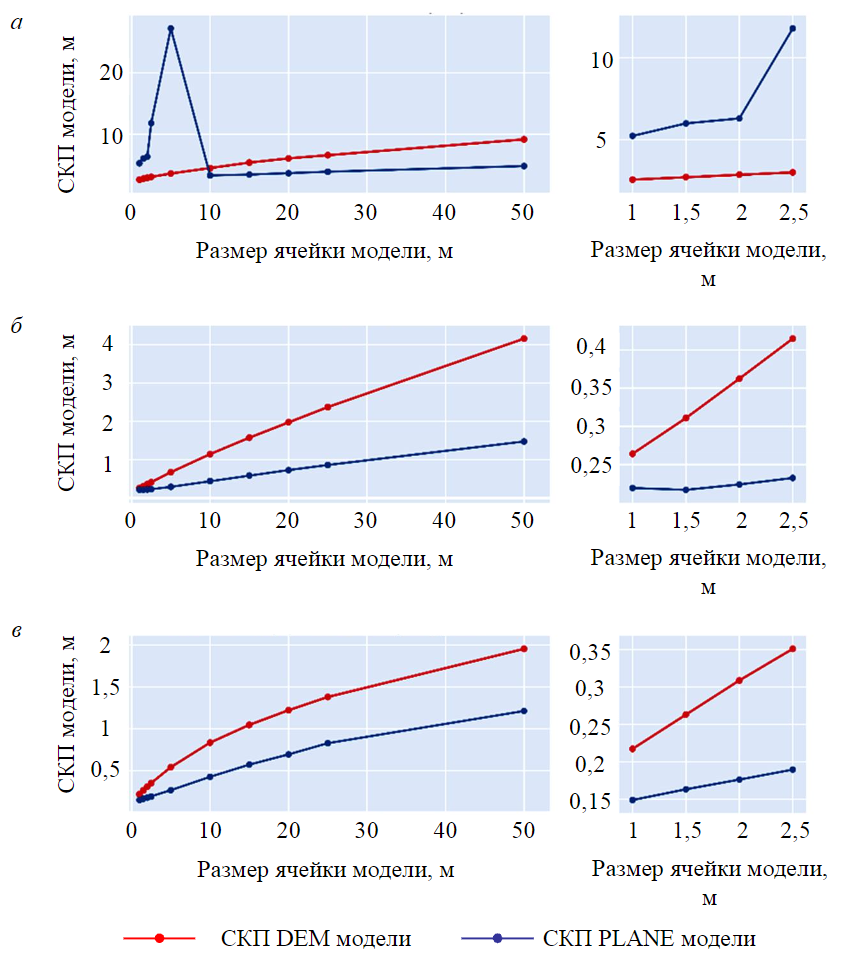
Fig.2. Dependence of the RMSE of segmented models on the segment size for objects: a – limestone quarry; b – phosphogypsum dump; c – peat deposit
The errors obtained for the minimum of the considered segment sizes of one meter exceed the values allowed for mine surveying surveys. By extrapolating the linear nature of the model error, it is possible to determine the required segment size for each case. However, due to the fact that the number of cells in the model increases quadratically with cell size, such a solution will lead to an avalanche-like increase in the volume of the overall model, which will cause both problems in filling the generated cells with information and difficulties in storing, transferring, and processing the model as a whole.
Using a plane as an approximating surface reduces the effect of the height distribution within the segments on the model error. Such effect is achieved with the fact that the PLANE model will qualitatively repeat the original data set in the case of a uniform change in height within a single segment. When comparing the dependencies of RMSE in PLANE and DEM models, it can be seen that, with the exception of limestone quarry models with cell sizes of 1-5 m, the proposed assumption corresponds to the results of the experiment.
The highlighted anomaly reveals the main drawback of the PLANE model – in the case of approximating relief containing vertical sections, function (1) can return an undefined value, the height of the marks tends to be ±∞. The RMSE calculated by formulas (2) and (3) due to squaring the deviations between the model high values and the cloud points is sensitive to the presence of rough results in the initial data, that is why it can give an overestimated value. Figure 3 shows the dependences of the model errors with the error distribution of individual segments in it.
When analyzing the distributions of segment errors within the model, it can be seen that outliers in the error values of the PLANE model with small segment sizes are caused by the presence in the sample of small segments with gross errors exceeding hundreds of meters in some cases, which is impossible, based on the actual height difference within the model (see Table). There are no segments with such a RMSE value for large segment sizes, since the large approximated area inside the segment contains, in addition to vertically distributed points, areas of terrain with a flatter relief that “flattens” the resulting surface. The maximum error of approximation of points in the segment coincides with the maximum error of DEM. The constancy of the resulting mark inside the DEM segment does not allow its root-mean-square errors to exceed a certain threshold value, unchanged to the size of the model segment and determined by the height difference in the original point cloud itself.
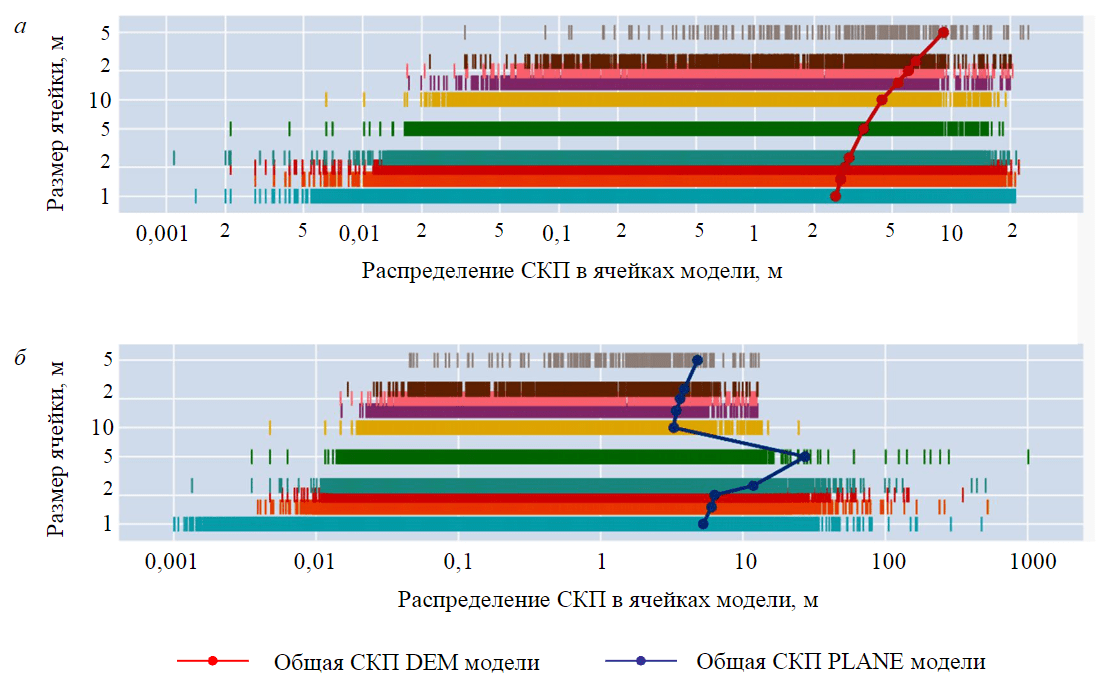
Fig.3. Distribution of RMSE of single segments in: а – DEM; b – PLANE model
In all cases, both for DEM and PLANE models, the calculated value of the general RMSE of model is shifted from the median value of the error distribution of the individual segment that make up it to a larger side, which is also a consequence of gross unresolved errors in individual segment of the model.
To correct detected shifts, segments were filtered that contain RMSE values exceeding the upper limit of the statistically significant sample of the model under consideration:
where IQR is the interquartile range (the difference between the quartiles of the sample Q3 and Q1 are the values separating the first 75 and 25 % of the total number of values in the ordered row of RMSE segments of the model, respectively).
The choice of formula (4) to determine the acceptable RMSE value and the rejection of other statistical criteria for finding outliers was made based on the fact that the overall distribution of errors of individual segments within the model has a significant left-sided asymmetry, as can be seen in the scattering diagrams (Fig.3). The application of formula (4) gives greater stability of the results in the case of an abnormal distribution of a random variable.
The values of the general RMSE models after filtering are shown in Fig.4. The graphs show that after filtering out the segments containing outliers, the type of dependence of the change in the RMSE of the model assumes a smooth character in all cases. At the same time, the type of dependence for each of the considered objects has some characteristic features, explained by the individual distribution of relief within the grid of the segmented model. It is worth noting that the shape of the error distribution curves of the DEM and PLANE models is similar within each of the studied objects, as well as the fact that the RMSE of the PLANE model is 1.5-10 times smaller than that of the corresponding DEM model.
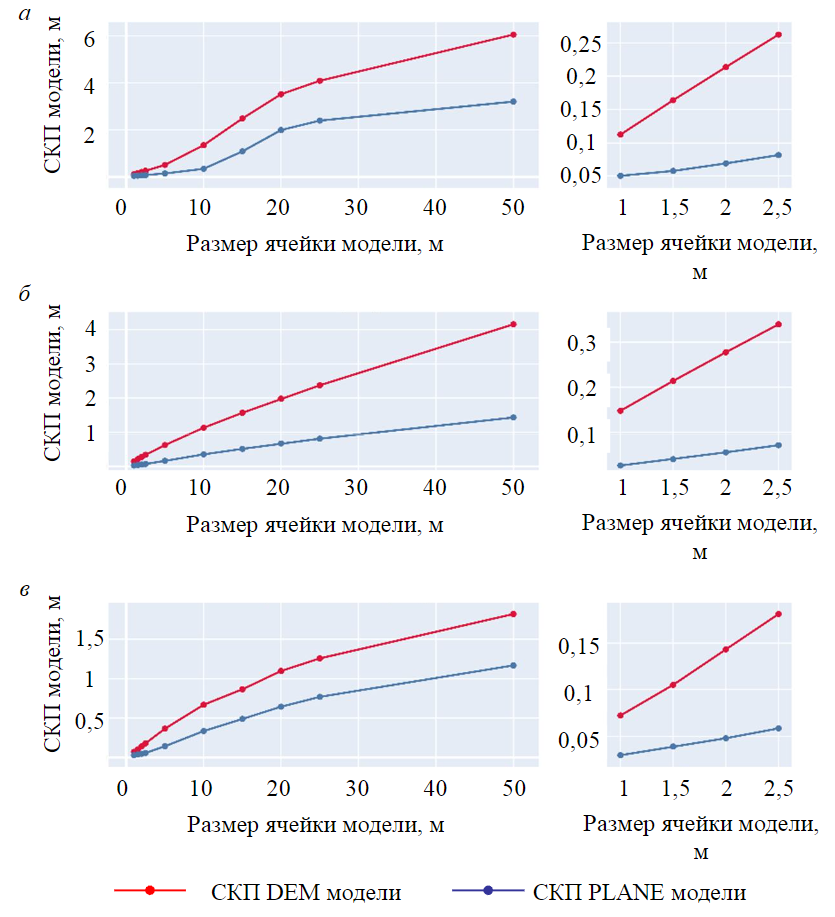
Fig.4. Dependence of the RMSE of segmented models on the segment size after filtration step for the objects: a – limestone quarry; b – phosphogypsum dump; c – peat deposit

Fig.5. RMSE distribution of segments
in PLANE model of the limestone quarry for segment size 2.5 m
Figure 5 shows a map of the error distribution of the PLANE model of the limestone quarry object after filtration step. Visual analysis shows that even despite the large size of the segments, the dominant area of the model is determined with errors not exceeding 10 cm, which meets the requirements for mine graphic documentation. Rare values that exceeded 10 cm are localized in areas containing the objects not typical for the main model, for example, oversize marking the safety berm, dumps slopes, vegetation, buildings in the northern part of the pit, etc.
Conclusion
The quality and content of each model is unique to each survey. The total error of the model consists of a number of weakly correlated factors that determine the quality of the internal and external orientation of the model and the measurement error during the survey. The complexity of determining and controlling these factors in practice often leads to results of unpredictable and unsatisfactory quality; therefore, the possibility of a posteriori evaluation of the accuracy of the resulting model acquires additional value [17].
The proposed modelling method allows comparing each element with a measure of its accuracy. The resulting PLANE models correspond in their accuracy to the requirements of mine graphic documentation, and the sequence of the experiment performed and the processing of its results can be considered as a tool for complex analysis of the quality of the resulting point clouds.
Despite the fact that the obtained research results solve the problems formulated in the introductory part, the described approaches are rather a tool that provides extensive opportunities for solving mining and technical problems. The volume of data after the approximation of the initial point clouds decreased by 100-300 times for a model with a segment size of one meter, and even higher values for larger segments. In the future, all this will make it possible to use models not only for solving engineering problems, but also for deep learning of neural networks in predicting geodynamic manifestations, computer vision in unmanned control of mining equipment, and many other tasks.
References
- Tsyglianu P.P., Romasheva N.V., Fadeeva M.L., Petrov I.V. Engineering projects in the russian fuel and energy complex: actual problems, factors and recommendations for development. Ugol. 2023. N 3, p. 45-51 (in Russian). DOI: 10.18796/0041-5790-2023-2-45-51
- Borisov M., Simić R., Petrović V.M., Milinčić M. Analiza kvaliteta 3D modela zasnovanih na digitalnoj fotogrametriji. Geodetski glasnik. 2021. Vol. 52, p. 5-26.
- Urazbayev G.M., Altayeva A.A., Kozhayev Z.T., Mustafin M.G. Geodetic monitoring of deformations of engineering structures. Complex Use of Mineral Resources. 2021. Vol. 317. N 2, p. 69-77. DOI: 10.31643/2021/6445.20
- Sablin M.V., Borger E.B., Kutepov Yu.I. et al. Geomechanical study of coal series mining in the Ruban Mine under hydraulic fill of open pit. Mining Informational and Analytical Bulletin. 2019. N 6, p. 124-135 (in Russian). DOI: 10.25018/0236-1493-2019-06-0-124-135
- Ponomarenko M.R., Kutepov Yu.I., Shabarov A.N. Open pit mining monitoring support with information and analysis using web mapping technologies. Mining Informational and Analytical Bulletin. 2022. N 8, p. 56-70 (in Russian). DOI: 10.25018/0236_1493_2022_8_0_56
- Choker H.M., Mustafin M.G. Geodesic support of laser scan technology use for fixing cultural heritage objects. Geodesy and Cartography. 2020. Vol. 82. N 2, p. 2-10 (in Russian). DOI: 10.22389/0016-7126-2021-968-2-2-10
- Ferrero A.M., Migliazza M., Roncella R., Rabbi E. Rock slopes risk assessment based on advanced geostructural survey techniques. Landslides. 2011. Vol. 8, p. 221-231. DOI: 10.1007/s10346-010-0246-4
- Abellan A., Derron M.H., Jaboyedoff M. “Use of 3D Point Clouds in Geohazards” Special Issue: Current Challenges and Future Trends. Remote Sensing. 2016. Vol. 8. Iss. 2. № 130. DOI: 10.3390/rs8020130
- Mustafin M.G., Nguyen H.V. The Estimation of the Building’s Vertical Shifts and Construction Groundworks on the Basis of Deformation Network Element Analysis. Geodesy and Cartography. 2019. Vol. 80. N 3, p. 11-19 (in Russian). DOI: 10.22389/0016-7126-2019-945-3-11-19
- Brigadnov I., Lutonin A., Bogdanova K. Error State Extended Kalman Filter Localization for Underground Mining Environments. Symmetry. 2023. Vol. 15. Iss. 2. N 344. DOI: 10.3390/sym15020344
- Krotenok A.Yu., Shurygin D.N., Litovchenko T.V. et al. Photogrammetry of images of air drones and ground-based laser scanning in open pit mine planning. Mining Informational and Analytical Bulletin. 2017. N 12, p. 50-55 (in Russian). DOI: 10.25018/0236-1493-2017-12-0-50-55
- Budarova V.A., Martynova N.G., Sheremetevsky A.V., Privalov V.A. Ground-based laser scanning of industrial sites on the territory of oil and gas fields. Moscow economic journal. 2019. N 6, p. 8-14 (in Russian). DOI: 10.24411/2413-046X-2019-16004
- Ponomarenko M.R., Kutepov Yu.I., Volkov M.A., Grinuk A.P. Satellite methods within integrated land surface deformation monitoring in a mine field. Mining Informational and Analytical Bulletin. 2020. N 12, p. 103-113 (in Russian). DOI: 10.25018/0236-1493-2020-12-0-103-113
- Samylovskaya E., Makhovikov A., Lutonin A. et al. Digital Technologies in Arctic Oil and Gas Resources Extraction: Global Trends and Russian Experience. Resources. 2022. Vol. 11. Iss. 3. N 29. DOI: 10.3390/resources11030029
- Chibunichev A.G., Mikhailov A.P., Starshov V.V. Automatic construction of a dense point cloud based on a set of images based on a semi-global method of identifying the corresponding points. Izvestiya vysshikh uchebnykh zavedenii. Geodeziya i aerofotosemka. 2015. N 2, p. 14-18 (in Russian).
- Rosnell T., Honkavaara E. Point Cloud Generation from Aerial Image Data Acquired by a Quadrocopter Type Micro Unmanned Aerial Vehicle and a Digital Still Camera. Sensors. 2012. Vol. 12. Iss. 1, p. 453-480. DOI: 10.3390/s120100453
- GusevV.N., Blishchenko A.A., Sannikova A.P. Study of a set of factors influencing the error of surveying mine facilities using a geodetic quadcopter. Journal of Mining Institute. 2022. Vol. 254, p. 173-179. DOI: 10.31897/PMI.2022.35
- Martino S., Mazzanti P. Integrating geomechanical surveys and remote sensing for sea cliff slope stability analysis: the Mt. Pucci case study (Italy). Natural Hazards and Earth System Sciences. 2014. Vol. 14. Iss. 4, p. 831-848. DOI: 10.5194/nhess-14-831-2014
- Novozhenin S.U., Bogdanova K.A., Kempler A.K. Comparative analysis of modelling methods of the tunnel construction harmful effect. Journal of Physics: Conference Series. 2019. Vol. 1333. Iss. 3. N 032059. DOI: 10.1088/1742-6596/1333/3/032059
- Brigida V.S. Data analysis for the formation of spatial geoecological models. Ecology. Economy. Informatics. System analysis and mathematical modeling of ecological and economic systems. 2022. Vol. 1. N 7, p. 108-114 (in Russian). DOI: 10.23885/2500-395X-2022-1-7-108-114
- Ghadi Y. 3D Modelling of Earth Kinematics in Palestine for GNSS and Geodetic Time-Dependent Positioning. International Journal of Recent Technology and Engineering. 2019. Vol. 8. Iss. 3, p. 6034-6039. DOI: 10.35940/ijrte.C5577.098319
- Riquelme A.J., Tomás R., Abellán A. Characterization of rock slopes through slope mass rating using 3D point clouds. International Journal of Rock Mechanics and Mining Sciences. 2016. Vol. 84, p. 165-176. DOI: 10.1016/j.ijrmms.2015.12.008
- Yunusov A.G., Jdeed A.J., Begliarov N.S., Elshewy M.A. Assessment of automatic segmentation accuracy with various point cloud density. Geodesy and Cartography. 2020. Vol. 81. N 7, p. 47-55 (in Russian). DOI: 10.22389/0016-7126-2020-961-7-47-55
- Chenlei Lv, Weisi Lin, Baoquan Zhao. Approximate Intrinsic Voxel Structure for Point Cloud Simplification. IEEE Transactions on Image Processing. 2021. Vol. 30, p. 7241-7255. DOI: 10.1109/TIP.2021.3104174
- Gezawa A.S., Bello Z.A., Qicong Wang, Lei Yunqi. A voxelized point clouds representation for object classification and segmentation on 3D data. Journal of Supercomputing. 2022. Vol. 78, p. 1479-1500. DOI: 10.1007/s11227-021-03899-x
- Li Pengfei, Zhang Xiaochen, Yan Lu et al. Comparison of interpolation algorithms for DEMs in topographically complex areas using airborne LiDAR point clouds. Transactions of the Chinese Society of Agricultural Engineering. 2021. Vol. 37. N 15, p. 146-153. DOI: 10.11975/j.issn.1002-6819.2021.15.018
- Valkov V.A., Vinogradov K.P., Valkova E.O., Mustafin M.G. Creating highly informative rasters based on laser scanning and aerial photography data. Geodesy and Cartography. 2022. Vol. 83. N 11, p. 40-49 (in Russian). DOI: 10.22389/0016-7126-989-11-40-49
- Donnellan A., Parker J., Heflin M. et al. Improving access to geodetic imaging crustal deformation data using GeoGateway. Earth Science Informatics. 2022. Vol. 15. Iss. 3, p. 1513-1525. DOI: 10.1007/s12145-020-00561-7
- Liang He, Junru Zhang, Suozhong Chen et al. Three-dimensional hydrogeological modeling method and application based on TIN-GTP-TEN. Earth Science Informatics. 2022. Vol. 15. Iss. 1, p. 337-350. DOI: 10.1007/s12145-021-00727-x
- Yong Li, Yinzheng Luo, Xia Gu et al. Point Cloud Classification Algorithm Based on the Fusion of the Local Binary Pattern Features and Structural Features of Voxels. Remote Sensing. 2021. Vol. 13. Iss. 16. N 3156. DOI: 10.3390/rs13163156
- Lingchen Lin, Kunyong Yu, Xiong Yao et al. UAV Based Estimation of Forest Leaf Area Index (LAI) through Oblique Photogrammetry. Remote Sensing. 2021. Vol. 13. Iss. 4. N 803. DOI: 10.3390/rs13040803
- Blishchenko A.A., Sannikova A.P. Analysis of the possibility of surveying the forest fund using UAVS. Vestnik Siberian State University of Geosystems and Technologies. 2022. Vol. 27. N 1, p. 42-51 (in Russian). DOI: 10.33764/2411-1759-2022-27-1-42-51
- Sannikova A.P., Dobryansky I.A., Voloshina E.A. Problems of modern mine surveying and geodetic support for open pit mines. Natural and technical sciences. 2022. N 4 (167), p. 91-94 (in Russian). DOI: 10.25633/ETN.2022.04.10
- Kurkov V.M., Kiseleva A.S., Chibunichev A.G. Investigation of the accuracy of a digital terrain model based on the materials of unmanned aerial photography and aerial laser scanning. Proizvodstvennye sistemy budushchego: opyt vnedreniya Lean i ekologicheskikh reshenii: Materialy mezhdunarodnoi nauchno-prakticheskoi konferentsii, 13-14 aprelya 2022, Kemerovo, Rossiya. Kemerovo: Kuzbasskii gosudarstvennyi tekhnicheskii universitet imeni T.F.Gorbacheva, 2022, p. 309.1-309.9 (in Russian).
- Boliang Guan, Shujin Lin, Ruomei Wang et al. Voxel-based quadrilateral mesh generation from point cloud. Multimedia Tools and Applications. 2020. Vol. 79. Iss. 29-30, p. 20561-20578. DOI: 10.1007/s11042-020-08923-5