
Laboratory, numerical and field assessment of the effectiveness of cyclic geomechanical treatment on a tournaisian carbonate reservoir
- 1 — Ph.D., Dr.Sci. Deputy Director for Research Oil and Gas Research Institute RAS ▪ Orcid
- 2 — Ph.D. Associate Professor Almetyevsk State Oil Institute ▪ Orcid
- 3 — Ph.D. Researcher Oil and Gas Research Institute RAS ▪ Orcid
- 4 — Ph.D. Deputy Head of Department Structural Division Tatneft-Dobycha, Tatneft PAO ▪ Orcid
- 5 — Deputy Head of Division Structural Division Tatneft-Dobycha, Tatneft PAO ▪ Orcid
- 6 — Chief Specialist Structural Division Tatneft-Dobycha, Tatneft PAO ▪ Orcid
- 7 — Junior Researcher Oil and Gas Research Institute RAS ▪ Orcid

Abstract
Results are discussed for evaluation of effectiveness of the cyclic geomechanical treatment (CGT) on a Tournaisian carbonate reservoir. Analysis of laboratory experiments performed according to a special program to assess permeability changes for Tournaisian samples under cyclic changes in pore pressure is presented. The main conclusion is the positive selectivity of the CGT: an increase in permeability is observed for samples saturated with hydrocarbons (kerosene) with connate water, and maximal effect is related to the tightest samples. For water-saturated samples, the permeability decreases after the CGT. Thus, the CGT improves the drainage conditions for tight oil-saturated intervals. It is also confirmed that the CGT reduces the fracturing pressure in carbonate reservoirs. Using flow simulations on detailed sector models taking into account the results of laboratory experiments, a possible increase in well productivity index after CGT with different amplitudes of pressure variation was estimated. Results of a pilot CGT study on a well operating a Tournaisian carbonate reservoir are presented, including the interpretation of production logging and well testing. The increase in the well productivity index is estimated at 44-49 % for liquid and at 21-26 % for oil, with a more uniform inflow profile after the treatment. The results of the field experiment confirm the conclusions about the mechanisms and features of the CGT obtained from laboratory studies and flow simulations.
The presented results were obtained within the joint research of ASOI and PAO Tatneft, and fulfillment of the state as-signment of OGRI RAS, topic “Improving the methods of modelling, laboratory and field studies for creation of new technologies for efficient environmentally friendly hydrocarbon recovery in complex mining and geological conditions” (122022800272-4)
Introduction
Oil companies are paying more attention to the significant hydrocarbon reserves in carbonate reservoirs. At the same time, the efficiency of their recovery is lower than for terrigenous formations. The growing interest of the subsoil users is the driving force for the development of technologies aimed specifically at carbonate reservoirs. The method of cyclic geomechanical treatment (CGT) consists in organizing high-amplitude pressure cycles on the well with successive creation of drawdown and overpressure. The proposed mechanism of influence is associated with the formation of a decompaction zone around the well with improved flow properties. Carbonate rocks are brittle and contain in their structure, along with primary voids, a system of natural fractures of various sizes [1]. The reservoir is deformed under the influence of changing effective stresses during field development, and these processes are studied using the methods and models of geomechanics [2, 3].
Theoretical, experimental and numerical geomechanical studies of carbonate reservoirs are used to solve various problems:
- predicting the parameters of natural fractures [4] and the impact of faults on the stress distribution in the carbonate reservoir [5] to optimize well placement;
- improving the design of proppant [6] and acid [7] hydraulic fracturing (HF) for efficient production of hydrocarbons from tight, low-permeability carbonate reservoirs;
- assessing the mutual influence of hydrodynamic processes and changes in the stress-strain state on the flow parameters of the rock matrix and the fracture system during gas production [8];
- selecting the optimal method for enhanced oil recovery, taking into account the influence of the composition of injected water on the dynamics of deformation processes [9];
- predicting the impact of acid treatment on the mechanical stability of the wellbore and reservoir compaction in the vicinity of stimulated horizontal wells [10];
- evaluating the impact of thermal [11] and geochemical [12, 13] processes during underground storage of carbon dioxide on changes in the geomechanical characteristics of a carbonate reservoir and associated risks of leakage;
- taking into account the different nature and quantitative characteristics of the rock matrix and reservoir fractures deformations according to experimental data for more accurate prediction of rock subsidence during depletion of deposits [14] and optimization of well operation modes [15], etc.
The possibility to increase the permeability of a carbonate rock in the near-wellbore zone by a deep decrease and subsequent restoration of pressure was experimentally shown by a group of researchers led by S.N.Zakirov in relation to the Tengiz field in the late 1980s, which resulted in the patent [16]. The suggested acting mechanism is associated with the initiation of microfractures due to shear failure that occurs in the reservoir rock under high effective stresses. A similar method, the geo-loosening, was presented in [17], and it formed a basis of technologies for bringing drilled wells into production [18] and improving the productivity of existing wells [19]. The study [20] describes an example of its application to increase the injectivity of an injection well. In [21], the specifics of permeability changes with a decrease in bottomhole pressure are classified depending on the type and properties of the reservoir. Laboratory core studies on the independent triaxial loading unit to justify the parameters of the method application are considered in [22]. An example of the laboratory core studies and the results of joint geo-loosening implementation with acid treatment for two wells are presented in [23]. The patent [24] describes an improved modification of the method, the directional unloading method. The efficiency is increased by creating stress concentrators in the bottomhole zone, for example, by perforation. The paper [25] describes the results of laboratory studies in relation to the directional unloading method on core samples of the Achimov deposits of the Urengoy field.
A similar stimulation method, called the hydrodynamic reservoir compression (HRC), is described in [26]. It is implemented during a well workover by swabbing or with a jet pump. According to the results of well testing and production logging (PLT), a significant increase in well productivity and drained effective thicknesses was noted during the pilot works. A noticeable improvement in the parameters of the remote reservoir zone was also reported, which raises doubts given the nature of the impact. Perhaps the results can be explained by bringing the additional formation intervals into production.
The patent [27] proposed the CGT method, and the paper [28] considers the specifics of its implementation. In contrast to the methods yet described, the CGT supplements the deep depression half-cycle with the subsequent overpressure half-cycle for opening and further growth of the created microfractures. In contrast to the HF method, based on the creation of a single predominant tensile fracture, the CGT method initiates the formation of a more uniform zone of fracturing (decompaction) in the near-wellbore region. Thus, the method is aimed not only at increasing the well productivity, but also at improving the uniformity of reservoir drainage and hydrocarbon recovery by means of the complex impact on wells of the treated area. The study [29] describes a natural manifestation of a similar effect of increasing productivity of wells during periodic operation in a carbonate reservoir.
The papers [30, 31] describe the results of specialized laboratory experiments on carbonate core samples from the Tournaisian and Bashkirian formations in the Republic of Tatarstan to assess the changes in permeability and elastic moduli under cyclic pressure changes. The effect of the obtained dependences on the dynamics of pressure distribution and uniformity of oil recovery was estimated by numerical simulations in [32]. Experimental and numerical studies have shown that the CGT method is of interest for further consideration in relation to the main carbonate deposits of the Volga-Ural region.
In this paper, we present the results of assessing the potential efficiency and features of the CGT method for Tournaisian reservoirs based on a complex of laboratory, numerical and field studies.
Methods. For the laboratory experiments, six core samples from the Tournaisian formation were selected, 61 mm in length and 30 mm in diameter. Key parameters of the core samples are given in Table 1.
Table 1
Parameters of the Tournaisian core samples
|
Sample |
Depth, m |
Lithology |
Porosity, % |
Gas permeability, mD |
Fluid |
Connate water saturation, % |
|
2 |
1224.29 |
Limestone |
14.24 |
484 |
Kerosene |
10.81 |
|
5k |
1224.67 |
12.88 |
270 |
Kerosene |
14.33 |
|
|
6 |
1224.71 |
12.31 |
60 |
Kerosene |
19.04 |
|
|
1 |
1222.04 |
10.41 |
126 |
Water |
– |
|
|
3 |
1223.59 |
13.50 |
156 |
Water |
– |
|
|
5w |
1228.25 |
14.10 |
31 |
Water |
– |
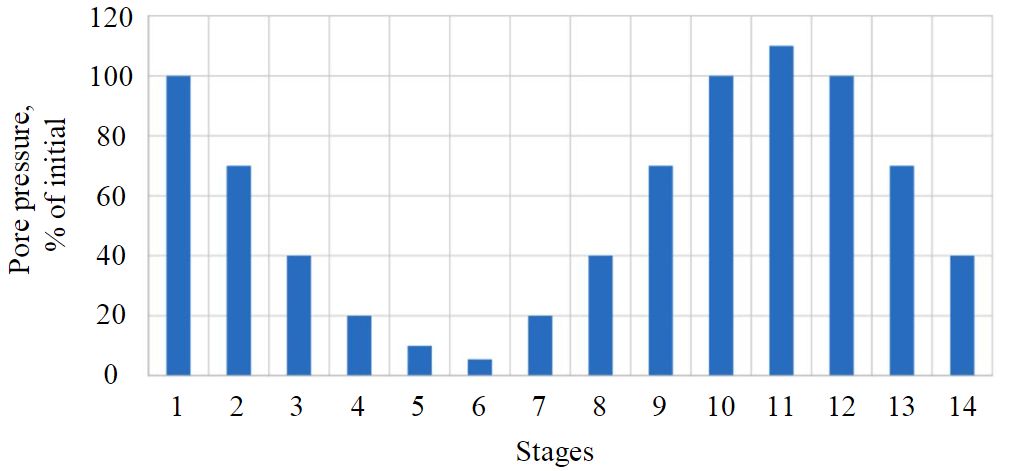
Fig.1. Stages of the experiment
The experiments were carried out on the PIK-UIDK/PL installation unit at the Geomechanics Lab of TatNIPIneft Institute according to the program developed by the authors. To assess the effect of core saturation, two fluid options were used: formation water model or kerosene. Connate water saturation was preliminarily created in the samples saturated with kerosene.
The studies were performed under (pseudo-) triaxial loading conditions modeling the typical vertical stress for the studied reservoir (axial load on the sample) and the minimum horizontal stress (confining pressure) estimated by the Eaton’s formula [3]. During the experiment, a cyclic change in the pore pressure was implemented in accordance with the program (Fig.1). The initial pore pressure was equal to the initial reservoir pressure of the studied formation.
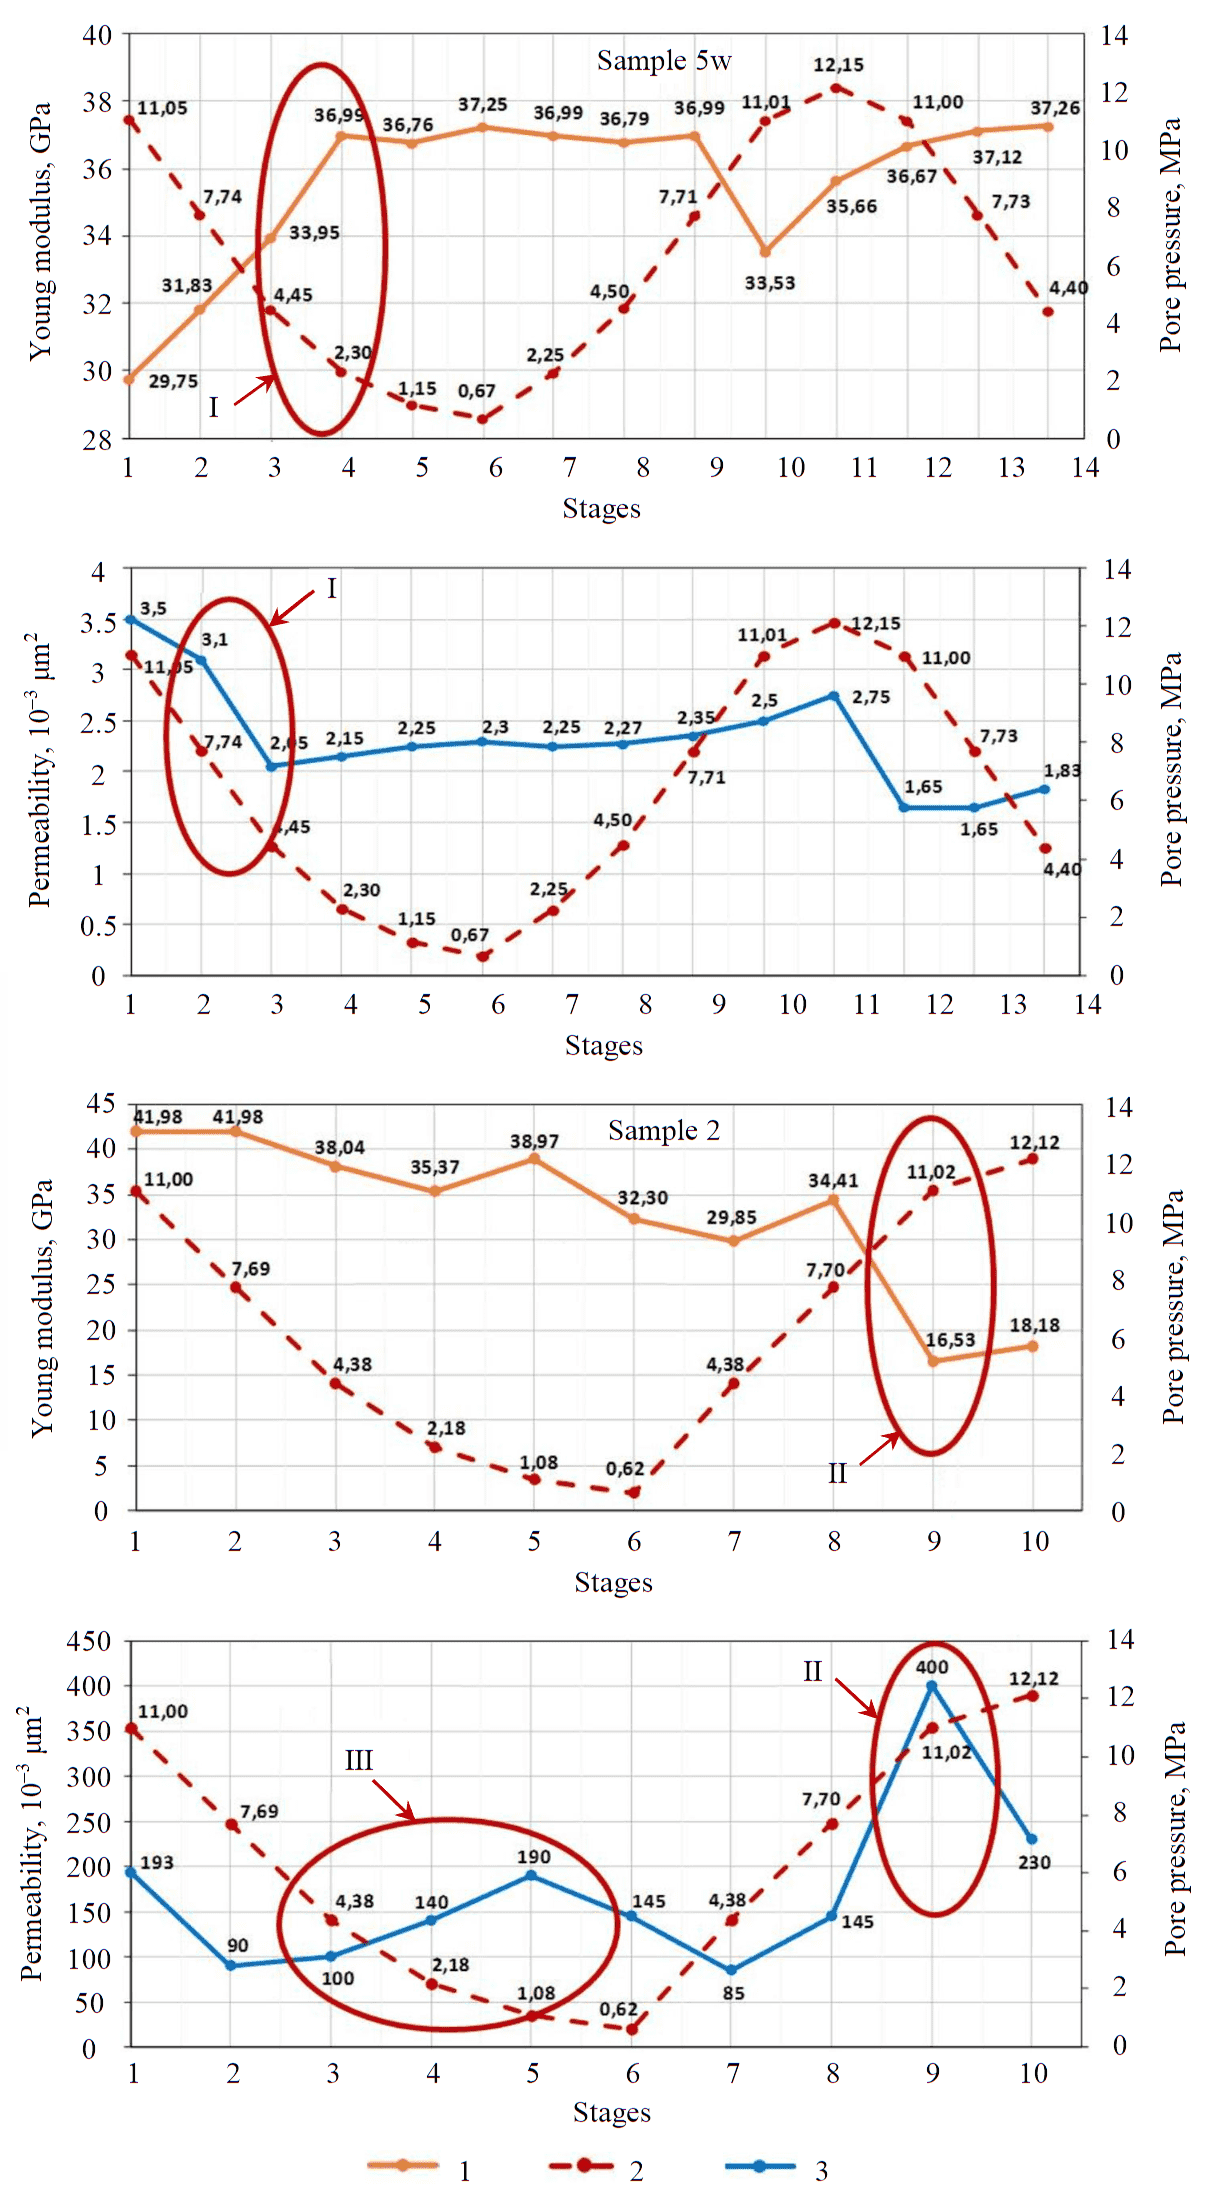
Fig.2. Results of the lab experiments for samples saturated with water (a, b) and kerosene with connate water (c, d) 1 – Young modulus; 2 – pore pressure; 3 – permeability I – compaction; II – tensile fracture; III – decompaction (loosening) under compression
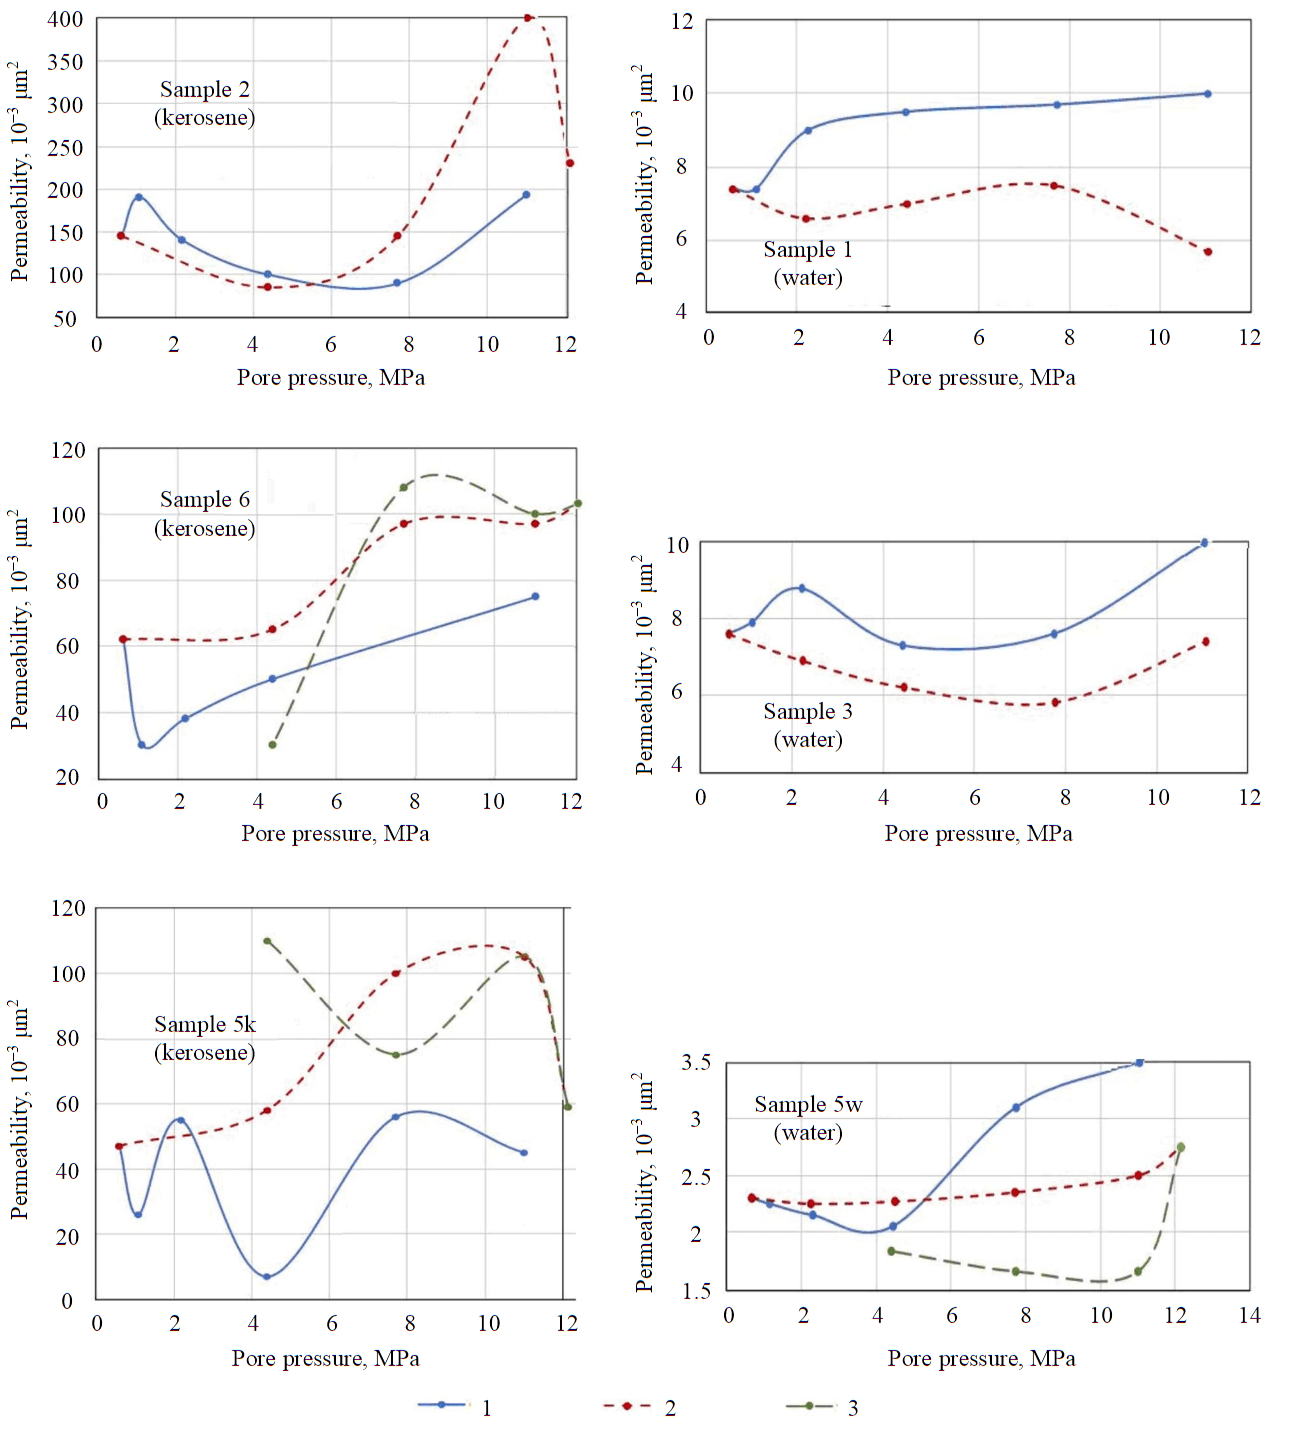
Fig.3. Results of the lab experiments: permeability in the hysteresis cycles of changing pore pressure 1 – primary pressure decrease; 2 – pressure increase; 3 – secondary pressure decrease
At each stage of the experiment, the pore pressure was kept constant. The saturating fluid was pumped at a flow rate of 0.1 cm3/min until the pressure drop stabilized, and the current permeability was determined. The time to reach stabilization was about two hours on average. Also, the acoustic method was used to estimate current values of the dynamic elastic moduli, Young's modulus and Poisson's ratio. The typical results for two samples are shown in Fig.2. Figure 3 shows the permeability of the studied samples as a function of pore pressure in the hysteresis cycles of primary pressure decrease – pressure increase – secondary pressure decrease.
For water-saturated samples, compaction (decrease or no change in permeability with increasing Young's modulus) is noted during the primary pressure decrease, with a further decrease or slight increase in permeability under subsequent pressure increase.
This behavior of a water-saturated carbonate reservoir is explained by the effect known as the “water induced compaction”. The best-known manifestation of this effect and a significant amount of studies are related to the chalk rocks of the Ekofisk field in the North Sea [33]. Later, the effect of chalk rock compaction under the influence of water was also considered in relation to other reservoirs [34], in particular, as a possible mechanism for increased oil recovery during low-salinity waterflooding [35]. The term “water weakening” is also used for various effects of rock mechanical strength reduction in contact with water – for example, increased sanding of flooded wells in weakly cemented sandstones [36] or decreased strength of tight and shale rocks around the HF fractures due to the contact with fracturing fluid [37]. Also, weakening under the influence of water was noted as one of the factors leading to man-made earthquakes during waterflooding of a depleted reservoir [38].
Samples saturated with kerosene demonstrated a different type of behavior. All of them showed signs of decompaction of the internal structure under the action of compressive stresses with a decrease in pore pressure, and a subsequent increase in permeability with increasing pressure due to the opening of the formed microfractures. Also a number of samples indicated a characteristic sharp increase in permeability with a decrease in Young's modulus when the initial pressure was exceeded, corresponding to the formation of a tensile fracture due to decompaction. The effect of increased permeability was preserved at the stage of secondary pressure reduction to the initial or lower values.
In addition to saturation, the behavior of flow properties under changes in pore pressure is also dependent on the initial parameters of the samples. Samples with lower values of Young's modulus and higher values of porosity, i.e. originally “looser” with probable presence of microfractures, are characterized by a more intense decrease in permeability during primary pressure reduction. This is consistent with the results of [39] for carbonate reservoirs of the Tournaisian-Famennian formation of the Upper Kama region. For tighter samples, the largest increases in permeability were obtained as the result of the CGT.
A joint analysis of the results of the considered laboratory experiments and previous studies described in [30, 31] is shown in Fig.4. Here the permeability increase factors and are displayed versus the porosity and the initial dynamic Young's modulus of the samples, where k1 is the permeability at the initial reservoir pressure at the primary pressure reduction stage; is the permeability at the initial reservoir pressure at the secondary pressure reduction stage; is the minimum permeability value during the primary pressure reduction stage.
Figure 4 confirms the effect of saturation on the permeability behavior. Almost all samples saturated with kerosene showed an increase in the permeability measured at the initial reservoir pressure at the end of the cycles as compared to the permeability at the beginning of the experiment: . The exception was the sample studied with partial violation of regimes, so it was not taken into account in further analysis (in Fig.4 it corresponds to the square orange marker with the maximum porosity value and the minimum Young's modulus value). For all samples saturated with water, the permeability decreased: . Similar conclusions are valid for the ratio of the permeability measured at the initial reservoir pressure at the end of the cyclic treatment to the minimum permeability: . This ratio reflects the effect of the CGT as compared to the state of a depleted reservoir. A direct relation can also be seen between the increase in permeability and the original elastic properties of the samples: the ratio tends to increase with an increase in the initial dynamic Young's modulus, which corresponds to a higher effect from the CGT in tight reservoir intervals. Dependences on porosity are not evident, which can be explained by the influence of the complex void structure of the samples (porous matrix, microfractures).
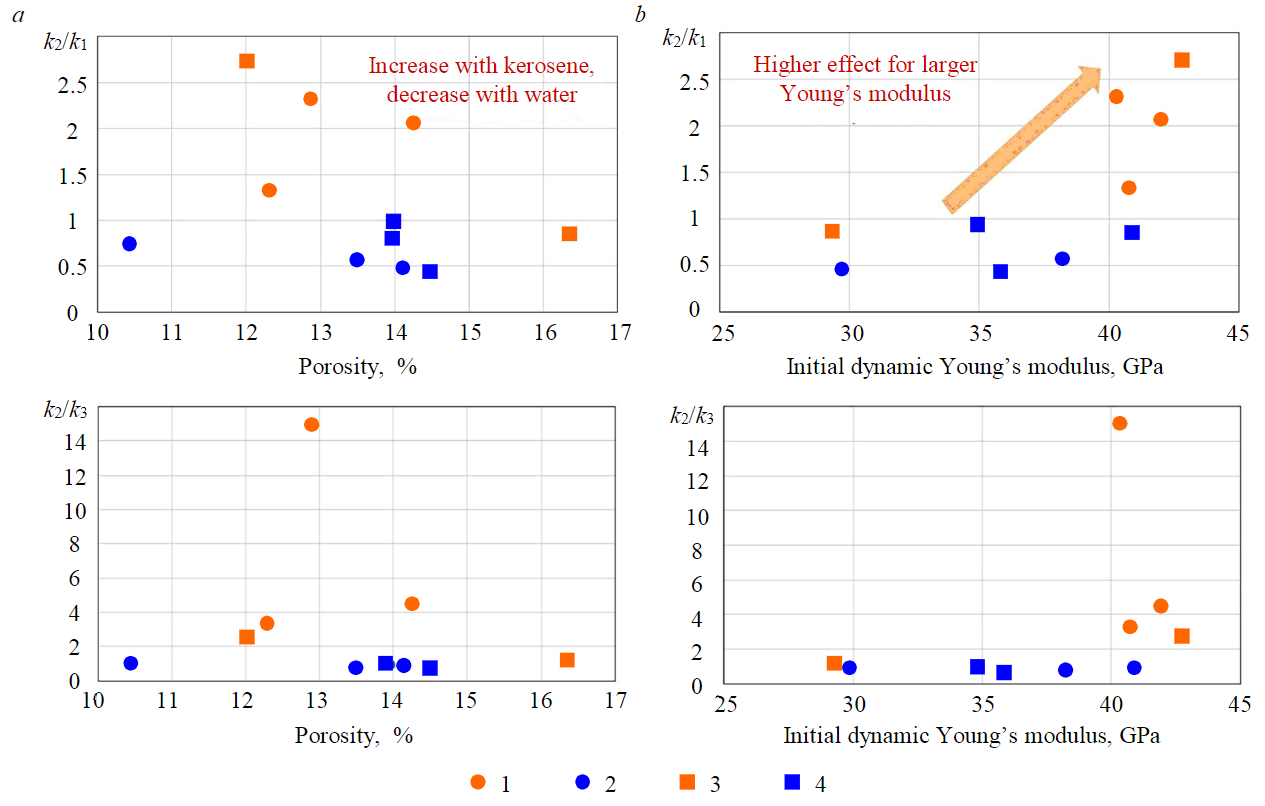
Fig.4. Increase in permeability versus porosity (a) and initial Young’s modulus (b) of the samples Samples saturated with: 1 – kerosene (2020); 2 – water (2020); 3 – kerosene (2019); 4 – water (2019)
Thus, from the analysis of the experimental data one can expect to increase permeability by the CGT in the non-flooded intervals of the Tournaisian reservoir, while maintaining or reducing the permeability of the flooded intervals. Both factors are positive for producing wells. For injection wells, a decrease in injectivity in the flooded intervals is not unlikely, but it is possible to involve non-pay or weakly contributing intervals into production.
Table 2 compares the theoretical estimates of the HF pressure and the actual pressures of the tensile fracture onset for samples, which showed such evidence. As the signs of the fracture onset, a sharp decrease in the Young's modulus below its original value and/or a sharp increase in the sample permeability were accepted. It is shown for all samples that the actual pressure of the fracture onset is significantly lower than the theoretical one, which may indicate a decrease in the sample strength during the CGT and opening of the microfractures formed at the stages of deep decrease and subsequent increase in pore pressure.
Table 2
Relation of the actual and theoretical HF pressures for the Tournaisian samples
|
Sample |
HF pressure |
Sample |
HF pressure |
||
|
Theoretical(confining pressure), MPa |
Actual, MPa |
Theoretical(confining pressure), MPa |
Actual, MPa |
||
|
2020 |
2019 |
||||
|
2 (kerosene) |
14.21 |
11.02 |
2 (water) |
17.45 |
13.6 |
|
5w (water) |
12.15 |
3 (water) |
13.8 |
||
|
5k (kerosene) |
11.02 |
4 (kerosene) |
13.6 |
||
|
6 (kerosene) |
12.12 |
||||
Numerical simulation
The hysteresis permeability curves obtained from the core studies were used to estimate the increase in the well productivity index (PI) by the CGT with different amplitudes of the bottomhole pressure changes. A sector model with a quasi-uniform grid along the Ox and Oy axes and a single vertical layer was used for numerical simulations of the CGT on a carbonate reservoir. The minimum size of 0.5 × 0.5 m corresponded to the central cell with the well. The optimal factor for increasing the cell sizes from the center was chosen through a series of test calculations and equaled to q = 1.1. This made possible to model in detail the pressure distribution in the near-wellbore zone in order to correctly determine the changes in permeability, taking into account the distance from the well. The properties of the dynamic system, the initial values of permeability and porosity, relative permeability curves, initialization data, fluid properties, were borrowed from the flow simulation model of a real Tournaisian reservoir.
The simulations were performed with the Rock Flow Dynamics tNavigator flow simulator. The hysteresis dependence of permeability on pressure was taken from one of the studied samples saturated with kerosene and connate water. It was implemented in the model using the ROCKTAB option with the HYSTER setting by defining a curve for the initial decrease in pressure and a series of curves for a subsequent increase in pressure, corresponding to different turning points in the pressure changing direction. The curve with the minimum turning point was plotted from the core data, and the other curves were taking into account the decrease in slope (in the effect of the impact) with the decrease in the amplitude of the primary pressure reduction [40].
To assess the increase in the PI, the CGT was considered by increasing the design well flow rate by 2 (weak impact), 3 (strong impact) or 3.5 (maximum impact) times, and then returning to the design flow rate and determining the change in the pressure drawdown. The increase in the stabilized PI value for the considered initial data was 17, 45 and 62 % for weak, strong and maximum impact, respectively [40].
The ROCKTAB option with the HYSTER setting makes it possible to set a hysteresis dependence of permeability on pressure, but not “fixing the effect” during the secondary pressure reduction and not considering the influence of water saturation. The last factor is not provided by the available options of the flow simulator used. Modeling of the CGT taking into account the variable saturation of the reservoir was implemented using the own scripts. The functionality of the scripts included the processing and analysis of the pressure and saturation distributions exported from the simulator at the report steps, and calculation of the current permeability multiplier for each grid cell, taking into account the history of pressure changes and current water saturation:
where k' is the calculated current permeability multiplier for the grid cell; Sw is the current water saturation; Swc is the connate water saturation; is the permeability multiplier corresponding to the oil-saturated reservoir at current pressure with account for hysteresis (by relation for the core sample saturated with kerosene and connate water); is the permeability multiplier corresponding to the water-saturated reservoir at current pressure with account for hysteresis (by relation for the core sample saturated with water). The resulting distribution of the permeability multiplier was used in the flow simulations until the next report step.
Using the scripts, the effect of the CGT was modeled for various scenarios of a flooded well operation in a five-spot waterflooding element (with a central production well and quarters of injection wells in the corners). A five-layer sector model with a quasi-uniform lateral grid refinement near the wells was used. Several scenarios of the CGT were considered: during waterless operation; in the presence of bottom water with manifestation of water coning; after breakthrough of injected water through a high-permeability interval. The technological effect of the CGT was estimated by the increase in the liquid and oil flow rates and change in the water cut. With the considered initial data, the increase in the stabilized oil production rate after the CGT was about 30 % for all cases. The main effect was achieved by increasing the liquid flow rate. When perforated reservoir thickness included a water-saturated interval, a short-term decrease in water cut was additionally observed, followed by a return to the previous water cut level.
Pilot field study
For practical validation of the studied effects, a pilot field study of the CGT was carried out on a well operating a Tournaisian reservoir, with a complex of well tests (pressure build-ups – PBU) and production logging tests (PLT – thermal logging) before and after the CGT, and permanent monitoring of well operation data.
Figure 5 shows a summary graph of the pilot study with the key stages, bottomhole pressure and liquid flow rate data. The duration of the study was related to a number of organizational and technical complications arising due to the lack of experience in applying the method on similar facilities.
The bottom hole pressure was recorded using two autonomous pressure gauges with sampling rates of 60 and 120 s, the readings of both are in good agreement. Until picking up the sensors, operational monitoring of the bottom hole pressure was carried out by the flowing level measurements with the SUDOS echosounder.
The main expected effect of the CGT is the increase in well productivity due to the formation of a decompaction area (microfractures) in the near-wellbore zone during the creation a deep drawdown, and the subsequent opening of the created microfractures and/or formation of tensile fractures (with no fixation) at the stages of reverse pressure increasing (PBU) and injection. As the results of the core studies show, the effect of increased permeability is preserved during further well operation with drawdown creation, i.e. the initiated fractures do not completely close.
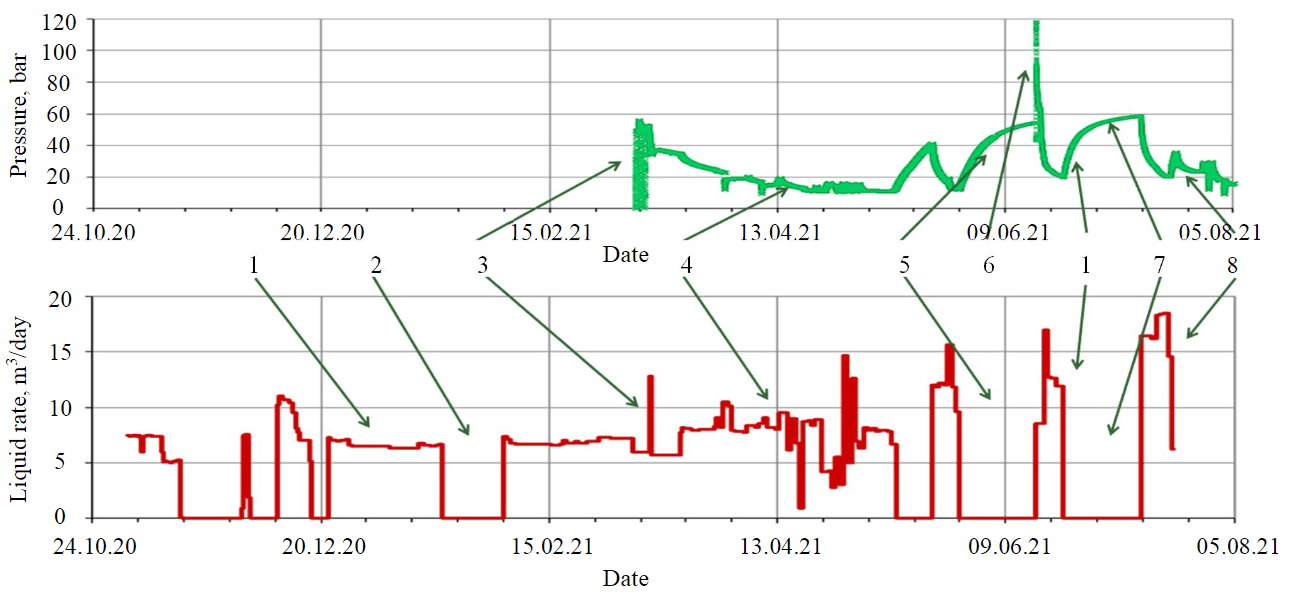
Fig.5. Summary graph of the CGT pilot field study 1 – production stabilization; 2 – PBU 1; 3 – production stabilization, PLT 1; 4 – production with increasing pressure drawdown; 5 – PBU 2; 6 – oil injection; 7 – PBU 3; 8 – production stabilization, PLT 2
For the field assessment of the effect, the following strategy of the pilot study was proposed: putting the well into production until stabilization; shut-in for the PBU 1 (baseline test before the treatment); production stabilization with PLT 1 (thermal logging, baseline inflow profile before the treatment); production with increasing drawdowns up to the maximum one; shut-in for the PBU 2 (pre-injection parameter evaluation); oil injection; production until stabilization; shut-in for the PBU 3 (parameter evaluation after the full CGT cycle); production stabilization with PLT 2 (after the full CGT cycle).
As seen from Fig.5, the start-up after the completion of the full CGT cycle is characterized by a significant increase in the liquid flow rate (up to ~16 m3/day) and oil flow rate (up to ~12 t/day). At the same time, the bottom hole pressure is higher than at the maximum drawdown before injection, at which the liquid flow rate was ~12 m3/day and oil flow rate was ~10 t/day. Thus, the productivity increased noticeably, and the exact quantitative assessment is given below according to the well test data. The volume of liquid produced after the oil injection significantly exceeded the injected volume, and the pressure was completely redistributed as a result of the PBU 3, so the final productive characteristics reflect the actual inflow from the reservoir.
According to the results of the CGT, there is a slight increase in water cut from ~5 to 20 %. This value remains stable during further operation, i.e. watering of the well does not occur. The increase in water cut can be explained according to the PLT data by putting into drainage the upper part of the perforated interval with lower reservoir properties.
Interpretation and analysis of the PLT and PBU data
When the study was completed, the obtained data were complexly interpreted. Comparison of PLT 1 and PLT 2 makes it possible to assess changes in the inflow profile as a result of the CGT. Both PLT records are of high enough quality for this objective. Comparison of PBU 1, PBU 2 and PBU 3 makes it possible to evaluate changes in parameters of the near-bottomhole zone and PI of the well after the stage of bottomhole pressure reduction and the full cycle of CGT (similarly to the pressure change cycle in the laboratory core tests).
Figure 6 shows a comparison of the inflow profiles before (PLT 1) and after (PLT 2) the CGT according to the thermal logging data. After the CGT, involvement of upper, previously undrained interval into production is noted, as well as more uniform drainage of the perforated reservoir.
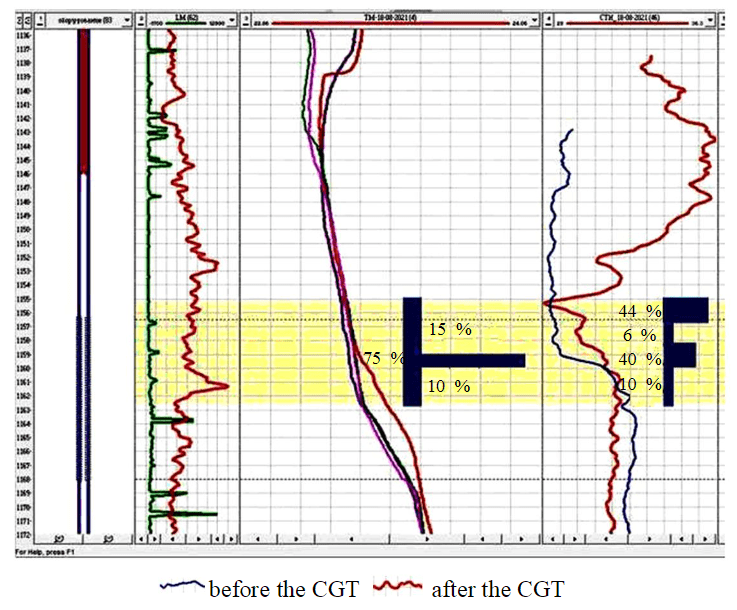
Fig.6. Comparison of the PLT data
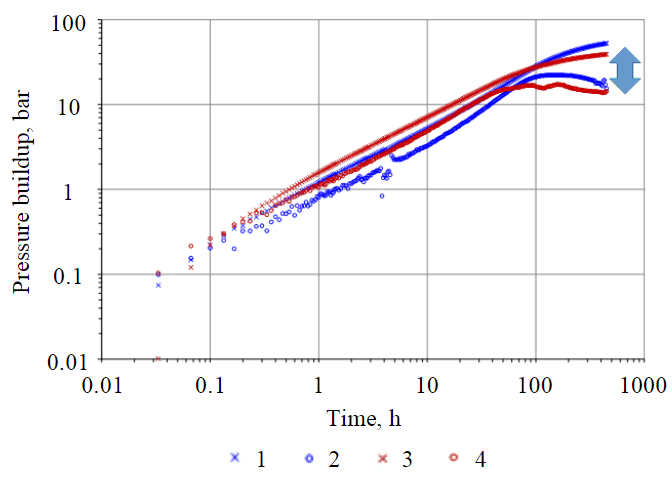
Fig.7. Bilog plots of the PBU 2 and PBU 3. 1, 3 – pressure PBU 2 and PBU 3; 2, 4 – derivative PBU 2 and PBU 3
Due to the problem with data recording by autonomous pressure gauges at PBU 1, its comparison with PBU 2 was carried out using recalculated data on flowing levels according to the echosounder. A good agreement is observed between the PBU curves for the parameters of the remote zone (conductivity) and reservoir pressure, with a slight decrease in skin factor (increase in productivity) at PBU 2.
The main effect of the CGT in the increased PI is observed after the injection stage. Figure 7 compares the bottomhole pressure records and the logarithmic derivatives on a single bilog graph according to the data of an autonomous pressure gauge for PBU 2 and PBU 3. The expected transition of the pressure derivatives to the same “level” of radial flow is seen. There is also a significant increase in productivity between PBU 2 and PBU 3. The results of the PBU interpretation are (PBU 2/PBU 3): PI 0.166/0.248 m3/day/bar; permeability 30/30 mD; skin factor –3.24/–4.34; reservoir pressure 70/70 bar. A significant decrease in skin factor and increase in PI is evident.
Discussion of the results
According to the well test data, the increase in the PI for liquid due to the CGT is estimated at 44-49 %. The result is consistent with a significant increase in the liquid flow rate compared to production data of similar previous regimes. According to the PLT data, a previously undrained interval in the top part of the reservoir was put into production as a result of the CGT. The inflow profile after the treatment covers the upper and lower parts of the reservoir more evenly. The inclusion of an undrained interval is consistent with the conclusion about the predominant effect of the CGT on the tightest intervals of the reservoir, which was obtained from the laboratory experiments.
The increase in water cut from ~5 to 20 % can also be related to the introduction of the top reservoir interval with reduced reservoir properties to production. The water cut during further well operation remained at the same average level of ~20 %. Taking into account the change in water cut, the increase in the PI for oil is estimated at 21-26 %. The main increase in the PI (decrease in the skin factor) is observed after the oil injection stage and subsequent operation at the maximum drawdown mode, i.e. after the completion of the full CGT cycle.
This result is consistent with the trends identified in laboratory experiments on core samples, where the main increase in permeability was noted at the stage of pressure increase after the creation of maximum drawdown. The probable mechanism is associated with the opening of shear microfractures formed at the previous stages, as well as with the possible onset of a tensile fracture (auto-HF) during injection, achieved by reducing the rock fracturing pressure after the previous exposure to deep drawdown. The maximum bottomhole pressure during the oil injection into the well was about 12 MPa, which is consistent with the estimates of the HF pressure after the CGT from core data (see Table 2). Also, the core results are confirmed by the fact that repeated creation of drawdown at the well did not lead to a reverse decrease in permeability of the near-wellbore zone (complete closure of the formed fractures). Hence the increase in productivity is seen at the PBU 3 and from the production rate at the final operation regime.
To assess the duration of the CGT effect, it is recommended to maintain final operation regime of the well and analyze its performance in comparison with the dynamics of neighboring wells. It is also reasonable to perform control well testing and PLT in 3-6 months. For the well under consideration, these recommendations could not be fully implemented due to elimination of technical problems occurred at the final PLT.
Conclusion
The results of the special program of laboratory experiments show a positive selectivity of the CGT. The increase in permeability is observed for samples saturated with kerosene with connate water, and the effect is maximal for the tightest samples. Permeability of water-saturated samples is decreased after the CGT. Thus, the CGT improves the conditions for drainage of tight oil-saturated intervals and decreases the fracturing pressure of the carbonate reservoir.
Numerical estimates of the increase in PI by CGT with different amplitudes were obtained, including a number of scenarios for flooded well operation. Simulations were performed on sector models with quasi-uniform grid refinement, using the hysteresis option for pressure dependence of permeability and scripts created by the authors to take into account the effect of water saturation observed from core data. Depending on initial parameters, the calculated increase in the stabilized PI amounted to 17-62 %, with the unchanged or temporary decreased water cut after the CGT.
A pilot field study was carried out with a complex of well tests and PLT to assess the efficiency of the CGT on a well operating a Tournaisian reservoir. After the CGT an increase in the PI of 44-49 % for liquid and 21-26 % for oil was obtained. Also a previously undrained interval with reduced reservoir properties in the top part of the reservoir was observed to contribute into production.
The main results and conclusions from the pilot field study – the range of estimates for the increase in PI, the achievement of the main effect after oil injection, the contribution of a previously undrained interval – are consistent with the conclusions about the mechanisms and features of the CGT obtained from the laboratory studies and numerical simulations. The duration of the CGT effect needs to be studied as part of further testing of the method. Thus, the results of the studies confirm the prospects of the CGT for carbonate reservoirs of the Tournaisian formation.
References
- Lucia F.J. Carbonate Reservoir Characterization: An Integrated Approach. 2nd Edition. Berlin: Springer Science & Business Media, 2007, p. 336. DOI: 10.1007/978-3-540-72742-2
- Fjær E., Holt R.M., Horsrud P. et al. Petroleum Related Rock Mechanics. 2nd Edition. Amsterdam: Elsevier, 2008, p. 492.
- Zoback M.D. Reservoir Geomechanics. Cambridge: Cambridge University Press, 2007, p. 505. DOI: 10.1017/CBO9780511586477
- Padhy G.S., Al-Rashidi T., Gezeeri T.M. et al. Role of Geomechanics and Integrated Reservoir Characterization in Production Enhancement from a Heterogeneous Carbonate Reservoir: A Success Story From Kuwait. SPE Middle East Oil and Gas Show and Conference, 18-21 March 2019, Manama, Bahrain. OnePetro, 2019. N SPE-194920-MS. DOI: 10.2118/194920-MS
- Zhenzhong Cai, Hui Zhang, Haijun Yang et al. Investigation of Geomechanical Response of Fault in Carbonate Reservoir and Its Application to Well Placement Optimization in YM2 Oilfield in Tarim Basin. SPE Annual Technical Conference and Exhibition, 28-30 September 2015, Houston, USA. OnePetro, 2015. N SPE-175017-MS. DOI: 10.2118/175017-MS
- Youngho Jang, Hyunsang Yoo, Wonmo Sung et al. Novel Assessment of Hydraulic Fracturing with Geomechanical Characteristics in Tight Carbonate Formations. Abu Dhabi International Petroleum Exhibition & Conference, 12-15 November 2018, Abu Dhabi, UAE. OnePetro, 2018. N SPE-192995-MS. DOI: 10.2118/192995-MS
- Islam A., Ziarani A.S., Cui A. et al. Experimental and Analytical Core and Geomechanical Data Analysis of a Tight Oil Carbonate Formation. SPE Annual Technical Conference and Exhibition, 27-29 October 2014, Amsterdam, Netherlands. OnePetro, 2014. N SPE-170943-MS. DOI: 10.2118/170943-MS
- Ahmed B.I., Al-Jawad M.S. Geomechanical modelling and two-way coupling simulation for carbonate gas reservoir. Journal of Petroleum Exploration and Production Technology. 2020. Vol. 10. Iss. 8, p. 3619-3648. DOI: 10.1007/s13202-020-00965-7
- Talebian S.H., Fahimifar A., Heidari A. Review of Enhanced Oil Recovery Decision Making in Complex Carbonate Reservoirs: Fluid Flow and Geomechanics Mechanisms. Journal of Computational Applied Mechanics. 2021. Vol. 52. Iss. 2, p. 350-365. DOI: 10.22059/JCAMECH.2021.318511.596
- Safari R., Smith C., Fragachan F. Improved Recovery of Carbonate Reservoir by Optimizing Acidizing Strategy; Coupled Wellbore, Reservoir, and Geomechanical Analysis. Abu Dhabi International Petroleum Exhibition & Conference, 13-16 November 2017, Abu Dhabi, UAE. N SPE-188683-MS. DOI: 10.2118/188683-MS
- Zareidarmiyan A., Salarirad H., Vilarrasa V. et al. Geomechanical Response of Fractured Reservoirs. Fluids. 2018. Vol. 3. N 4, p. 70-86. DOI: 10.3390/fluids3040070
- Nguyen M.T., Bemer E., Dormieux L. Micromechanical Modeling of Carbonate Geomechanical Properties Evolution During Acid Gas Injection. 45th US Rock Mechanics. Geomechanics Symposium, 26-29 June 2011, San Francisco, USA. OnePetro, 2011. N ARMA-11-207, p. 10.
- Popov S.N. Manifestation of Coupled Mechanical and Chemical Effects in Experimental Studies of Changes in Elastic Properties, Porosity and Permeability of Reservoir Rocks under the Influence of Filtration of Water Saturated with Carbon Dioxide. Actual Problems of Oil and Gas. 2021. N 2 (33), p. 3-14 (in Russian). DOI: 10.29222/ipng.2078-5712.2021-33.art1
- Zhukov V.S., Kuzmin Y.O. Experimental evaluation of compressibility coefficients for fractures and intergranular pores of an oil and gas reservoir. Journal of Mining Institute. 2021. Vol. 251, p. 658-666. DOI: 10.31897/PMI.2021.5.5
- Martyushev D.A. Experimental Study of the Influence of Bottomhole Pressure of Producing Wells on Reserve Production from Complicated Carbonate Reservoirs. Bulletin of the Tomsk Polytechnic University. Geo Assets Engineering. 2021. Vol. 332. N 5, p. 110-119 (in Russian). DOI: 10.18799/24131830/2021/05/3190
- Bakirov E.A., Zakirov S.N., Shcherbakov G.A. et al. Patent N 1609978 SSSR. A Method for Near-Wellbore Zone Treatment. Publ. 30.11.1990. Bul. N 44 (in Russian).
- Khristianovich S.A., Kovalenko Yu.F., Kulinich Yu.V., Karev V.I. Increasing Productivity of Oil Wells by the Method of Geo-loosening. Neft i gaz Evraziya. 2000. N 2, p. 90-94 (in Russian).
- Kovalenko Yu.F., Kulinich Yu.V., Karev V.I. et al. Patent N 2179239 RF. A Method for Putting Well into Production. Publ. 10.02.2002. Bul. N 4 (in Russian).
- Karev V.I., Klimov D.M., Kovalenko Yu.F. et al. Patent N 2285794 RF. A Method for Near-Wellbore Zone Treatment. Publ. 20.10.2006. Bul. N 29 (in Russian).
- Klimov D.S., Kovalenko Yu.F., Karev V.I. Implementation of the Geo-loosening Method to Increase Injectivity of an Injection Well. Tekhnologii TEK. 2003. N 4, p. 59-64 (in Russian).
- Karev V.I. Influence of the Stress-Strain State of Rocks on the Filtration Process and Well Flow Rate: Avtoref. dis. ... d-ra tekhn. nauk. Мoscow: IPMekh RAN, 2010, p. 34 (in Russian).
- Karev V.I., Kovalenko Yu.F. Well stimulation on the basis of preliminary triaxial tests of reservoir rock. Rock Mechanics for Resources, Energy and Environment. London: Taylor & Francis Group, 2013, p. 935-940.
- Kovalenko Yu.F. Geomechanics of Oil and Gas Wells: Avtoref. dis. ... d-ra fiz.-mat. nauk. Мoscow: IPMekh RAN, 2012, p. 50 (in Russian).
- Klimov D.M., Karev V.I., Kovalenko Yu.F., Titorov M.Yu. Patent N 2645684 RF. A Method for Directional Unloading of Reservoir. Publ. 27.02.2018. Bul. N 6 (in Russian).
- Karev V.I., Khimulia V.V. Physical modeling of deformation and filtration processes in low-permeability reservoir rocks when implementing the directional unloading method. E3S Web of Conferences. 2021. Vol. 266. N 01001. DOI: 10.1051/e3sconf/202126601001
- Khuzin R.R., Andreev V.E., Mukhametshin V.V. et al. Influence of Hydraulic Compression on Porosity and Permeability Properties of Reservoirs. Journal of Mining Institute. 2021. Vol. 251, p. 688-697. DOI: 10.31897/PMI.2021.5.8
- Zakirov S.N., Drozdov A.N., Zakirov E.S. et al. Patent N 2620099 RF. A Method for Increasing Productivity of Producing Wells and Injectivity of Injection Wells. Publ. 23.05.2017. Bul. N 15 (in Russian).
- Zakirov S.N., Drozdov A.N., Zakirov E.S. et al. Technical and Technological Aspects of Geomechanical Reservoir Treatment. Delovoi zhurnal Neftegaz.RU. 2018. N 6 (78), p. 24-29 (in Russian).
- Zakirov S.N., Drozdov A.N., Alekseev B.G., Kolobanov A.V. Natural Evidences of Geomechanical Processes. Nedropolzovanie XXI vek. 2018. N 3 (73), p. 72-77 (in Russian).
- Indrupskiy I.M., Ibragimov I.I., Zakiryanov R.A., Girfanov I.I. Permeability Alteration of Carbonate Reservoir Rock under Cyclic Geomechanical treatment. Neftyanaya provintsiya. 2020. N 3 (23), p. 85-98 (in Russian). DOI: 10.25689/NP.2020.3.85-98
- Indrupskiy I.M., Ibragimov I.I., Zakiryanov R.A. et al. Permeability Alteration of Carbonate Reservoir Rock Under Cyclic Geomechanical Treatment. IOP Conference Series: Materials Science and Engineering. 2020. Vol. 921. Iss. 1. N 012009. DOI: 10.1088/1757-899X/921/1/012009
- Anikeev D.P., Zakirov E.S., Indrupskiy I.M. et al. Modelling of Cyclic Geomechanical Treatment of Carbonate Reservoirs. Oil Industry. 2021. N 1, p. 52-56 (in Russian). DOI: 10.24887/0028-2448-2021-1-52-56
- Keszthelyi D., Dysthe D.K., Jamtveit B. Compaction of North-Sea Chalk by Pore-Failure and Pressure Solution in a Producing Reservoir. Frontiers in Physics. 2016. Vol. 4. N 4. DOI: 10.3389/fphy.2016.00004
- Tron Golder K., Plischke B. History Matched Full Field Geomechanics Model of the Valhall Field Including Water Weakening and Re-Pressurisation. SPE EUROPEC/EAGE Annual Conference and Exhibition, 14-17 June 2010, Barcelona, Spain. OnePetro, 2010. N SPE-131505-MS. DOI: 10.2118/131505-MS
- Jiasheng Hao, Shapiro A. Effect of Compaction on Oil Recovery Under Low Salinity Flooding in Homogeneous and Heterogeneous Chalk. SPE Annual Technical Conference and Exhibition, 30 September – 2 October 2019, Calgary, Canada. OnePetro, 2019. N SPE-195831-MS. DOI: 10.2118/195831-MS
- Sarout J., Dautriat J., David C. Monitoring Strength Reduction in Sandstones Associated with Fluid Substitution Using Advanced Rock Mechanics Testing. Offshore Technology Conference Asia, 22-25 March 2016, Kuala Lumpur, Malaysia. OnePetro, 2016. N OTC-26636-MS. DOI: 10.4043/26636-MS
- Gupta I., Rai Ch., Sondergeld C., Hofmann R. Water Weakening: A Laboratory Study of Marcellus, Woodford, Eagle Ford, and Wolfcamp Shales. SPE Reservoir Evaluation & Engineering. 2019. Vol. 22. Iss. 2. N SPE-194482-PA, p. 418-427. DOI: 10.2118/194482-PA
- Bois A.-P., Mohajerani M., Dousi N., Harms S. Inducing Earthquake By Injecting Water In A Gas Field: Water-Weakening Effect. SPE Annual Technical Conference and Exhibition, 30 September – 2 October 2013, New Orleans, Louisiana, USA. OnePetro, 2013. N SPE-166430-MS. DOI: 10.2118/166430-MS
- Martyushev D.A., Galkin S.V., Shelepov V.V. The Influence of the Rock Stress State on Matrix and Fracture Permeability under Conditions of Various Lithofacial Zones of the Tournaisian-Fammenian Oil Fields in the Upper Kama Region. Moscow University Geology Bulletin. 2019. Vol. 74. N 6, p. 573-581. DOI: 10.3103/S0145875219060061
- Ibragimov I.I., Indrupskiy I.M., Lutfullin A.A. Assessment of the Effect of Geomechanical Treatment by Flow Simulations. Dostizheniya, problemy i perspektivy razvitiya neftegazovoi otrasli. 2020. Vol. 1, p. 89-98 (in Russian).