
Composite model of seismic monitoring data analysis during mining operations on the example of the Kukisvumchorrskoye deposit of AO Apatit
- 1 — Ph.D., Dr.Sci. Head of Department Saint Petersburg Mining University ▪ Orcid
- 2 — Postgraduate Student Saint Petersburg Mining University ▪ Orcid
- 3 — Ph.D. Head of Laboratory Saint Petersburg Mining University ▪ Orcid

Abstract
Geomechanical monitoring of the rock mass state is an actively developing branch of geomechanics, in which it is impossible to distinguish a single methodology and approaches for solving problems, collecting and analyzing data when developing seismic monitoring systems. During mining operations, all natural factors are subject to changes. During the mining of a rock mass, changes in the state of structural inhomogeneities are most clearly manifested: the existing natural structural inhomogeneities are revealed; there are movements in discontinuous disturbances (faults); new man-made disturbances (cracks) are formed, which are accompanied by changes in the natural stress state of various blocks of the rock mass. The developed method for evaluating the results of monitoring geomechanical processes in the rock mass on the example of the United Kirovsk mine of the CF AO Apatit allowed to solve one of the main tasks of the geomonitoring system – to predict the location of zones of possible occurrence of dangerous manifestations of rock pressure.
The study was conducted with the financial support of the Ministry of Science and Higher Education, agreement FSER-2021-0012
Introduction
The ongoing research is a further development of the idea proposed by the authors [1] on the use of machine learning methods when working with mathematical models of time series based on seismic monitoring data.
The task of geomechanical monitoring is to search for various kinds of interrelations between a wide list of natural and technical factors that determine the state of a technogenically disturbed rock mass. There are two main groups of such factors. For example, in the study of A.A.Kozyrev and coauthors [2], the following definitions are given to these factors: “Natural factors are the sum of the properties of the rocks composing the rock mass, the structural inhomogeneities of the rock mass and the natural stress field. Technical factors are a set of mining methods, the order of facilities construction, the development system used, the characteristics of mining workings, etc.”.
One of the ways to assess the probability of dangerous geodynamic processes is the use of mathe-matical models based on seismic monitoring data. Since the rock mass is a complex dynamic system, it is reasonable to use both spatial coordinates and components of the time series of seismic activity to build such models. The sequence of destructions that appear during mining can be represented as a certain time series consisting of discrete events. Each of these events is defined by a time coordinate and a characteristic describing the degree of the rock mass destruction, for example, the magnitude of the signal energy [3]. In this article, as such a time series, it is proposed to use a seismic sequence recorded using a rock mass condition monitoring system. Clustering methods are used to localize the spatial zone of the preparation of the source of destruction, assigning each discrete event its own spatial cluster.
The object of this study is the Kukisvumchorrskoye deposit, developed by the United Kirovsk Mine of CF AO Apatit. According to P.A.Korchak and S.A.Zhukova, seismicity monitoring at underground mines is carried out using an automated rock mass condition monitoring system (ARMCMS). During the observation of seismicity in the rock mass, the following patterns were revealed: the reaction of the rock mass to mass blasts; a seasonal increase in seismicity during periods of snow melting; an increase in seismicity before the roof fall of the overlying rocks.
Technological processes during mining operations have a significant impact on the seismic regime of mines. Currently, about 40 rock bursts have been documented at the mines of AO Apatit [4].
Methodology
A number of technological breakthroughs are expected in the near future, reflecting profound technological changes that will lead to the transformation of traditional industrial production [5-7]. At the same time, it should be taken into account that the increase in the volume of mineral extraction in difficult mining and geological conditions is closely related to the analysis of the main parameters of the stress-strain state (SSS) of the rock mass [8].
Reliable analysis and modeling of SSS rock mass is based on the use of various mathematical models [9, 10]. Thus, from the point of view of the theory proposed within the framework of the hierarchical model, the criterion for the destruction site formation is a violation of the conditions of stationarity/quasi-stationarity of the modeled process (for example, Poisson's criterion) [11]. However, this approach takes into account only statistical and ignores, for example, the physical and mechanical parameters of the medium under study. This negatively affects the quality of the predictive model used and does not allow taking into account the features of the modeled field.
Thus, obtaining high-quality and reliable results when implementing such models without the direct participation of an expert in the subject area of research is always difficult, since appropriate data preprocessing strategies, the type of model used, its parameters and a set of criteria are selected [12]. The algorithm proposed in this paper generates its own set of criteria for the formation of a destruction site using a mathematical model controlled by data from seismic monitoring, data-driven model [13, 14]. The resulting set takes into account both the peculiarities of mining operations at the deposit, and the physical and mechanical properties of the rock mass.
The required mathematical model can be developed using both a single machine learning model and a hybrid (composite) approach. Currently, the identification of data-driven models with a complex heterogeneous structure remains an unsolved problem. The structure of the composite model can be represented as a directed acyclic graph (DAG), and the most suitable variant of the structure can be developed using optimization approaches. The elements of this graph are machine learning models (intended for classification or additional models for side tasks, for example, clustering).
Thus, the task of the study is to search for clusters – rock destruction sites. For such a task in the field of space – time – energy of seismic events, based on the conducted research, an algorithm was developed for the analysis and prediction of the geomechanical state of a technogenically disturbed rock mass (Fig.1), which consists in the simultaneous application of various machine learning models in a single composite model most suitable for a certain type of data reflecting the variability of the observed system in each of the components of the space. The evaluation of the final model quality in the work is determined by the introduction of criteria necessary for the organization of the multi-criteria optimization process.
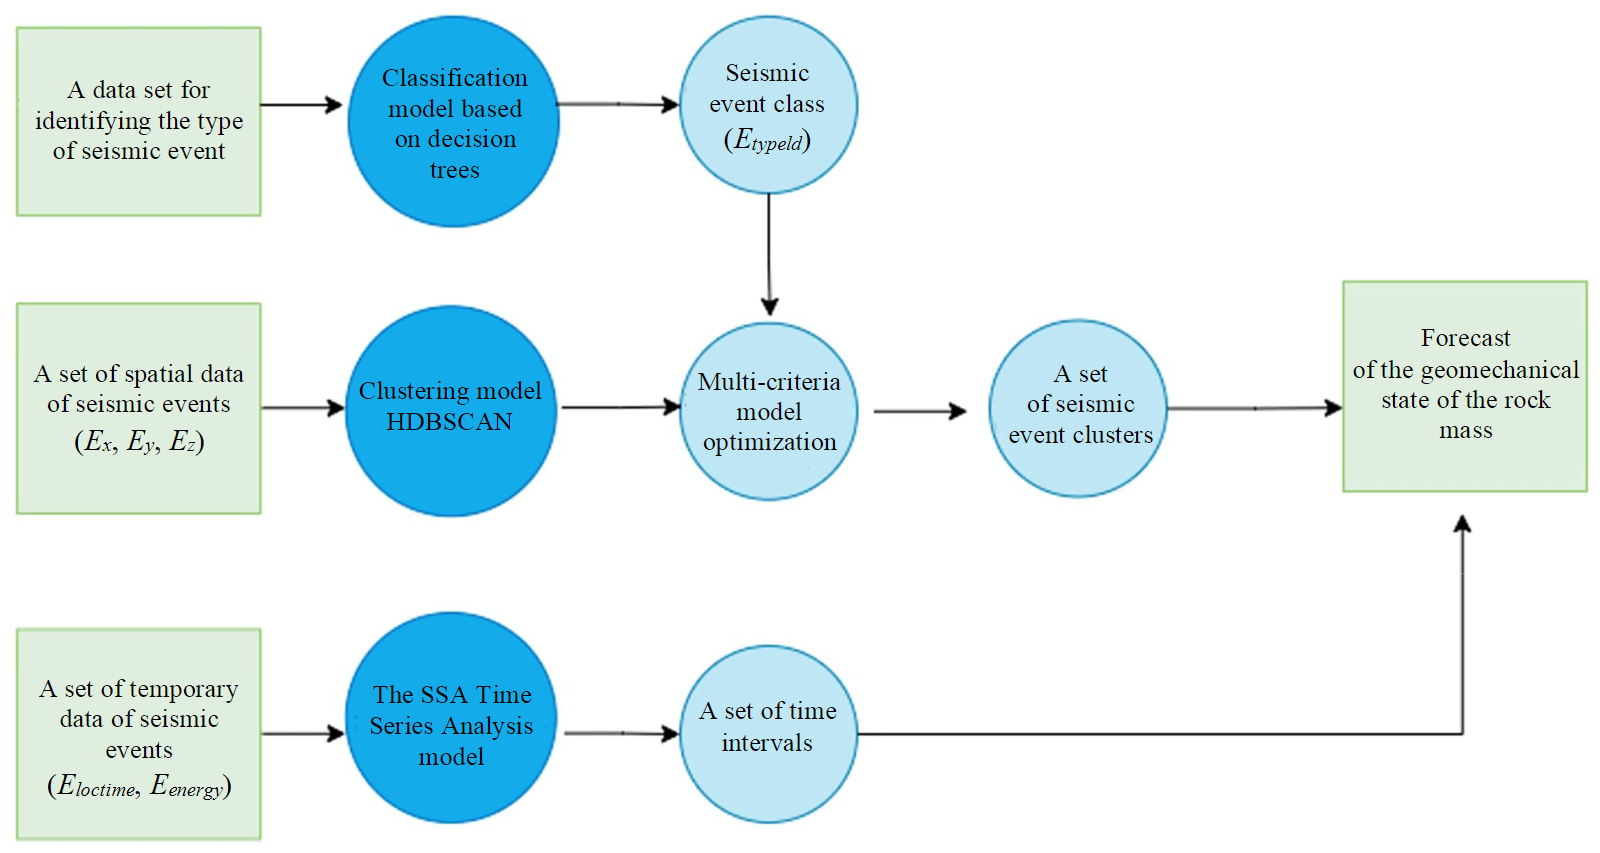
Fig.1. Composite model of prediction of dangerous geodynamic phenomena
Silhouette criterion
The silhouette of a sample is the average size of the silhouette of objects in this sample; it shows how the average distance to objects in its cluster differs from the average distance to objects in other clusters. This value belongs to the range [–1,1]. Values close to –1 correspond to poor (scattered) clusterizations; values close to zero mean that clusters intersect and overlap each other; values close to one correspond to “dense”, well-defined clusters, i.e. the larger the silhouette of the sample, the more clearly the clusters are distinguished, which are compact, densely grouped point clouds.
False (FAR) and missed (MAR) alarms rates
The most important element of solving the problem of detecting anomalies is to determine the time window of detection. Within the framework of the proposed quality criteria, predicted anomalies inside the detection window are perceived only as one true positive result. The absence of predicted anomalies inside the detection window is perceived only as one false negative result. Predicted points outside the detection windows are defined as false positives. In this study, three values of the detection window width were adopted: the short – term forecasting horizon is 6 h before and after the event; the medium-term forecasting horizon is 48 h before and after the event; the long – term forecasting horizon is 168 h before and after the event.
Next, two of the three methods used in the final composite model will be considered: the Singular spectrum analysis (SSA) method for analyzing time series of seismic monitoring, designed to simu-late the behavior of the system in time – energy space, and the HDBSCAN clustering method (Hierarchical Density-Based Spatial Clustering of Applications with Noise), designed to search for clusters – rock destruction sites and responsible for modeling the spatial variability of the system.
The basic variant of the SSA method in time series analysis is the decomposition of the original series into simple components that can be approximated using periodic functions or low-degree po-lynomials [15-19]. The resulting decomposition can serve as a basis for forecasting both the time series itself and its individual components. To analyze the time series of seismic monitoring, the parameter L is selected, which is responsible for the window width. The choice of the value of this parameter depends on the researcher and his subject knowledge about the system generating the selected time series. Then, based on the series, a Hankel matrix is constructed, where vectors of length L are used as columns. The task of the selected type of decomposition is to represent the original series as a sum of components. This method is recommended to be used to isolate the trend, cyclic components and build some approximation of the original time series based on the selected components.
Analysis of seismic monitoring data and clustering of seismic events require the use of modern methods of mathematical modeling. During a long period of studying the seismic regime of the Kukisvumchorrskoye deposit, it was found that clusters of seismic events and the mechanism of their formation have features similar to other deposits, in particular, they are “confined to places of active mining operations, to disjunctive disturbances in the roof of hanging flank rocks, and can also be formed under the influence of other factors – both natural and man-made” [20].
The classical approach of using clustering methods is an approach based on ideas about the physical processes occurring during loading and subsequent deformation of the rock mass. To solve the problem of identifying source zones, it seems most appropriate to use a hierarchical or graph approach. In other words, these methods are methods of strict clustering [16, 21, 22]. At the same time, a number of studies claim that the use of non-strict clustering methods is more preferable for modeling random processes [23, 24].
As a result of the work, the HDBSCAN algorithm was applied [6, 25, 26], which is a hierarchical spatial algorithm for clustering data with noise based on the use of distribution density [27-30].
Results and discussions
The dates of recorded rock bursts for 2009-2018 are used as data for validating the operation of the proposed algorithm (Table 1). In order to maintain confidentiality, the spatial coordinates have been changed.
Table 1
Recorded rock bursts (according to the data of the cards of rock bursts)
|
Coordinates of the seismic event along the axes |
|||
|
Ox |
Oy |
Oz |
Date of occurrence of the geodynamic event |
|
0.456 |
0.413 |
0.325 |
13.05.2009 |
|
0.381 |
0.464 |
0.228 |
21.10.2010 |
|
0.603 |
0.441 |
0.293 |
27.01.2016 |
The length of the analyzed time series is 365 days, the width of the time window was chosen to be 30 days (parameter L), and the average value (for one day) of all seismic events with an energy value in the range from 102 to 105 J is used as the observed value. This range was justified by the analysis of the distribution of seismic events in terms of energy from January 2009 to December 2020, as well as on the basis of an expert assessment by the staff of the Research Center of Geomechanics and Mining Problems of Saint Petersburg Mining University. The time scale of seismic monitoring is chosen as the Ox axis, and the scale of the average value of seismic events is chosen as the Oy axis.
The parameter of the expected periodicity of the process of rock burst formation was chosen to be equal to 15 days. Its value of 50 % of the window length indicates the presence of two subprocesses within one month. And if there were no dangerous occurrences of rock pressure (RP) in the first subprocess (the first 15 days), then the probability of their occurrence in the second subprocess (the second 15 days) increases in accordance with the growth of the exponential function. The time series reconstructed from the first elementary matrix for 2009, 2010 are shown in Fig.2, a, b, for 2016 – in Fig.2, c. The first elementary matrix is responsible for the trend of seismic activity. As can be seen from Fig.2, a, b, 13.04.2009 and 25.09.2010, the minimum values of the seismic activity trend are reached.
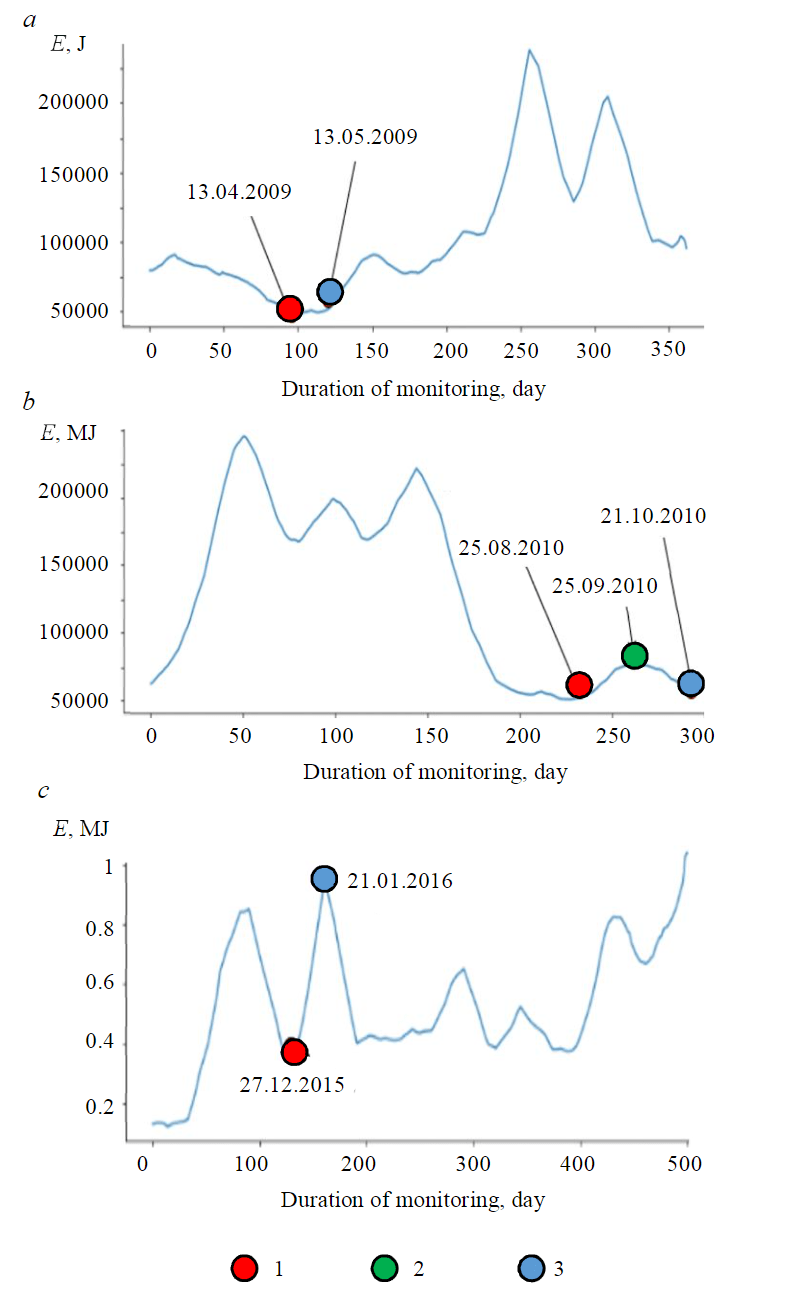
Fig.2. Trend of the seismic monitoring time series for 2009 (a), 2010 (b) and 2016 (c) 1 – minimum and change of trend direction; 2 – alleged rock burst; 3 – fixed rock burst
Figure 2, a, b shows an example of a combination of the first and second cases (2009 and 2010). On the one hand, there is a repeat of the situation in 2009 (falling to the minimum value of the trend of seismic activity), and the point of change in the direction of trend growth on 27.01.2015 (Fig.2, c). Consequently, the analysis of the trend of seismic activity obtained using the SSA method makes it possible to establish a connection between the dangerous manifestations of RP in the form of a rock burst from 21.01.2016 and seismic activity expressed by a downward trend.
Thus, a dangerous occurrence of RP may be preceded by a smooth decline in the trend to the point of a global minimum, followed by a change in the direction of the trend. In accor-dance with the assumption of the cyclical nature of the process, for the selected parameters (window width and frequency of the process), the time before the onset of a dangerous occurrence of RP is 15 and 30 days, respectively.
Using a composite model to analyze seismic monitoring data for 2020
Figure 3 shows three key points in the trend:
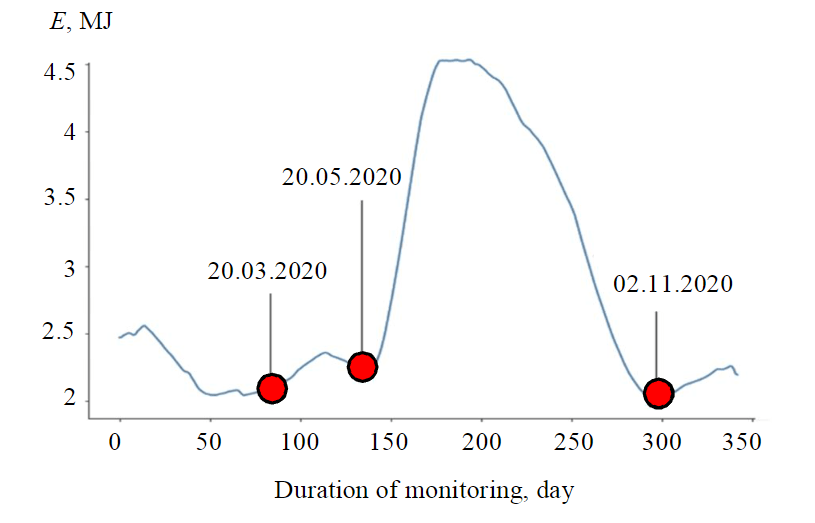
Fig.3. Trend of the seismic monitoring time series for 2020
- On 20.03.2020 the minimum value of the trend of seismic activity at the current moment of observations is reached. However, the probability of a rock burst is moderate, since the trend growth is preceded by a period of stationarity (no growth of the average trend value) equal to the window length (30 days). This period can be interpreted as stabilization of deformation processes in the rock mass, which makes it possible to neutralize possible dangerous occurrences of RP.
- On 20.05.2020, a local minimum of the seismic activity trend is reached, and a sharp increase in the trend in the opposite direction begins. The probability of a rock burst in the next 30 days is quite high, since the process has reached its local minimum, and seismic activity has increased.
- On 02.11.2020 the global minimum of the seismic activity trend value for the entire observation period is reached, and then its moderate growth begins. The probability of a rock burst in the next 30 days is extremely high, since the process has reached its minimum historical value, and the seismic activity trend began to grow.
In two of the three recorded rock bursts, it was possible to predict the approximate (with a difference of one or two days) time of the onset of the rock burst (Table 2). However, for the case that occurred on 06.07.2020, the forecast error was 15 days, which requires clarification of the forecast. Then, using data from 01.01.2020 to 05.07.2020 (one day before the actual rock burst), the case was considered in detail and the original time series was restored.
Table 2
Forecasts of the onset of potential rock bursts
|
The appearance of a local minimum pointand a trend change |
Potential rock burst (moderate degree of risk) |
Potential rock burst(the degree of risk is extremely high) |
Occurrence of the recorded geodynamic event |
|
20.03.2020 |
06.04.2020 |
21.04.2020 |
08.04.2020 |
|
20.05.2020 |
06.06.2020 |
20.06.2020 |
06.07.2020 |
|
02.11.2020 |
17.11.2020 |
03.12.2020 |
04.12.2020 |
As can be seen from Fig.4, a local maximum is reached at the point 30.06.2020, and a change in the direction of the trend movement begins. In addition, in the period from 30.06.2020 to 05.07.2020, the maximum value of the amplitude of the cyclic component was recorded. The combination of these factors makes it possible to predict the onset of a potential rock burst on 06.07.2020. Thus, it can be concluded that it is advisable to supplement the trend analysis with the analysis of the cyclical component.
Analysis of the results of modeling clusters of seismic events based on seismic monitoring data for 2020
A number of papers have noted that “a significant part of approaches to predictive assessments of dangerous rock pressure occurrences is based on the following concept: as the rock is destroyed, several stages of destruction are formed with a gradual transition from one stage to another” [31, 32]. The size and range of cracks that are formed as a result of deformation and destruction of the rock mass can vary from a millimeter to tenths of a meter. The most often dangerous occurrences of RP are expressed in the form of rock impacts and other occurrences of technogenic seismicity (Fig.5, 6).
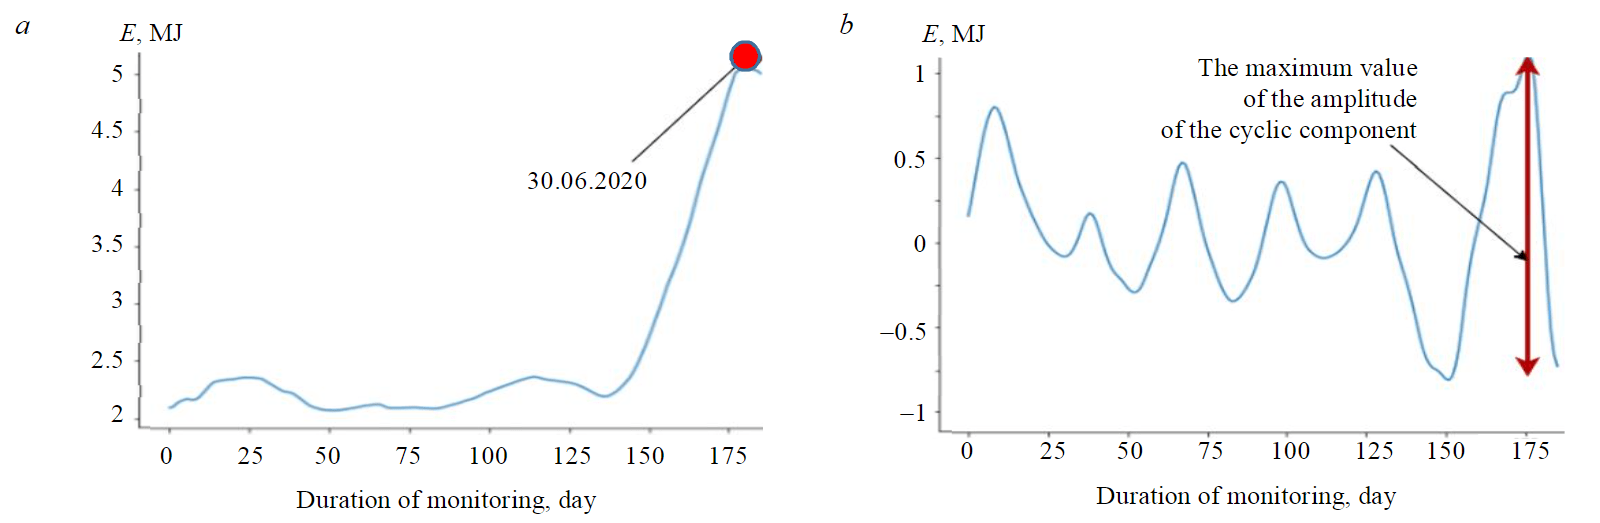
Fig.4. Trend (a) and cyclic component (b) of the time series of seismic monitoring for the period from 01.01.2020 to 05.07.2020
To analyze the results of modeling clusters of seismic events, S.A.Ignatiev [11] states that “cluster analysis is based on two main assumptions: the identified features of an object should allow for the division of a certain set of objects into clusters; the accuracy of choosing the appropriate scale or the necessary units of quantities reflecting the features of the object (in some cases, the use of standardized quantities is required)”.
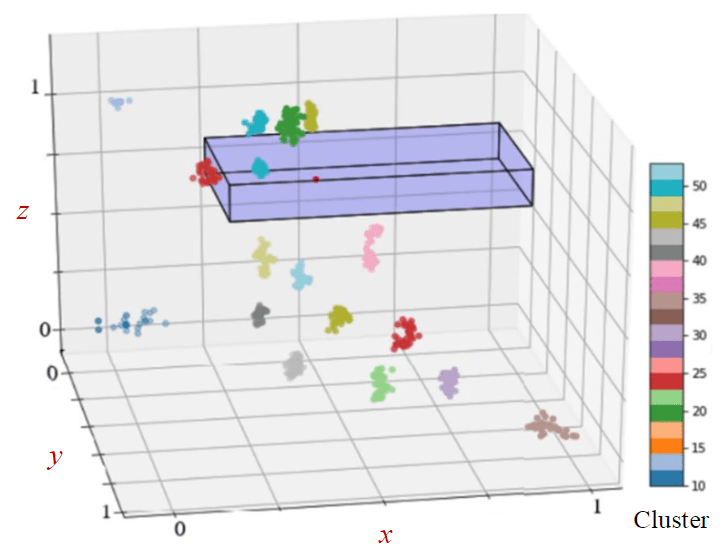
Fig.5. Selection of all microclusters (no more than 100 events per year) of seismic events. Purple parallelepiped – danger zone (mining zone + 100 m on the Ox and Oy axes and 50 m of reserve on the Oz axis)
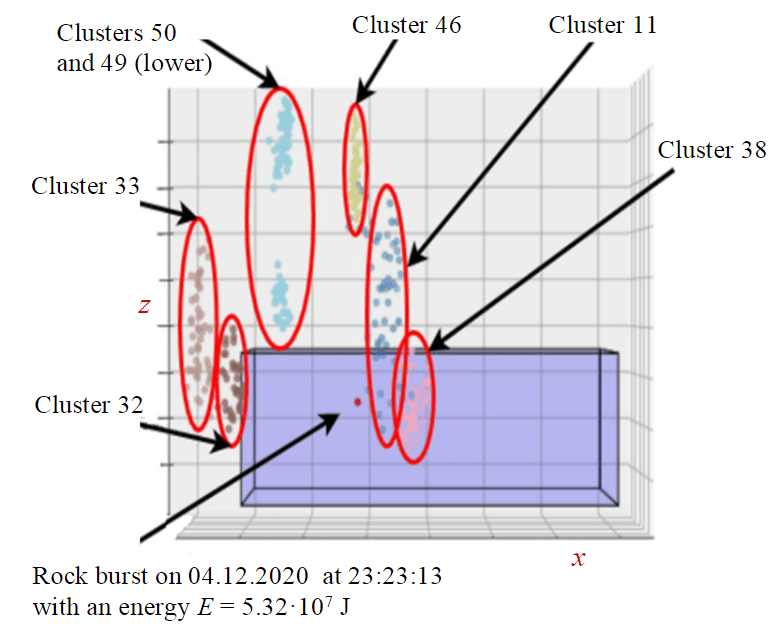
Fig.6. Clusters – sources of rock destruction
In particular, the authors [33, 34] suggest using preliminary processing of the initial data before the clustering procedure. The initial data are divided into groups, each of which is characterized by the density of the distribution of seismic events in the seismic monitoring space. This approach will allow filtering the initial data from the “noise” points. Also, one of the stages of cluster analysis is the use of statistical criteria obtained from the analysis of the data of seismic monitoring of the Kukisvumchorrskoye deposit for a long period of observations (2000-2020): the average value of 9620+241.76 J; median 1610 J; standard deviation 18000 J.
Thus, all seismic events exceeding the sample average (based on the expert assessment of the staff of the Research Center for Geomechanics and Mining Issues of St. Petersburg Mining University, the value of 104 J was chosen) are considered as seismic events – precursors that can lead to dangerous occurrences of RP. Using the metrics proposed in the work as quality criteria, in the course of multi-criteria optimization [33-35], clusters of “non-classical” geometric shapes (ellipsoids) were obtained using the developed algorithm, which can be conditionally divided into three groups according to their location relative to the rock burst that occurred. Clusters 32-33 are located north of the impact point, clusters 46, 49, 50 are located above the burst point. Clusters 11 and 38 are located to the southeast of the burst point. It should be noted that all the selected clusters are stable in time, i.e. they include seismic events during the entire monitoring period in 2020. Table 3 shows clusters and precursor events contained in them, which with a high degree of probability can be triggers of rock bursts. Monitoring of seismic events in these clusters in the future is advisable. In the Table 4 shows the results of calculating the FAR/MAR quality criteria. The precursor events from Table 3 are used to calculate the metric.
Table 3
Characteristics of seismic events – precursors of selected clusters exceeding 104 J
|
Time of occurrence of a seismic event |
The energy of a seismic event, J |
Cluster number |
Date of the supposed rock burst |
|
22:13:27 11.03.2020 |
976000 |
50 |
06.04.2020 |
|
17:53:49 12.04.2020 |
153000 |
50 |
21.04.2020 |
|
02:55:17 21.05.2020 |
406000 |
50 |
06.06.2020 |
|
21:27:14 07.06.2020 |
94600 |
46 |
06.06.2020 |
|
06:33:30 15.06.2020 |
18400 |
50 |
21.06.2020 |
|
18:20:15 05.07.2020 |
362400 |
50 |
05.07.2020 |
|
08:31:49 08.11.2020 |
22300 |
32 |
17.11.2020 |
|
01:24:33 21.11.2020 |
15000 |
32 |
03.12.2020 |
|
02:23:31 21.11.2020 |
27400 |
33 |
03.12.2020 |
|
13:48:17 28.11.2020 |
24000 |
32 |
03.12.2020 |
Table 4
Metrics of seismic events – precursors of selected clusters exceeding 104 J
|
Time of occurrence of a seismic event |
FAR/MAR forecast horizons |
||
|
Short-term |
Medium-term |
Long-term |
|
|
08.04.2020 |
1/1 |
0/0 |
1/1 |
|
06.07.2020 |
3/1 |
3/0 |
3/1 |
|
04.12.2020 |
3/1 |
0/0 |
3/1 |
Conclusion
As a result of the analysis of the clustering of seismic events based on monitoring data for 2020, the following conclusions can be drawn.
A hypothetical connection has been formed between the dangerous occurrence of RP and a smooth decrease in the trend of seismic activity to the point of a global minimum, followed by a change in the direction of the trend. For each of the rock bursts, their own precursor events were found; their number, time difference and energy values are closely related to the probability of a rock burst.
A scheme of a composite model for analyzing seismic monitoring data is proposed. Based on seismic monitoring for 2020, experimental data were obtained confirming the hypothesis formed by the authors. The results of the study are a development of the idea proposed by the authors in the article on the use of machine learning methods when working with mathematical models of time series that are based on seismic monitoring data [1].
Analysis of the data obtained, their distribution in time and space revealed the dates of two potentially dangerous occurrences of RP 06.04.2020 and 03.12.2020. At the same time, the actual dates of the rock bursts 08.04.2020 and 04.12.2020 differ from the expected ones by one or two days.In the case of a real rock burst on 06.07.2020, the authors conducted an additional analysis of the time series of seismic monitoring and amended the forecast of dangerous RP occurrences.
Let us analyze the criteria for the proportion of false (FAR) and missed (MAR) alarms:
- short-term forecasting horizon (the share of false alarms – two or three false alarms per one rock burst, the share of missed rock bursts – 100 %);
- medium-term forecasting horizon (the share of false positives is one false event per one rock burst, the share of missed rock bursts is 0 %);
- long-term horizon of forecasting (the share of false positives is two or three events per one rock burst, the share of missed rock bursts is 100 %).
Thus, the proposed method depends on the choice of the forecast horizon and is effective when using a medium-term forecast horizon. It can be argued that the composite model based on the analysis of the time series of seismic monitoring and the distribution of clusters – sources of seismic events in the rock mass is an effective means of controlling dangerous occurrences of RP.
References
- Gospodarikov A.P., Morozov K.V., Revin I.E. A method of data interpretation in seismicity and deformation monitoring in underground mining in terms of the Kukisvumchorr deposit of Apatit Company. Mining informational and analytical bulletin. 2019. N 8, p. 157-168 (in Russian). DOI: 10.25018/0236-1493-2019-08-0-157-168
- Kozyrev A.A., Kasparyan E.V., Fedotova Yu.V. Concept of a unique complex geomechanical monitoring system when mining in hard rock massifs. Mining informational and analytical bulletin. 2016. N 4, p. 168-191 (in Russian).
- Shabarov A.N., Zamorkina Yu.V., Popov A.L., Bagautdinov I.I. Integrated approach at geodynamic zoning of mine fields. Mining informational and analytical bulletin. 2018. N 49, p. 496-506 (in Russian). DOI: 10.25018/0236-1493-2018-11-49-496-506
- Korchak P.A., Zhukova S.A. Method of receiving basic data for the seismic monitoring at underground mines of JSC “Apatit”. Mining informational and analytical bulletin. 2014. N 10, p. 15-20 (in Russian).
- Safiullin R.N., Afanasyev A.S., Rezchenko V.V. The Concept of Development of Monitoring Systems and Management of Intelligent Technical Complexes. Journal of Mining Institute. 2019. Vol. 237, р. 322-330. DOI: 10.31897/PMI.2019.3.322
- Trushko V.L., Protosenya A.G. Prospects of Geomechanics Development in the Context of New Technological Paradigm. Journal of Mining Institute. 2019. Vol. 236, p. 162-166. DOI: 10.31897/PMI.2019.2.162
- Litvinenko V.S. Digital Economy as a Factor in the Technological Development of the Mineral Sector. Natural Resources Research. 2020. Vol. 29, p. 1521-1541. DOI: 10.1007/s11053-020-09716-1
- Trushko V.L., Protosenya A.G., Ochkurov V.I. Prediction of the geomechanically safe parameters of the stopes during the rich iron ores development under the complex mining and geological conditions. International Journal of Applied Engineering Research. 2016. Vol. 11. Iss. 22, p. 11095-11103.
- Gospodarikov A.P., Vykhodtsev Y.N., Zatsepin M.A. A method for calculating effect of a blast-induced seismic wave on nonuniform enclosing rock mass around a tunnel. Journal of Mining Science. 2020. Vol. 56. N 6, p. 903-913 (in Russian).
- Karasev M.A., Sotnikov R.O. Prediction of the stress state of the shotcreting support under repeated seismic load. Journal of Mining Institute. 2021. Vol. 251, p. 626-638. DOI: 10.31897/PMI.2021.5.2
- Ignatiev S.A., Sudarikov A.E., Imashev A.Zh. Modern Mathematical Forecast Methods of Maintenance and Support Conditions for Mining Tunnels. Journal of Mining Institute. 2019. Vol. 238, p. 371-375. DOI: 10.31897/PMI.2019.4.371
- Zakharov L.А., Martyushev D.А., Ponomareva I.N. Predicting dynamic formation pressure using artificial intelligence methods. Journal of Mining Institute. 2022. Vol. 253, p. 23-32. DOI: 10.31897/PMI.2022.11
- Beloglazov I.I., Petrov P.A., Bazhin V.Yu. The concept of digital twins for tech operator training simulator design for mining and processing industry. Eurasian Mining. 2020. Vol. 2 (34), p. 50-54. DOI: 10.17580/em.2020.02.12
- Zhukovskiy Yu.L., Korolev N.A., Babanova I.S., Boikov A.V. The prediction of the residual life of electromechanical equipment based on the artificial neural network. IOP Conference Series: Earth and Environmental Science. 2017. Vol. 87. N 032056. DOI: 10.1088/1755-1315/87/3/032056
- Jia Qiong, Zhessakov A. Study on ecological evaluation of urban land based on GIS and RS technology. Arabian Journal of Geosciences. 2021. Vol. 14. Iss. 4. N 261. DOI: 10.1007/s12517-021-06586-6
- Golyandina N., Osipov E. The “Caterpillar”-SSA method for analysis of time series with missing values. Journal of Statistical Planning and Inference. 2007. Vol. 137. Iss. 8, p. 2642-2653. DOI: 10.1016/j.jspi.2006.05.014
- Golyandina N., Stepanov D. SSA-based approaches to analysis and forecast of multidimensional time series. Proceedings of the 5th Saint Petersburg Workshop on Simulation, 26 June – 2 July 2005, Saint Petersburg, Russia, p. 293-298.
- Golyandina N.E., Usevich K.D. 2D-extension of Singular Spectrum Analysis: algorithm and elements of theory. Matrix Methods: Theory, Algorithms and Applications. World Scientific Publishing, 2010, p. 449-473.
- Golyandina N., Shlemov A. Variations of Singular Spectrum Analysis for separability improvement: non-orthogonal decompositions of time series. Statistics and its interface. 2015. Vol. 8, p. 277-294. DOI: 10.4310/SII.2015.v8.n3.a3
- Oparin V.N., Bagaev S.N., Malovichko A.A. Methods and systems of seismodeformation monitoring of man-made earthquakes and rock bursts. Vol. 1. Novosibirsk: Sibirskoe otdelenie RAN, 2009, p. 304 (in Russian).
- Bhattacharjee P., Mitra P. A survey of density based clustering algorithms. Frontiers of Computer Science. 2021. Vol. 15. N 151308. DOI: 10.1007/s11704-019-9059-3
- Malzer C., Baum M. A Hybrid Approach to Hierarchical Density-based Cluster Selection. IEEE International Conference on Multisensor Fusion and Integration for Intelligent Systems (MFI), Karlsruhe, Germany, 2020, p. 223-228. DOI: 10.1109/MFI49285.2020.9235263
- Abramovich B.N., Babanova I.S. Development of neural network models to predict and control power consumption in mineral mining industry. Mining informational and analytical bulletin. 2018. N 5, p. 206-213 (in Russian). DOI: 10.25018/0236-1493-2018-5-0-206-213
- Deb K., Pratap A., Agarwal S., Meyarivan T. A fast and elitist multiobjective genetic algorithm: NSGA-II. IEEE Transactions on Evolutionary Computation. 2002. Vol. 6. N 2, p. 182-197. DOI: 10.1109/4235.996017
- Comaniciu D., Meer P. Mean shift: A Robust Approach Toward Feature Space Analysis. IEEE Transactions on Pattern Analysis and Machine Intelligence. 2002. Vol. 24. N 5, p. 603-619. DOI: 10.1109/34.1000236
- Sander J., Ester M., Kriegel H. P., Xu X. Density-Based Clustering in Spatial Databases: The Algorithm GDBSCAN and Its Applications. Data Mining and Knowledge Discovery. Berlin: Springer-Verlag, 1998. Vol. 2, p. 169-194. DOI: 10.1023/A:1009745219419
- Kochnev A.A., Kozyrev N.D., Kochneva O.E., Galkin S.V. Development of a comprehensive methodology for the forecast of effectiveness of geological and technical measures based on machine learning algorithms. Georesursy. Vol. 22. Iss. 3, p. 79-86 (in Russian). DOI: 10.18599/grs.2020.3.79-86
- Hoang Nguyen, Xuan-Nam Bui, Tran Quang Hieu et al. A comparative study of empirical and ensemble machine learning algorithms in predicting air over-pressure in open-pit coal mine. Acta Geophysica. 2020. Vol. 68. Iss. 2, p. 325-336. DOI: 10.1007/s11600-019-00396-x
- Campello R., Kröger P., Sander J., Zimek A. Density-based clustering. Wiley Interdisciplinary Reviews: Data Mining and Knowledge Discovery. 2020. Vol. 10. Iss. 2. DOI: 10. 10.1002/widm.1343
- Moulavi D., Jaskowiak P., Campello R. et al. Density-Based Clustering Validation. SIAM Proceedings of the 2014 SIAM International Conference on Data Mining (SDM). 2014, p. 839-847. DOI: 10.1137/1.9781611973440.96
- Ke-ping Zhou, Yun Lin, Hong-wei Deng et al. Prediction of rockburst classification using cloud model with entropy weight. Transactions of Nonferrous Metals Society of China. 2016. Vol. 26. Iss. 7, p. 1995-2002. DOI: 10.1016/S1003-6326(16)64313-3
- Ma T.H., Tang C.A., Tang L.X. et al. Rockburst characteristics and micro-seismic monitoring of deep-buried tunnels for Jinping II Hydropower Station. Tunnelling and Underground Space Technology. 2015. Vol. 49, p. 345-368. DOI: 10.1016/j.tust.2015.04.016
- Garza-Fabre M., Toscano P.G., Coello Coello C.A. Ranking Methods for Many-Objective Optimization. MICAI 2009: Advances in Artificial Intelligence 8th Mexican International Conference on Artificial Intelligence Guanajuato, 9-13 November 2009, México. 2009. Vol. 5845, p. 633-645. DOI: 10.1007/978-3-642-05258-3_56
- Zitzler E., Laumanns M., Thiele L. SPEA2: Improving the Strength Pareto Evolutionary Algorithm. TIK-Report. Vol. 103. ETH Zurich: Computer Engineering and Networks Laboratory. DOI: 10.3929/ETHZ-A-004284029
- Gladyr A.V., Kursakin G.A., Rasskazov M.I., Konstantinov A.V. Method to detect hazardous areas in rock mass from seismoacoustic observations. Mining informational and analytical bulletin. 2019. N 8, p. 21-32 (in Russian). DOI: 10.25018/0236-1493-2019-08-0-21-32