
Enhancement of energy efficiency of the vacuum oil distillation unit using pinch analysis
Abstract
The actual task of the state is to increase the energy efficiency of the oil refinery. The object of research is a vacuum distillation unit, including a preheating unit for raw materials and a furnace for heating fuel oil before the column. Pinch analysis allows to analyze and optimize a large number of heat flows. In this study the analysis and enhancement of efficiency of the research object is carried out by enthalpy pinch analysis. In order to reduce the heat load of the furnaces, the additional flows were introduced into the heat exchange system of the oil heating unit. Parametric optimization of the new heat exchange system was carried out. The minimum needs of the heat exchange system in external energy carriers are determined. An enthalpy cascade of the heat exchange system has been constructed, which clearly shows the distribution of heat between each heat flow of the system. In the analysis of the energy efficiency of a furnace, an important point is the determination of the optimal heat capacity of the combustion products. In this work, we have determined the optimal flow heat capacity, at which the heat loss with the exhaust gases is minimal. As a result of the studies carried out, the efficiency of the fuel oil preheating unit has been increased by maximizing heat recovery, and the cost of external energy carriers has been minimized. By reducing heat loss with flue gases, it was possible to increase the efficiency of the furnace.
None
Introduction
Increasing energy efficiency is the main factor in the economic growth of an enterprise and the state [1-3]. Energy efficient technologies can reduce the consumption of natural resources and reduce environmental damage [4-6]. Federal Law N 296-FZ of July 2, 2021 “On Limiting Greenhouse Gas Emissions” confirms the relevance of reducing emissions to the environment.
Scientists around the world create energy efficient technologies [7-9]. Modern research includes computer technology [10-12]. There are many different methods for assessing energy efficiency [13-15]. Current areas of research are the so-called 4-E [16]: enthalpy, exergy, exergoeconomics, and economic analysis. Research is moving forward and 4-E can be supplemented with environmental analysis [17-20].
One of the efficient methods for optimizing heat flows is pinch analysis [21]. Theoretical foundations in the field of integration of thermal processes and pinch analysis are presented in the work of R.Smith et al. [22, 23]. Pinch analysis makes it possible to work with a large number of heat flows. This method performs parametric and structural optimization of the heat exchange system.
The oil refining industry is energy intensive [20] – the plants have a large amount of heat flows with large potentials of thermal energy. Therefore, the use of pinch analysis is advisable in oil refineries [24-26].
The study [27] presents in detail a method for improving the energy efficiency of primary oil distillation units without making changes to the structure of the heat exchange network. Increasing the economic efficiency of process units is achieved through the use of mathematical programming methods. The authors of the study also achieved a reduction in carbon dioxide emissions into the environment.
A common method for designing heat exchange networks is the graphical method of process integration [28]. This method has a number of significant advantages, in particular, interactive visualization of the heat exchange network analysis is provided. This advantage can replace the use of various software products (Aspen Energy Analyser, etc.). This method was practically used in the modernization of an oil refinery in Kuwait [29]. However, this method is applicable only to heat exchange networks with one minimum temperature difference.
One of the main results of the study [30] is the development of a graphical tool for designing heat exchange networks with the simultaneous presence of several minimum temperature differences.
The work [31] gives an example of optimization of the heat exchange network of the primary oil distillation unit located in Bahrain. Particular attention is paid to the reduction of carbon dioxide emissions.
Pinch analysis includes various tools: parametric optimization, structural optimization, grand compound curve, and thermal cascades. There are various options for using pinch analysis: enthalpy, exergy, etc. [32-34]. The method of structural and parametric optimization based on exergy pinch analysis was described in previous studies [35]. The novelty of this study is the use of pinch analysis technology to analyze and develop measures to improve the energy efficiency of a vacuum distillation unit of fuel oil.
Methods
Vacuum tubular distillation unit of the fuel profile is designed for processing the fuel oil fraction and fraction of atmospheric gasoil from the atmospheric tubular plant АТ-5 in order to obtain vacuum diesel fuel, light vacuum gasoil (LVG) and heavy vacuum gasoil (HVG). The general scheme of the investigated blocks of the vacuum distillation unit VТ-1 is shown in Fig.1.
The objects of study are the fuel oil preheating unit VТ-1 and the furnace for heating fuel oil before the column. The main stages of the study are:
- analysis of the existing heat exchange system of the fuel oil preheating unit using enthalpy pinch analysis;
- pinch analysis of the vacuum distillation unit:
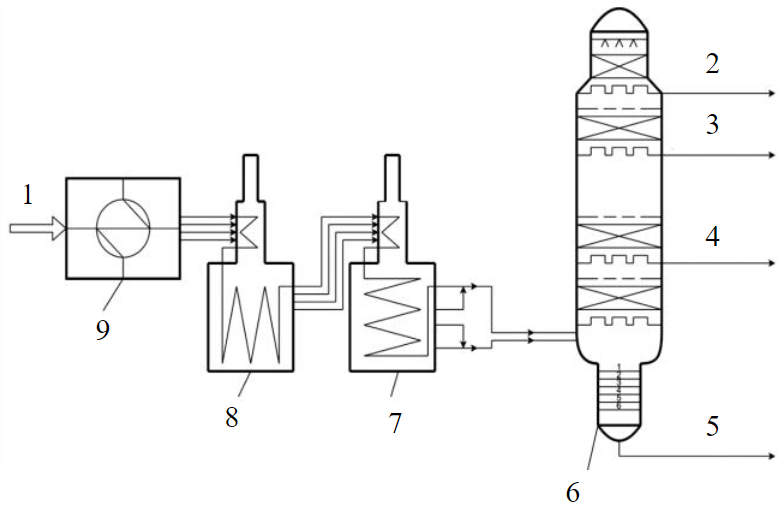
Fig.1. General scheme of the investigated blocks of the vacuum distillation unit 1 – fuel oil in HE-27/1.2; 2 – vacuum component of diesel fueland the first pumparound in ACU-10/1.2; 3 – light vacuum gasoil in HE-22/1.2; 4 – heavy vacuum gasoil and the second pumparound in HE-26/3.4; 5 – tar and quench in HE-31/3.4; 6 – vacuum column С-4; 7 – furnace F-3; 8 – furnace F-3N; 9 – fuel oil preheating unit
– parametric optimization of the new heat exchange system of the preheating unit;
– construction and study of the enthalpy cascade, which shows what is the proportion of enthalpy in each temperature range;
– analysis of the heat exchange system using a grand composite curve, which will optimize the operation of the fuel oil preheating furnace.
Analysis of the existing heat exchange system of the fuel oil preheating unit
Before proceeding to the conversion of heat flows, namely their integration, it is necessary to understand the general structure of the fuel oil preheating unit. The heat exchange system of the vacuum unit for the distillation of fuel oil is shown in Fig.2. The raw material of the unit is fuel oil or a petroleum product similar in physical and chemical properties.
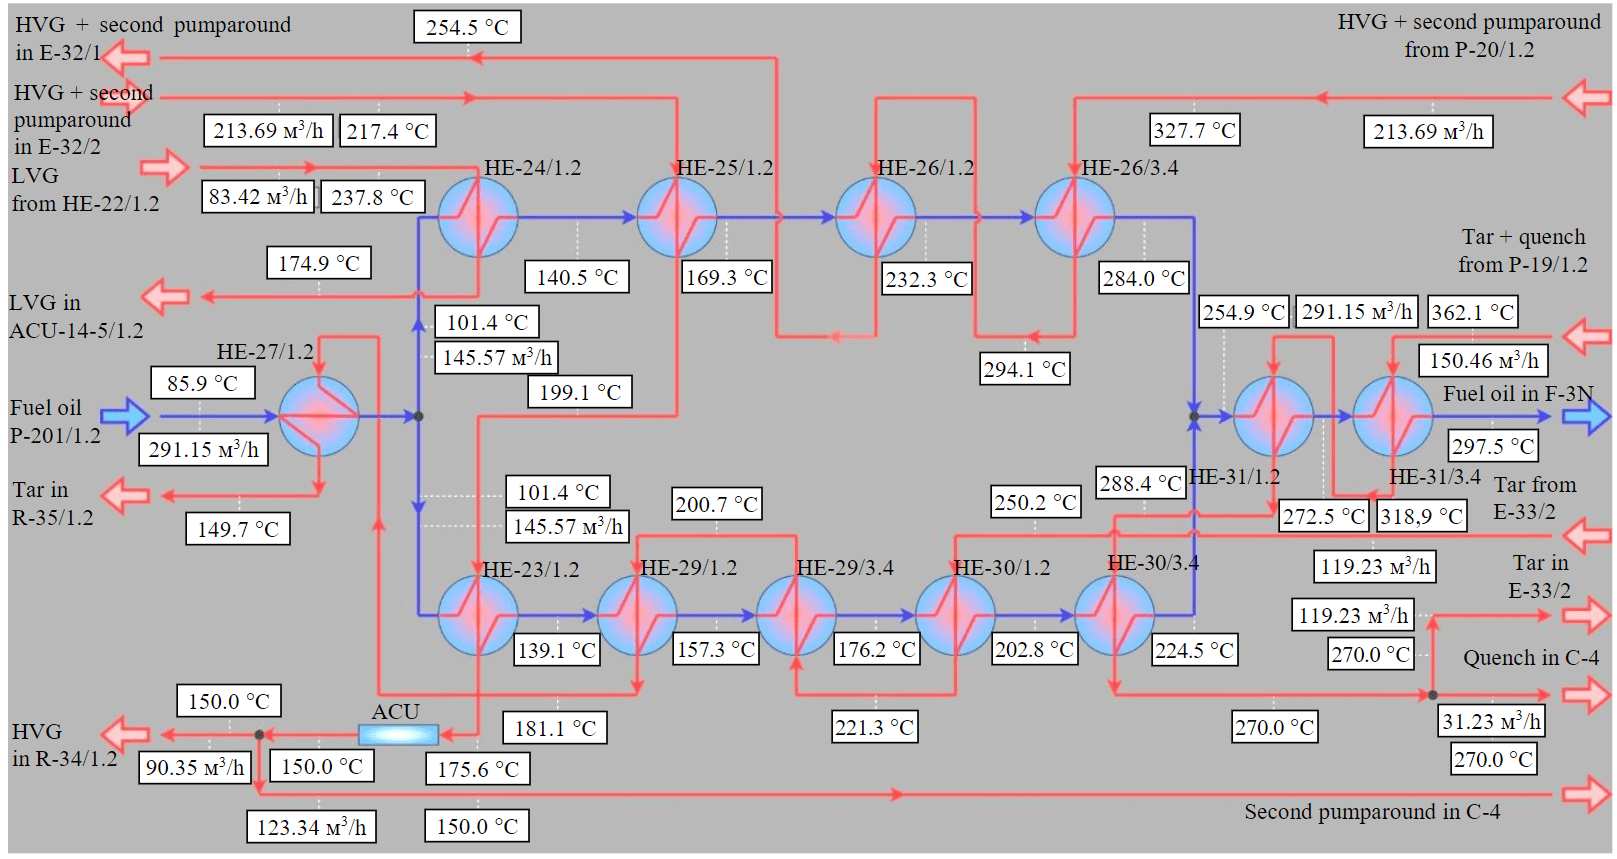
Fig.2. Heat exchange system of the fuel oil preheating unit
According to the set operating mode of the vacuum column, the temperature of the fuel oil entering the distillation column should be 393 °C. To achieve this temperature, fuel oil after the heat exchanger HE-31/3.4 enters the block of fire heating of raw materials (fuel oil), which consists of tubular furnaces for heating fuel oil F-3N and F-3. Fuel oil passes through the convection and radiant sections of the F-3N furnace, where it is heated to a temperature of 320 °C. At the same time, the F-3N furnace is four-flow. Fuel oil enters it in four flows and is also removed from it in four flows. Further, the fuel oil enters the F-3 furnace, where, when passing through the convection and radiant sections, it is heated to a temperature of 393 °C.
After passing through the fire heating unit, fuel oil with a temperature of 393 °C enters the vacuum column in two streams. Vacuum distillation column is designed for vacuum separation of fuel oil into fractions according to the following fuel scheme: vacuum diesel fraction; light and heavy vacuum gasoils; tar.
The cold flow of the unit is fuel oil. But for the construction of a cold composite curve, this flow will be represented as four separate cold flows. Hot flows are fuel oil fractions withdrawn from the distillation column for this technological scheme. After analyzing the technological scheme of the unit, five hot streams can be distinguished, which are used to heat fuel oil (cold streams) in the preheating unit. Heat flows are determined. The flow data are presented in Table 1.
The flow enthalpy change with a change in its temperature (at constant value of heat capacity within a given temperature interval) is determined according to the formula
where СР – flow heat capacity, is the product of mass flow and specific heat capacity, W/°C; Т1 – initial temperature; Т2 – final temperature.
The hot compound curve combines flows that give off heat. Fuel oil flows that require heating are combined into a cold composite curve. Cold and hot composite curves are plotted using flow data (Fig.3, а).
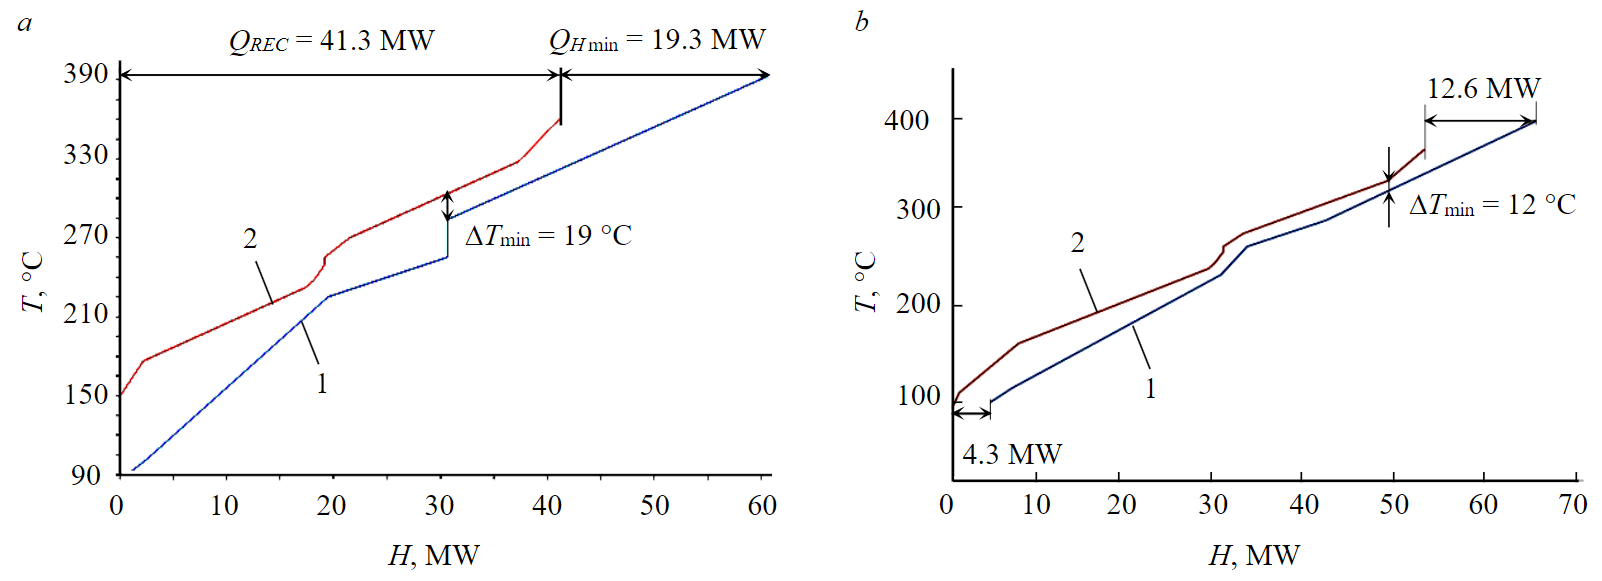
Fig.3. Flow composite curves before (a) and after (b) transformation 1 – cold; 2 – hot
Table 1
Initial data of heat flows of the unit
|
Type |
Flows |
Temperature, °C |
Mass flow, kg/s |
Specific heat capacity at constant pressure,kJ/(kg∙°C) |
Flow heat capacity, kW/°C |
Flow enthalpy change, MW |
|
|
Initial |
Final |
||||||
|
Hot flow 1 |
Heavy vacuum gasoil and second pumparound from column to HE-26/3.4 |
328 |
255 |
56.0 |
2.8 |
154.1 |
–11.2 |
|
Hot flow 2 |
Heavy vacuum gasoil and second pumparound from E-32/2 to HE-25/1.2 |
232 |
176 |
56.0 |
2.4 |
136.7 |
–7.7 |
|
Hot flow 3 |
Tar and quench from P-19/1.2 to HE-31/3.4 |
362 |
270 |
44.2 |
2.7 |
118.5 |
–10.9 |
|
Hot flow 4 |
Tar from E-33/2 to HE-30/1.2 |
250 |
150 |
35.0 |
2.3 |
81.5 |
–8.2 |
|
Hot flow 5 |
Light vacuum gasoil from HE-22/1.2 to HE-24/1.2 |
238 |
175 |
21.0 |
2.5 |
52.9 |
–3.3 |
|
Cold flow 1 |
Fuel oil from P-201/1.2 to HE-27/1.2 |
86 |
101 |
79.2 |
2 |
160.2 |
2.4 |
|
Cold flow 2 |
Fuel oil from HE-27/1.2 to HE-24/1.2 |
101 |
284 |
39.6 |
2.4 |
93.5 |
17.1 |
|
Cold flow 3 |
Fuel oil from HE-27/1.2 to HE-23/1.2 |
101 |
225 |
39.6 |
2.3 |
89.7 |
11.1 |
|
Cold flow 4 |
Fuel oil in HE-31/1.2 |
255 |
393 |
79.2 |
2.7 |
217.2 |
29.8 |
The value of the minimum temperature difference in the heat exchange system is obtained by changing the position of the cold composite curve on the temperature-enthalpy plane. This is due to the fact that the initial and final temperatures of the flows must be preserved, but the enthalpy is a relative value. Only the change in the flow enthalpies is preserved, therefore, compound curves can be shifted along the x-axis on the TH-diagram [22].
Plotting hot and cold composite curves on the temperature-enthalpy diagram allows you to determine the values of heat recovery, the values of external hot and cold utilities.
We obtained the data by analyzing the composition of the curves:
- the minimum temperature difference is the distance between the compound curves along the temperature axis on the TH-diagram:
- maximum heat recovery
- hot utilities
- cold utilities
The values of hot utilities QHmin determine the amount of external thermal energy, that is, the energy of cold streams is not enough. This energy must be supplied from external energy sources. The external sources are the F-3N and F-3 furnaces.
The cold utility QCmin values determine the amount of heat energy to be removed from the system. For a vacuum distillation unit, the residual heat of the hot flows is removed in refrigerators and air coolers. In order to reduce the required number of external hot utilities, it is necessary to investigate the possibility of post-cooling the existing hot flows in the fuel oil preheating unit before supplying them to refrigerators and air coolers. We will reduce the heat load of the F-3H and F-3 furnaces.
Consider the possibility of additional use of each of the hot streams presented in Table 1:
- Heavy vacuum gasoil and second pumparound from E-32/2 to HE-25/1.2. This flow passes through the heat exchangers HE-25/1.2, HE-23/1.2 and then enters the air-cooling units (ACU). After passing through the ACU, the flow is cooled from 176 to 150 °С. Although heavy vacuum gas oil must be cooled down to 80.4 °С before entering the park, the column's second circulating reflux must be cooled exactly to 150 °С, since this flow after the ACU enters the distillation column. Therefore, changing the temperature of the second circulating reflux of the column is unacceptable, as this may cause a change in the operating mode of the vacuum column. But it is possible to exclude ACU from work. We propose to cool this flow in heat exchangers HE-25/1.2 and HE-23/1.2 immediately to 150 °C. This will reduce the load on external hot utilities and reduce the power consumption of the ACU.
- Tar from E-33/2 to HE-30/1.2. This flow passes through the heat exchangers and enters the refrigerators, where it is cooled by heating the circulating water. This tar cooling is necessary. The temperature of the tar when entering the park or bitumen plant should be 96 °С. The temperature of the tar at the outlet of the preheating unit is 150 °С. We will consider the possibility of additional cooling of tar to 96 °С due to heat recovery. Thus, we exclude the operation of refrigerators R-35/1.2 and R-35/3.4.
- Light vacuum gasoil from HE-22/1.2 to HE-24/1.2. This flow passes through the heat exchanger HE-24/1.2. Then the flow enters the air coolers. Then the flow is discharged into the park or into the tar line into the park (depending on the requirements for the resulting products). The temperature of the light vacuum gas oil after the heat exchanger (HE-24/1.2) is 175 °С. The temperature of the light vacuum gasoil at the outlet of the unit should be 80°С. We propose to cool this flow down to 80 °С in a preheating unit. We will exclude air coolers and reduce the heat load of furnaces (F-3N and F-3).
Enthalpy pinch analysis of a fuel oil vacuum distillation unit
Data flows after transformations are presented in Table 2. Parameters of other flows are not changed. Composite curves on the temperature-enthalpy plane are shown in Fig.3, b. These composite curves are approximated to ΔTmin = 12 °C.
Table 2
Data flows after transformations
|
Type |
Flows |
Temperature, °C |
Mass flow, kg/s |
Specific heat capacity at constantpressure,kJ/(kg∙°C) |
Flow heat capacity, kW/°C |
Flowenthalpy change,MW |
|
|
Initial |
Final |
||||||
|
Hot flow 2 |
Heavy vacuum gasoil and second pumparound from E-32/2 to HE-25/1.2 |
232 |
150↓ |
56.0 |
2.4 |
134.2 |
–11 |
|
Hot flow 4 |
Tar from E-33/2 to HE-30/1.2 |
250 |
96↓ |
35.0 |
2.1 |
74.4 |
–11.5 |
|
Hot flow 5 |
Light vacuum gasoil from HE-22/1.2 to HE-24/1.2 |
238 |
80↓ |
21.0 |
2.3 |
48.7 |
–7.7 |
We obtained the data by analyzing the composition of the curves:
- the minimum temperature difference is the distance between the compound curves along the tem-perature axis on the TH-diagram DTmin= 12 °С;
- the amount of heat recovered (maximum heat recovery), which is determined by the area of overlap of the flow composite curves along the enthalpy axis on the TH-diagram: QREC= 48 МW;
- hot utilities QHmin= 12.6 MW;
- cold utilities QCmin= 4.3 MW.
The values of external hot and cold utilities were determined with the minimum temperature difference between the process flows (DTmin = 12 °С).
Due to the construction of composite curves, it is possible to set the value of the minimum temperature difference in the heat exchange chemical-technological system. So, for shell-and-tube heat exchangers, the minimum temperature difference must be at least 10 °С. This requirement is due to the fact that at small values of DTmin, heat exchangers must operate only in counterflow mode. When designing a new or reconstructing an existing heat exchanger, the optimal value of ∆Тmin is chosen by achieving an economic compromise between the dependencies on the minimum temperature difference between process flows in heat exchange equipment, the cost of external utilities (energy carriers), and capital investments in the heat exchange system.
The next stage of research and optimization of the unit is the construction of a heat cascade. The cascade clearly shows the process of heat exchange between flows [22]. To construct a heat cascade, it is necessary that the shifted compound curves touch each other at the pinch point. Imagine that hot flows are colder by ∆Tmin/2, and cold flows are colder by ∆Тmin/2. As a result of such a shift of composite curves along the temperature axis, heat transfer becomes possible between flows containing composite curves in cold and hot within each temperature interval. Changing the boundaries of temperature intervals keeps the heat balance of the entire system.
The energy values of external utilities and the localization of the pinch point will be determined at DTmin = 12 °С. To construct a heat cascade, it is necessary to obtain new temperatures shifted by DTmin/2. The changed values of the initial and final temperatures of the flows are presented in Table 3. The location of technological flows on the temperature axis after transformations is presented in Table 4.
Table 3
Shifted temperature intervals
|
Flow |
Type |
Tin, °С |
Tf, °С |
Tin, °С |
Tf, °С |
|
1 |
Cold |
86 |
101 |
92 |
107 |
|
2 |
–"– |
101 |
284 |
107 |
290 |
|
3 |
–"– |
101 |
225 |
107 |
231 |
|
4 |
–"– |
255 |
393 |
261 |
399 |
|
5 |
Hot |
328 |
255 |
322 |
249 |
|
6 |
–"– |
232 |
150 |
226 |
144 |
|
7 |
–"– |
362 |
270 |
356 |
264 |
|
8 |
–"– |
250 |
96 |
244 |
90 |
|
9 |
–"– |
238 |
80 |
232 |
74 |
Table 4
Heat balance in shifted temperature intervals
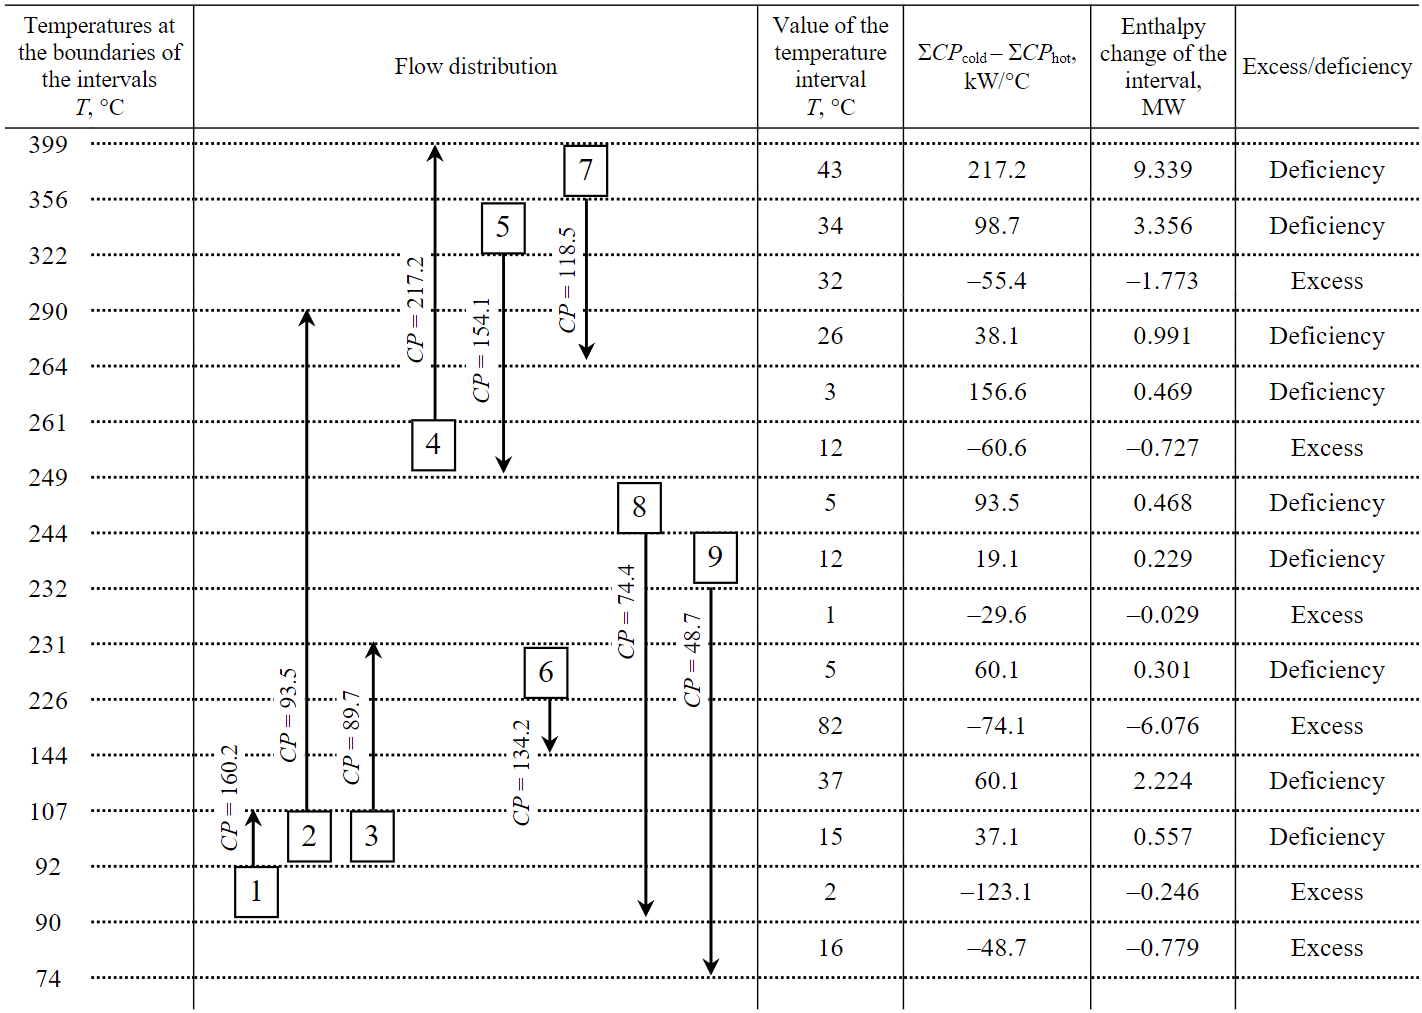
To solve the tabular problem, it is necessary to determine the energy balance for each shifted temperature interval. Formula for determining enthalpy change:
where SСРcold, SСРhot – the sum of the flow heat capacities of all cold and hot flows, respectively, W/°С; DTi – value of the i-th temperature interval, °С.
In formula (2), ∆Hi is the change in enthalpy for each shifted temperature interval. A positive value of ∆Hi means that there is a shortage of thermal energy in the i-th interval. It is necessary to supply heat from external sources. A negative value of ∆Hi means that there is an excess of thermal energy in the i-th interval. Enthalpy changes of each temperature interval are presented in Table 4.
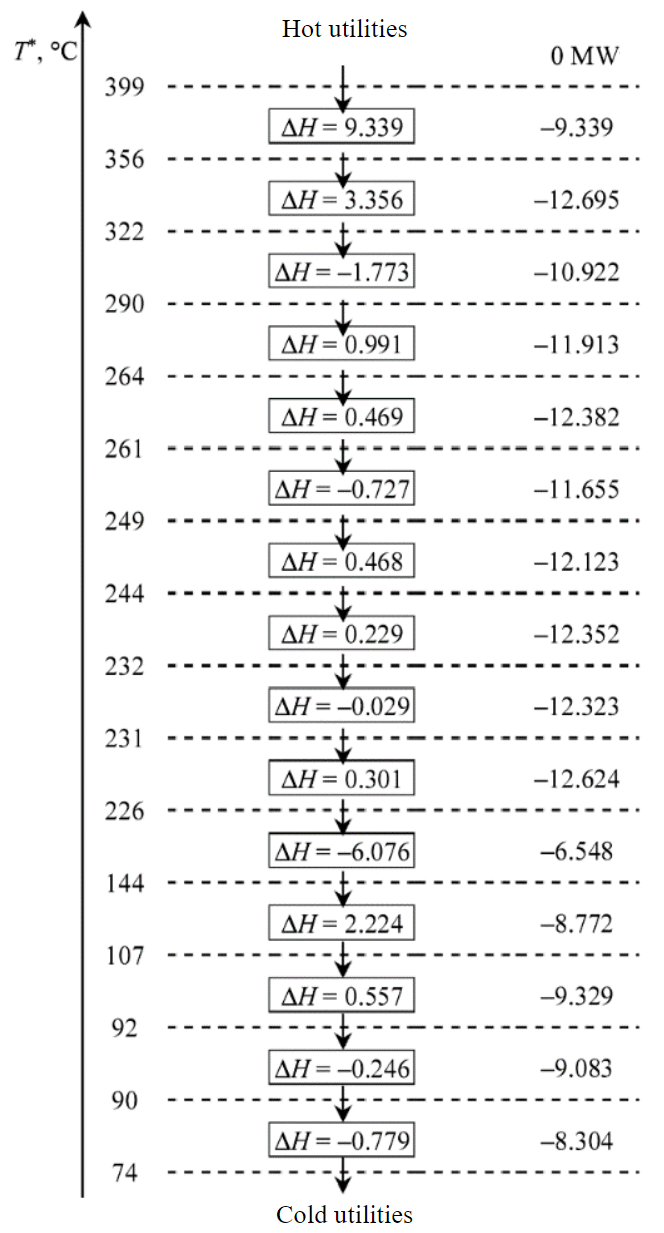
Fig.4. The enthalpy cascade at zero hot utilities
To consider the possibility of heat recovery between temperature intervals, it is necessary to build a cascade of heat flows (enthalpy cascade). The cascade sums up the enthalpy change from top to bottom. It is necessary to build two cascades. In the first case, the first temperature interval does not receive thermal energy from external energy carriers, i.e. QHmin = 0.The enthalpy cascade at zero hot utilities is shown in Fig.4.
Figure 4 shows that the first temperature interval has a net deficiency of thermal energy equal to –9.339 MW. This deficiency is transferred to the second temperature interval. The second interval also has a deficiency of thermal energy of hot streams 3.356 MW. As a result, the deficiency in the system is already –12.695 MW. The third temperature interval has an excess of thermal energy of hot flows –1.773 MW. The heat deficiency in the system decreases and becomes equal to –10.992 MW. According to this principle, an excess or deficiency of thermal energy is determined at each temperature interval. But the task of the study is to determine the location of the pinch, the values of hot and cold utilities using a heat flow cascade. It is necessary to build a second cascade, with non-zero hot utilities.
Heat flows cannot be negative because it is impossible to transfer energy up the temperature scale (from low temperatures to higher temperatures). There should be no negative flows. For this, the value of the largest negative value is brought to the first interval. In this study –12.69 MW (Fig.4). The resulting heat flow cascade is shown in Fig.5.
From the constructed cascade, we can conclude that in this case there are no negative heat fluxes. This indicates the possibility of transferring heat from one temperature interval to another. In this case, the heat flux is zero in the temperature range 322-356 °С. It can be concluded that the values of hot and cold utilities are QHmin = 12.6 and QСmin = 4.39 MW, respectively. The data are equal to the values obtained when constructing flow composite curves on the TH-diagram (see Fig.3, b). The pinch temperature is 322 °С. At the pinch point, the heat flow at the boundary of the intervals is zero. The real values of hot and cold flows at the pinch point are equal to and °С respectively. Values are consistent with data obtained from hot and cold composite curves.
Thus, the thermal cascade algorithm makes it possible to simplify the calculation of external energy carriers and determine the localization of the pinch point. The construction of composite flow curves makes it possible to visualize the relationship between hot and cold flows of a heat exchange system, i.e. this is necessary for a “conceptual understanding of the process”. The heat transfer system is then analyzed using the third pinch analysis tool, the grand compound curve. This analysis will optimize the operation of the furnace, which is an external hot source.
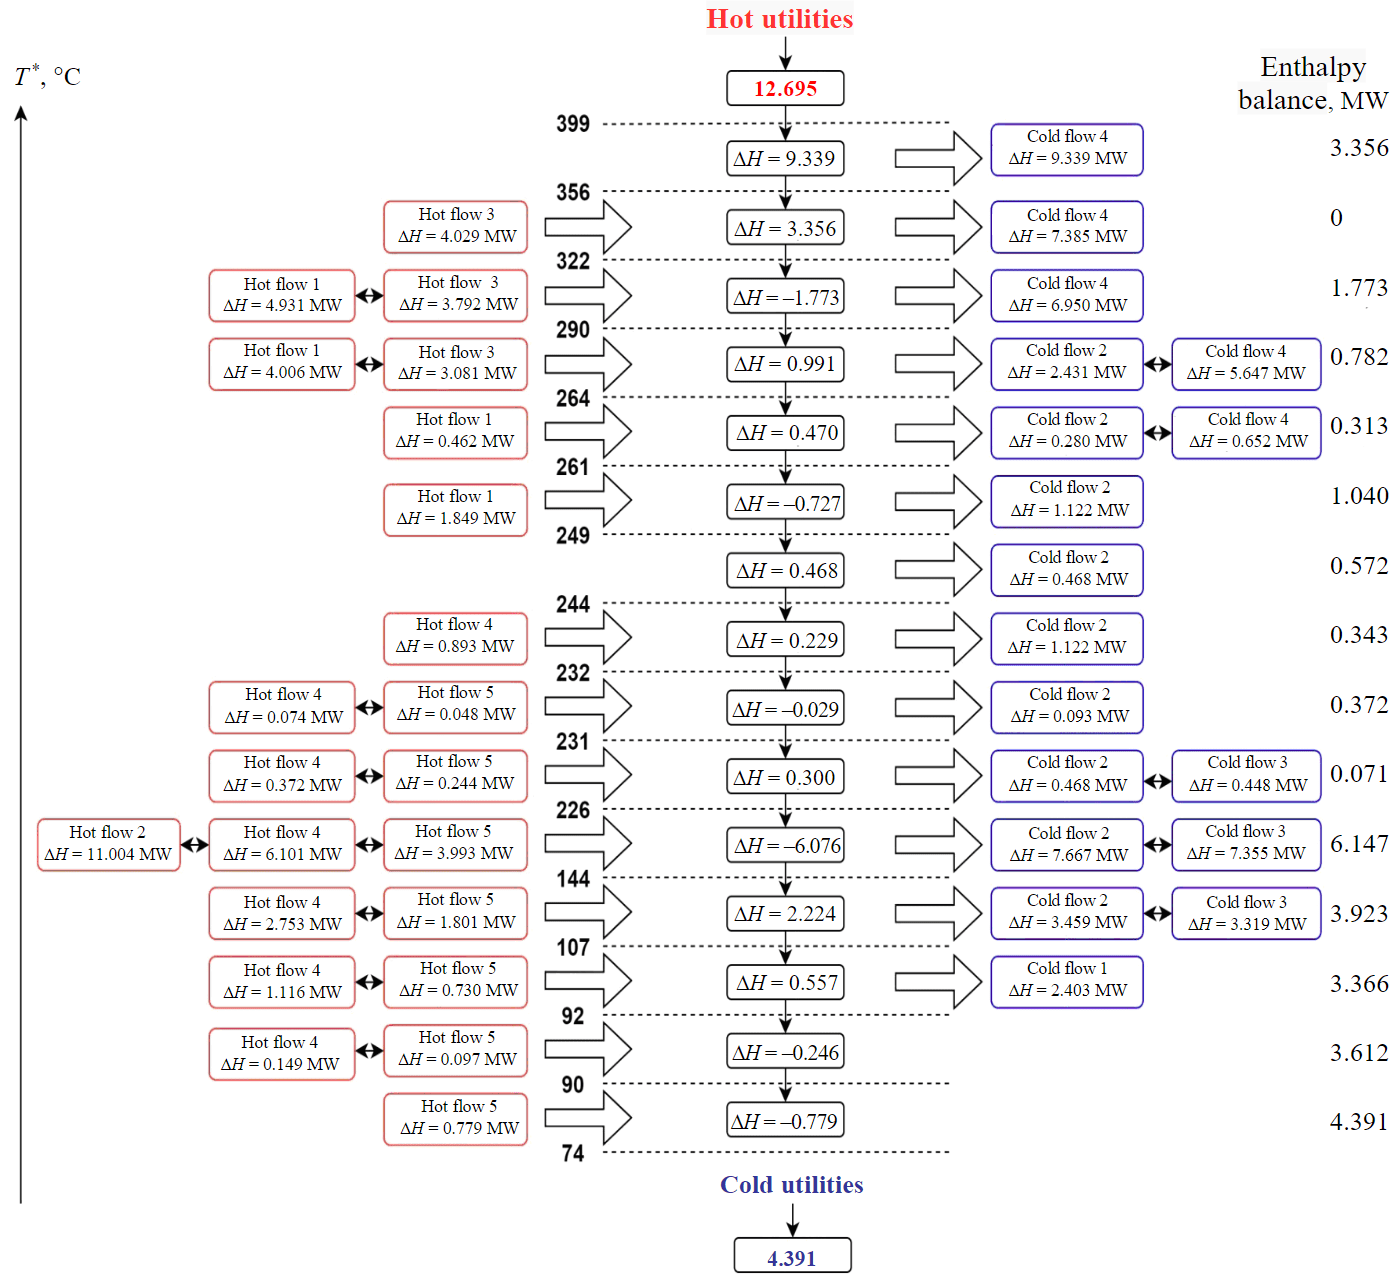
Fig.5. Thermal cascade of the heat exchange system of the fuel oil distillation unit ; for hot flows; for cold flow
The grand composite curve is built on the basis of the thermal cascade obtained earlier. It is a curve on the plane of shifted temperatures by DTmin/2 and enthalpy. On the x-axis put down the value of the deficiency of thermal energy in a given temperature interval (Fig.6). Furnace efficiency before optimization was 80 %. To analyze the furnace, a graph of flue gas temperatures is plotted, which is an inclined straight line. The same graph shows a grand composite curve. The first point is the burning temperature (T1furnace = 2000 °С), the second point is the flue gas temperature.
In the unit for different heat exchangers – different value ΔTmin. For the flows of the heat exchange system of the object of study, the shift in temperature intervals is defined and equal to 6 °C. For furnace flue gases, the shift will be equal to 25 °C. Then on recuperative flow heat exchangers ΔTmin = 12 °С, and on heat exchangers that transfer heat from flue gases to flows, ΔTmin = 6 + 25 = 31 °С.
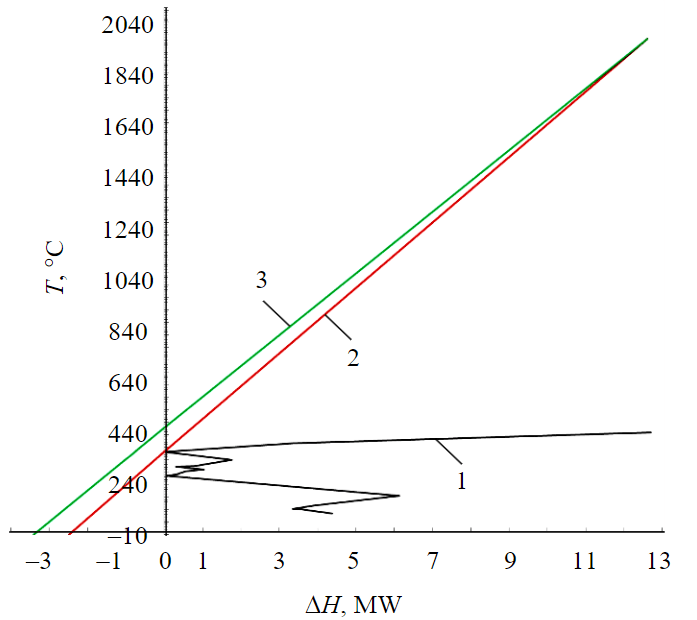
Fig.6. Grand compound curve and furnace flue gas profiles 1 – grand compound curve; 2 – flue gases N 1 СР = 0.0076 МW/°С; 3 – flue gases N 2 СР = 0.008 МW/°С
Since the ordinate shows shifted temperatures by ΔT/2, the flue gas profile starts at temperature 2000 – 25 = 1975 °С. The slope of the straight line above the pinch is unrestricted. By changing the slope of the curve, fuel consumption is optimized. For comparison, Fig.6 shows two flue gas lines drawn from the starting point. Line graph N 1 passes through the pinch point, line graph N 2 passes through the maximum temperature of cold streams. After crossing the straight axis of ordinates, the heat of the flue gases is removed to the atmosphere, i.e. this is the loss of the furnace with flue gases.
It can be seen from the graph that flue gases N 1 for the furnace are more efficient: heat losses with exhaust gases are minimal and equal to 2.29 MW; flow heat capacity is minimal.
Actual flue gas temperature 322 + 25 = 347 °С, it is above the acid dew point, i.e. eliminates the possibility of formation of sulfuric acid, which adversely affects structural materials. Minimum hot utilities are Qmin = 12.6 МW. Let us determine the optimal flow heat capacity of flue gases using the formula
In the ideal case, the energy given up by the fuel Qfuel, is equal to the energy that the flow gases gave up when cooled from the theoretical combustion temperature to the ambient temperature. Therefore, the formula is applied
The furnace efficiency is determined by the formula
Discussion of the results
Improving the energy efficiency of an oil refinery is an important and complex task. Pinch analysis allows you to analyze and optimize a large number of heat flows. Analysis and improvement of the energy efficiency of the objects of study were carried out by enthalpy pinch analysis.
Optimization measures are proposed:
- Change the final temperature of hot flow 2 from 176 to 150 °С, hot flow 4 from 150 to 96 °С, hot flow 5 from 175 to 80 °С. Thus, the enthalpy of hot flows increases and the costs for their cooling decrease.
- After parametric optimization, the values of the maximum heat recovery, the minimum values of external energy carriers were determined. In further studies, the structural optimization of the heat exchange system by pinch analysis will be carried out.
- The efficiency of the furnace can be increased by reducing heat loss with flue gases.
The technical characteristics of the furnace indicate that the flue gas temperature before optimization is 400 °С. Actual flow heat capacity of flue gases for heating cold flows 12.6 MW:
If take Qfuel for the ideal case:
The furnace efficiency before optimization is determined by the formula (5):
The calculated efficiency under design conditions is approximately the same. In this study, the furnace efficiency is increased by 4 %.
Conclusion
The existing heat exchange system of the fuel oil preheating unit was analyzed using enthalpy pinch analysis, the ways of optimization were determined. To reduce the heat load of the furnace, the additional flows were introduced into the heat exchange system of the fuel oil preheating unit.
The enthalpy pinch analysis of the fuel oil vacuum distillation unit and the parametric optimization of the new heat exchange system have been carried out. Hot and cold composite curves are plotted on the temperature-enthalpy plane. The minimum needs of the heat exchange system in external energy carriers are determined.
An enthalpy cascade at ΔTmin = 12 °С is constructed, which confirms the correctness of pinch point determination and the values of external energy carriers determined by parametric optimization.
The heat exchange system is analyzed using a large compound curve. This step made it possible to optimize the operation of the fuel oil heating furnace. The search for the optimal flow heat capacity of the combustion products of the furnace is an important point in the analysis of the energy efficiency of the furnace. The optimal flow heat capacity is determined, at which heat losses with outgoing gases are minimal.
Measures are proposed to improve the efficiency of the fuel oil preheating unit. Heat recovery is maximized and external energy costs are minimized. By reducing heat loss with flue gases, it was possible to increase the efficiency of the furnace from 80 to 84 %. The results of the study can be used to improve the energy efficiency of existing and projected facilities of the oil refining industry.
References
- Rudko V.A., Derkunskii I.O., Gabdulkhakov R.R. et al. Kinetics of various hydrocarbon groups formation in distillates obtained during the production of needle coke via the delayed coking of decantoil. Egyptian Journal of Petroleum. 2022. Vol. 31. Iss. 1, p. 33-38. DOI: 10.1016/j.ejpe.2022.02.002
- König W., Löbbe S., Büttner S., Schneider C. Establishing Energy Efficiency – Drivers for Energy Efficiency in German Manufacturing Small- and Medium-Sized Enterprises. Energies. 2020. Vol. 13. Iss. 19. N 5144. DOI: 10.3390/en13195144
- Muraveinikov S.S., Sulin A.B., Baranov I.V., Nikitin A.A. Average annual efficiency evaluation in the design of life support systems. AIP Conference Proceedings. 2019. Vol. 2141. Iss. 1. N 030019. DOI: 10.1063/1.5122069
- Xinxiao Chen, Paprouschi A., Elveny M. et al. A laboratory approach to enhance oil recovery factor in a low permeable reservoir by active carbonated water injection. Energy Reports. 2021. Vol. 7, p. 3149-3155. DOI: 10.1016/j.egyr.2021.05.043
- Pyagai I., Zubkova O., Babykin R. et al. Influence of Impurities on the Process of Obtaining Calcium Carbonate during the Processing of Phosphogypsum. Materials. 2022. Vol. 15. Iss. 12. N 4335. DOI: 10.3390/ma15124335
- Tsvetkov O.B., Laptev Yu.A., Nikitin A.A. et al. Energy and environment options of working fluid alternative for different refrigeration configurations. IOP Conference Series: Materials Science and Engineering. 2020. Vol. 826. N 012017. DOI: 10.1088/1757-899X/826/1/012017
- Kondrasheva N.K., Eremeeva A.M., Nelkenbaum K.S. et al. Development of environmentally friendly diesel fuel. Petroleum Science and Technology. 2019. Vol. 37. Iss. 12, p. 1478-1484. DOI: 10.1080/10916466.2019.1594285
- Tcvetkov P. Climate Policy Imbalance in the Energy Sector: Time to Focus on the Value of CO2 Utilization. Energies. 2021. Vol. 14. Iss. 2. N 411. DOI: 10.3390/en14020411
- Kopteva A., Kalimullin L., Tcvetkov P., Soares A. Prospects and Obstacles for Green Hydrogen Production in Russia. Energies. 2021. Vol. 14. Iss. 3. N 718. DOI: 10.3390/en14030718
- Malarev V., Kopteva A., Koptev V., Gotsul Yu. Improvement of Efficiency of Steam-Thermal Treatment of High-Viscous Oil Formations Using Downhole Electric Steam Generators. Journal of Ecological Engineering. 2021. Vol. 22. Iss. 2, p. 17-24. DOI: 10.12911/22998993/130630
- Morenov V., Leusheva E., Buslaev G., Gudmestad O.T. System of Comprehensive Energy-Efficient Utilization of Associated Petroleum Gas with Reduced Carbon Footprint in the Field Conditions. Energies. 2020. Vol. 13. Iss. 18. N 4921. DOI: 10.3390/en13184921
- Zhukovskiy Yu.L., Korolev N.A., Malkova Ya.M. Monitoring of grinding conditionin drum mills based on resulting shaft torque. Journal of Mining Institute. 2022. Vol. 256, p. 686-700. DOI: 10.31897/PMI.2022.91
- Shabalov M.Yu., Zhukovskiy Yu.L., Buldysko A.D. et al. The influence of technological changes in energy efficiency on the infrastructure deterioration in the energy sector. Energy Reports. 2021. Vol. 7, p. 2664-2680. DOI: 10.1016/j.egyr.2021.05.001
- Rogachev M.K., Nguyen Van T., Aleksandrov A.N. Technology for Preventing the Wax Deposit Formation in Gas-Lift Wells at Offshore Oil and Gas Fields in Vietnam. Energies. 2021. Vol. 14. Iss. 16. N 5016. DOI: 10.3390/en14165016
- Resniova E., Ponomarenko T. Sustainable Development of the Energy Sector in a Country Deficient in Mineral Resources: The Case of the Republic of Moldova. Sustainability. 2021. Vol. 13. Iss. 6. N 3261. DOI: 10.3390/su13063261
- Kumar R. A critical review on energy, exergy, exergoeconomic and economic (4-E) analysis of thermal power plants. Engineering Science and Technology, an International Journal. 2017. Vol. 20. Iss. 1, p. 283-292. DOI: 10.1016/j.jestch.2016.08.018
- Sciubba E. Exergy-based ecological indicators: From Thermo-Economics to cumulative exergy consumption to Thermo-Ecological Cost and Extended Exergy Accounting. Energy. 2019. Vol. 168. P. 462-476. DOI: 10.1016/j.energy.2018.11.101
- Aghbashlo M., Tabatabaei M., Hosseinpour S. On the exergoeconomic and exergoenvironmental evaluation and optimization of biodiesel synthesis from waste cooking oil (WCO) using a low power, high frequency ultrasonic reactor. Energy Conversion and Management. 2018. Vol. 164, p. 385-398. DOI: 10.1016/j.enconman.2018.02.086
- Nami H., Mahmoudi S.M.S., Nemati A. Exergy, economic and environmental impact assessment and optimization of a novel cogeneration system including a gas turbine, a supercritical CO2 and an organic Rankine cycle (GT-HRSG/SCO2). Applied Thermal Engineering. 2017. Vol. 110, p. 1315-1330. DOI: 10.1016/j.applthermaleng.2016.08.197
- Kondrasheva N.K., Rudko V.A., Nazarenko M.Yu., Gabdulkhakov R.R. Influence of parameters of delayed asphalt coking process on yield and quality of liquid and solid-phase products. Journal of Mining Institute. 2020. Vol. 241, p. 97-104. DOI:10.31897/PMI.2020.1.97
- Hon Huin Chin, Varbanov P.S., Fengqi You et al. Plastic Circular Economy Framework using Hybrid Machine Learning and Pinch Analysis. Resources, Conservation and Recycling. 2022. Vol. 184. N 106387. DOI: 10.1016/j.resconrec.2022.106387
- Smith R., Klemesh J., Tovazhnyansky L.L. et al. Basics of integration of thermal processes. Kharkov: NTU “KhPI”, 2000, p. 458.
- Ibrahim D., Jobson M., Jie Li, Guillén-Gosálbez G. Optimal design of flexible heat-integrated crude oil distillation units using surrogate models. Chemical Engineering Research and Design. 2021. Vol. 165, p. 280-297. DOI: 10.1016/j.cherd.2020.09.014
- Ndunagu P.U., Alaike E.E., Megueptchie T. A Practical Approach to Energy Optimization Using Pinch Analysis: A Case Study of an Oil Refinery. SPE Nigeria Annual International Conference and Exhibition, 2-4 August 2021, Lagos, Nigeria. OnePetro, 2021. N SPE-207096-MS. DOI: 10.2118/207096-MS
- Yong Zheng. Optimization of Chenzhuang Combined Station through Pinch Analysis. Journal of Physics: Conference Series. 2023. Vol. 2442. N 012036. DOI: 10.1088/1742-6596/2442/1/012036
- Bayomie O.S., Abdelaziz O.Y., Gadalla M.A. Exceeding Pinch limits by process configuration of an existing modern crude oil distillation unit – A case study from refining industry. Journal of Cleaner Production. 2019. Vol. 231, p. 1050-1058. DOI: 10.1016/j.jclepro.2019.05.041
- Kunru Yang, Shirun Liu, Chang He et al. Improving energy saving of crude oil distillation units with optimal operations. Journal of Cleaner Production. 2020. Vol. 263. N 121340. DOI: 10.1016/j.jclepro.2020.121340
- Gadalla M.A. A new graphical method for Pinch Analysis applications: Heat exchanger network retrofit and energy integration. Energy. 2015. Vol. 81, p. 159-174. DOI: 10.1016/j.energy.2014.12.011
- Alhajri I.H., Gadalla M.A., Abdelaziz O.Y., Ashour F.H. Retrofit of heat exchanger networks by graphical Pinch Analysis – A case study of a crude oil refinery in Kuwait. Case Studies in Thermal Engineering. 2021. Vol. 26. N 101030. DOI: 10.1016/j.csite.2021.101030
- Dianliang Fu, Zeting Yu, Yanhua Lai. Linking pinch analysis and shifted temperature driving force plot for analysis and retrofit of heat exchanger network. Journal of Cleaner Production. 2021. Vol. 315. N 128235. DOI: 10.1016/j.jclepro.2021.128235
- Mrayed S., Bin Shams M., Al-Khayyat M., Alnoaimi N. Application of pinch analysis to improve the heat integration efficiency in a crude distillation unit. Cleaner Engineering and Technology. 2021. Vol. 4. N 100168. DOI: 10.1016/j.clet.2021.100168
- Konur O., Saatcioglu O.Y., Korkmaz S.A. et al. Heat exchanger network design of an organic Rankine cycle integrated waste heat recovery system of a marine vessel using pinch point analysis. International Journal of Energy Research. 2020. Vol. 44. Iss. 15, p. 12312-12328. DOI: 10.1002/er.5212
- Qi Zhang, Jin Xu, Xiaoyu Zhao, Yujie Wang. Energy and exergy analyses of an integrated iron and steel making process. International Journal of Exergy. 2018. Vol. 26. N 4, p. 454-480. DOI: 10.1504/IJEX.2018.093190
- Goodarzvand‐Chegini F., GhasemiKafrudi E. Application of exergy analysis to improve the heat integration efficiency in a hydrocracking process. Energy & Environment. 2017. Vol. 28. Iss. 5-6, p. 564-579. DOI: 10.1177/0958305X17715767
- Lebedev V.A., Yushkova E.A. Exergy pinch analysis of all elements of the boiler unit and the boiler unit as a whole. Bulletin of the Tomsk Polytechnic University, Geo Assets Engineering. 2020. Vol. 331. N 8, p. 92-98. DOI: 10.18799/24131830/2020/8/2771