
Optimisation of blast-induced rock fragmentation using hybrid artificial intelligence methods at Orapa Diamond Mine (Botswana)
- 1 — Master's Degree Research Assistant Botswana International University of Science and Technology ▪ Orcid
- 2 — Ph.D. Lecturer Botswana International University of Science and Technology ▪ Orcid
- 3 — Ph.D. Head of Department Botswana International University of Science and Technology ▪ Orcid
- 4 — Ph.D. Head of Department Botswana International University of Science and Technology ▪ Orcid
Abstract
This study demonstrates various artificial intelligence methods to predict and optimise blast-induced rock fragmentation at Orapa Diamond Mine in Botswana. These techniques include an artificial neural network (ANN), an adaptive neuro-fuzzy inference system (ANFIS), a genetic algorithm with ANN (GA-ANN), and particle swarm optimization with ANN (PSO-ANN). A collection of data from 120 blasting events with nine input parameters at the mine was utilized for this task. The results indicate that the PSO-ANN model outperforms other models in predicting blast-induced fragmentation. We used the optimal PSO-ANN model to optimise fragmentation, identified using the Monte Carlo method. The optimal model consists of nine inputs, two hidden layers with 65 and 30 neurons, and one output (7-65-30-1). Using gradient descent, we navigated this ten-dimensional solution space to determine the optimised blast design parameters and achieved an optimal fragmentation value of approximately 86 %. Sensitivity analysis results reveal that the most influential input parameters on fragmentation are rock factor (15.3 %), blastability index (14.7 %), and spacing-to-burden ratio (14.7 %). In contrast, the stiffness ratio has the least influence on fragmentation (6.3 %).
This research project was funded by Debswana Diamond Company with grant N P00064.
Introduction
Drilling and blasting are recognized as the most effective methods for rock fragmentation in the mining and civil engineering industries. This means that production blasting in mining plays a significant role in the subsequent operations, including loading, hauling, and crushing. Generating fragments with an optimal particle size distribution enhances the efficiency of these downstream processes [1]. Hence, the precise prediction of rock fragmentation following blasting is crucial in enhancing the overall economics of mining and plant operations [2]. Both controllable and uncontrollable parameters influence rock fragmentation. The controllable factors are the blasting design parameters and explosive properties, whereas uncontrollable parameters include the geomechanical properties of the rock [3, 4].
There are numerous empirical models designed to predict rock fragmentation [5-7]. Yet, these models often lack reliability and accuracy as they cannot capture the non-linear relationships among all relevant parameters. This led to the application of artificial intelligence methods in mining engineering and rock mechanics [8-13]. N.Ghaeini et al. [14] used mutual information method (MI) for forecasting rock fragmentation from blasting at the Meydook Copper Mine. The Kuznetsov – Rammler model (KuzRam) was also used for comparison purposes. The model inputs involved ten input parameters with a dataset of 36 blasts. The study found the MI method was the most effective with an R2 = 0.81. In a different study, S.Shams et al. [15] used a fuzzy inference system (FIS), multiple regression analysis (MRA), and empirical models by Kuznetsov and SveDeFo for predicting rock fragmentation. The FIS model outperformed the statistical and empirical models, achieving a coefficient of determination R2 = 0.922.
P.Asl et al. [16] applied artificial neural network (ANN) aided by “firefly algorithm” (FFA) for predicting and optimizing rock fragmentation caused by blasting in the Tajareh limestone mine. The parameters that were considered for the study were (burden, blast-hole, spacing, hole length, sub-drilling, stemming, powder factor, charge in each delay and geological strength index (GSI). The R2 value for the ANN from the study was 0.94 and sensitivity analysis showed that GSI and burden had the most influence on fragmentation. L.Dimitraki et al. [17] used a dataset from 100 blasts to predict the particle size from blast-induced fragmentation. They employed ANN, with powder factor, blastability index and quantity of blasted rock pile as inputs. The ANN had an R2 value of 0.80 in predicting fragmentation. The SVR yielded superior results with the highest accuracy and the lowest error, while the Kuznetsov method had the lowest accuracy and highest error. Lastly, E.Ebrahimi et al. [18] employed ANN and an artificial bee colony (ABC) algorithm for predicting and optimizing back-break and rock fragmentation. As a benchmark, an empirical model (KuzRam) was used to predict the mean fragment size. The findings showed the ABC algorithm’s superior capability to optimize rock fragmentation compared to the other models.
This work brings several contributions to the field. First, it applies blasting data from Debswana Diamond Company in Orapa, Botswana. Second, the study utilsises a dataset drawn from 120 blasting events. Third, it includes nine input parameters: spacing-to-burden ratio S/B, stiffness ratio H/B, stemming T, hole diameter D, powder factor Pf, the charge per delay C, and hole depth L, rock factor Rf, and blastability index BI. Fourth, it employs four machine learning techniques: ANN, adaptive neuro-fuzzy inference system (ANFIS), GA-ANN, and PSO-ANN. Fifth, the study models an eight-dimensional solution surface using PSO-ANN to predict, optimise and find inverse solution of blast-induced rock fragmentation with the gradient descent method. Lastly, a sensitivity analysis is performed using the network weights of the PSO-ANN model and validated through the SHapley Additive exPlanations (SHAP) method. The methodology proposed in this paper is compared with two related studies.
M.Hasanipanah et al. [19] predicted the rock fragmentation resulting from blasting activities in the Shur River dam region, situated in the Southern part of the Kerman province, Iran. They used a dataset comprising 72 blasts and five input parameters, namely, the maximum charge per delay, stemming, burden (RMR), spacing, and specific charge. Their study employed three machine learning algorithms, ANFIS, PSO-ANFIS, and SVR, along with a statistical non-linear multiple regression method. They carried out sensitivity analysis using the cosine amplitude method.
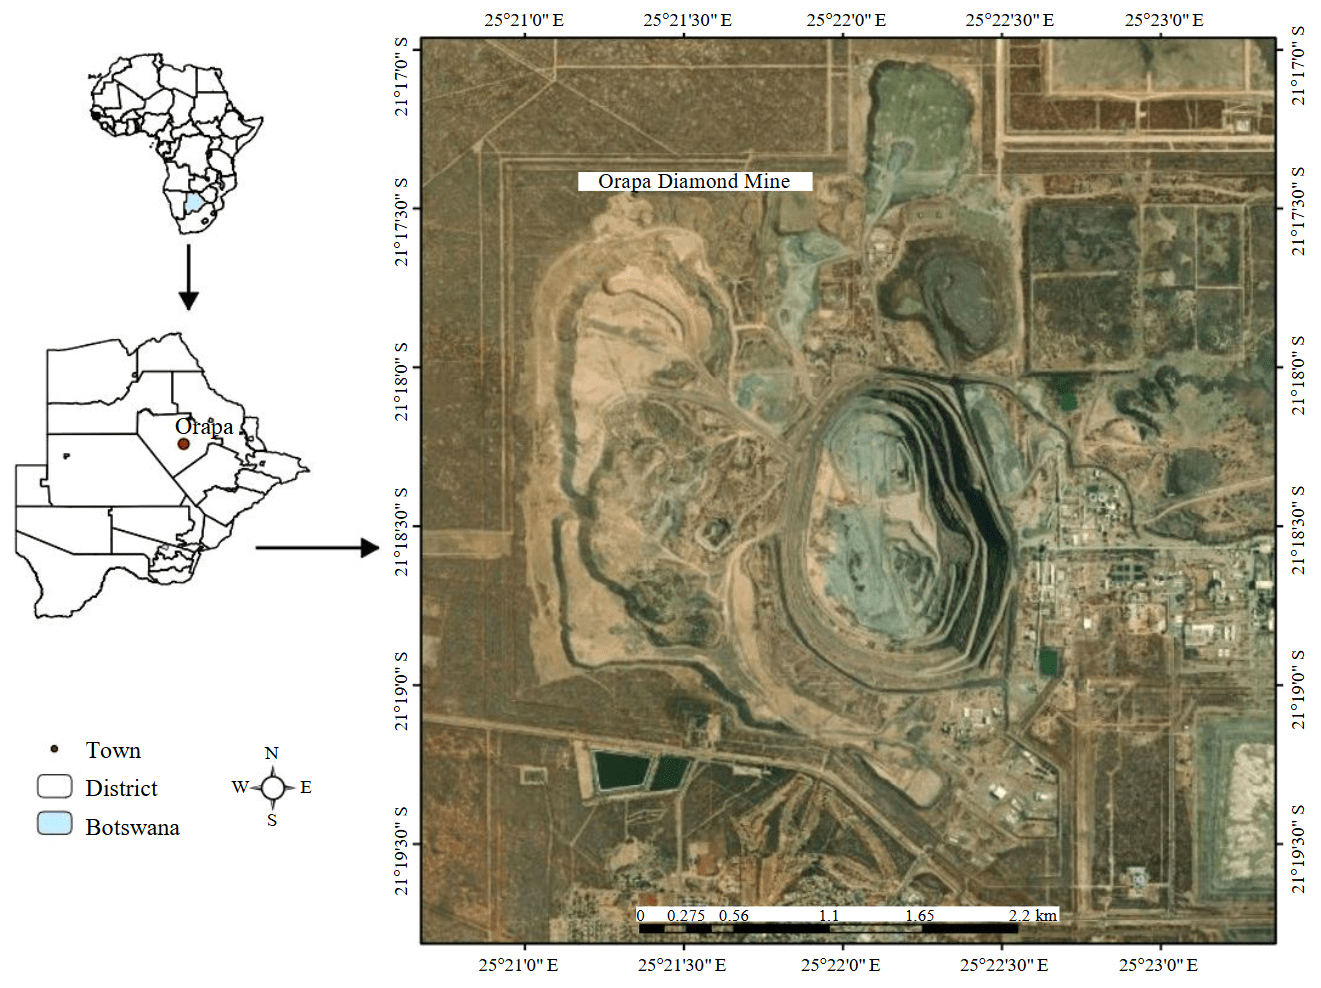
Fig.1. Orapa Diamond Mine
J.Zhou et al. [20] predicted blast-induced rock fragmentation in the Shur River dam region of Iran. They utilized a dataset involving 88 blasts and six input parameters, namely, maximum charge per delay, burden, powder factor, spacing, stemming, and rock mass rating RMR. They implemented five machine learning algorithms, specifically, ANFIS-GA, ANFIS-firefly algorithm (FFA), ANFIS, SVR, and ANN. They conducted a sensitivity analysis using the cosine amplitude method.
Mine Case Study
Orapa Diamond Mine is situated in Botswana, Southern Africa (Fig.1). The mine’s resources include a single volcanic pipe that splits into deep north and south pipes, penetrating through Transvaal strata and Karoo sediments formed over 200 million years ago. The blasting operations employ a staggered pattern and primarily use two types of explosives: A and B. The bench height is 15 m, with blast holes that have diameters of 127, 165, and 250 mm. A typical row contains between 40 and 60 holes, and each blast involves 15 to 25 rows. Shovels, excavators, and rear dump trucks handle the blasted materials within the pit. Presently, the mining operations at Orapa reach a depth of 305 m and are projected to attain a depth of 350 m by 2026. Production fluctuates per mining plan, averaging about 2000 kg annually.
Methods
This section explores the dataset and methodologies employed in this study, focusing on the datasets collected from the mining operation, the machine learning techniques applied, and the optimization processes implemented.
Dataset
Blasting data with 120 blasting events was collected from the mine records for training and testing the models proposed in this research. An overview of the parameters and their ranges considered in this study is provided in Table 1.
Table 1
Input and output parameters
|
Parameter |
Type |
Min |
Max |
|
Stiffness ratio Н/В |
Input |
2.5 |
3.75 |
|
Spacing to burden ratio S/B |
Input |
1.17 |
1.25 |
|
Stemming length Т, m |
Input |
4 |
5 |
|
Hole depth L, m |
Input |
12.73 |
15.34 |
|
Hole diameter D, mm |
Input |
165 |
250 |
|
Charge per delay C, kg |
Input |
235.71 |
634.88 |
|
Powder factor Pf, kg/m3 |
Input |
0.3 |
1.2 |
|
Rock factor Rf |
Input |
3.26 |
7.62 |
|
Blastability index BI |
Input |
22 |
66 |
|
Fragmentation Fr, % |
Output |
70 |
81 |
Data preprocessing was first performed to ensure the quality and consistency of the dataset. This included cleaning, where missing or inconsistent values were handled, and normalisation, which scaled all input parameters to a uniform range to prevent features with larger magnitudes from dominating the learning process. The dataset was split into two subsets: 80 % for training and 20 % for testing. The training portion was further subjected to 6-fold cross-validation, where the data was partitioned into six equal folds (approximately 20 samples per fold). In this approach, five folds were used for training the model, while the remaining fold was used for validation, and the process was repeated six times to ensure that every sample contributed to both training and validation. The data pre-processing also includes a correlation matrix and principal components analysis. The performance indices used to assess the models are RMSE, R2, and mean absolute error (MAE). Split Desktop software was used to analyse and produce the particle size distribution (PSD) curve for fragmentation using images captured with a digital camera. The quality of fragmentation at the mine is assessed based on 76 % passing the 150 mm sieve size, less than 50 mm is considered undersize while above 150 mm is considered oversize. Figure 2 shows an image of the muck pile and the PSD curve from the Split Desktop software.
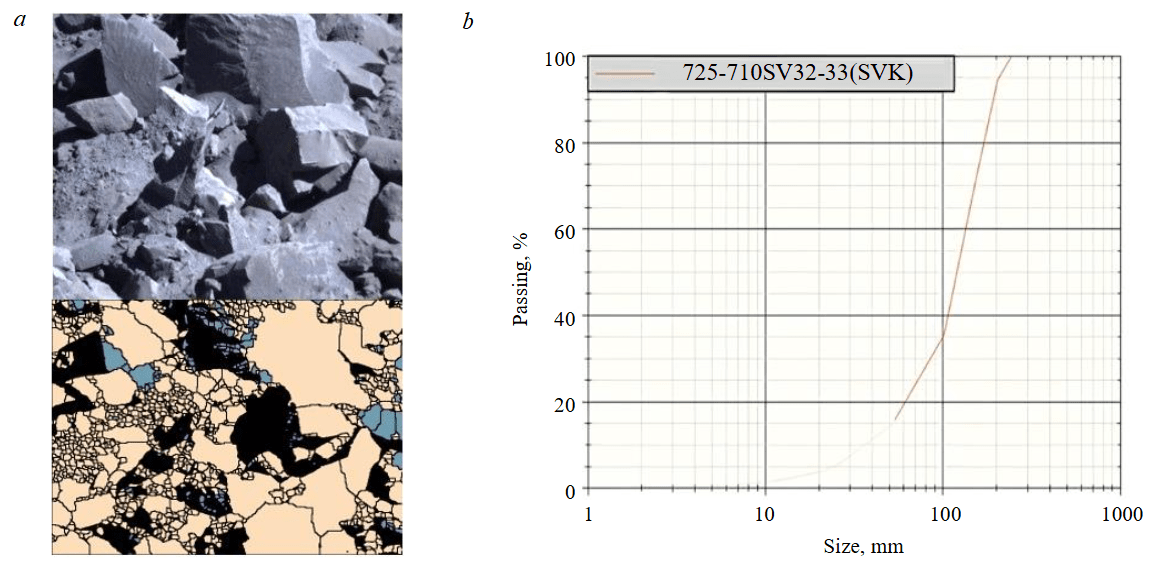
Fig.2. Muck pile image (a) and the Split Desktop PSD curve (b)
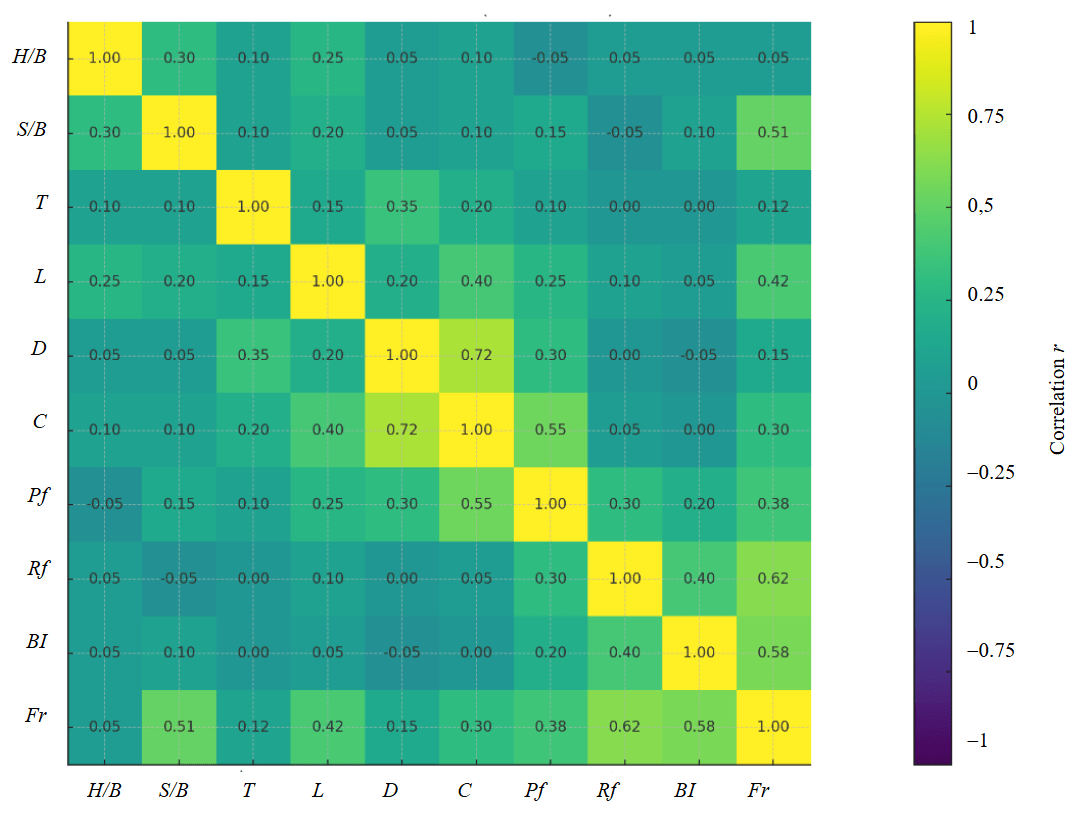
Fig.3. Correlation matrix
The correlation matrix (Fig.3) provides a linear snapshot of how rock and design variables relate to fragmentation Fr. The strongest positive links are with rock factor Rf (r ≈ 0.62) and blastability index BI (r ≈ 0.58), indicating that more favourable rock mass conditions tend to deliver finer breakage under comparable designs. Geometry also matters: spacing-to-burden S/B (r ≈ 0.51) is moderately high, consistent with better burden relief and crack interaction across rows within the tested window. Energy delivery terms support these trends – hole depth L (r ≈ 0.42) and powder factor Pf (r ≈ 0.38) increase with finer product, reflecting a longer charged column and higher energy per unit rock. By contrast, the stiffness ratio H/B (r ≈ 0.05) is near zero in this range, and hole diameter D shows only a small direct link to Fr, plausible where effective energy is governed more by charge C and Pf, and where decoupling or decking practices dilute any simple diameter effect.
Relationships among inputs align with practical design linkages. D-C (r ≈ 0.72) is highest because larger holes accommodate higher charge mass; C-Pf (r ≈ 0.55) follows since Pf scales with charge per rock volume. T-D (r ≈ 0.35) reflects scaling of stemming to hole size to preserve gas sealing, while H/B-S/B (r ≈ 0.30) co-moves because both ratios share the burden term. Overall, the matrix suggests that rock characteristics (Rf, BI) set the baseline fragmentation response, while geometry S/B and energy intensity (Pf, L, via C) act as the primary controllable levers. As this is a linear summary, non-linear or threshold effects common in blast geometry may be under-represented, so these correlations should be read as transparent guidance for design tuning rather than strict causal claims.
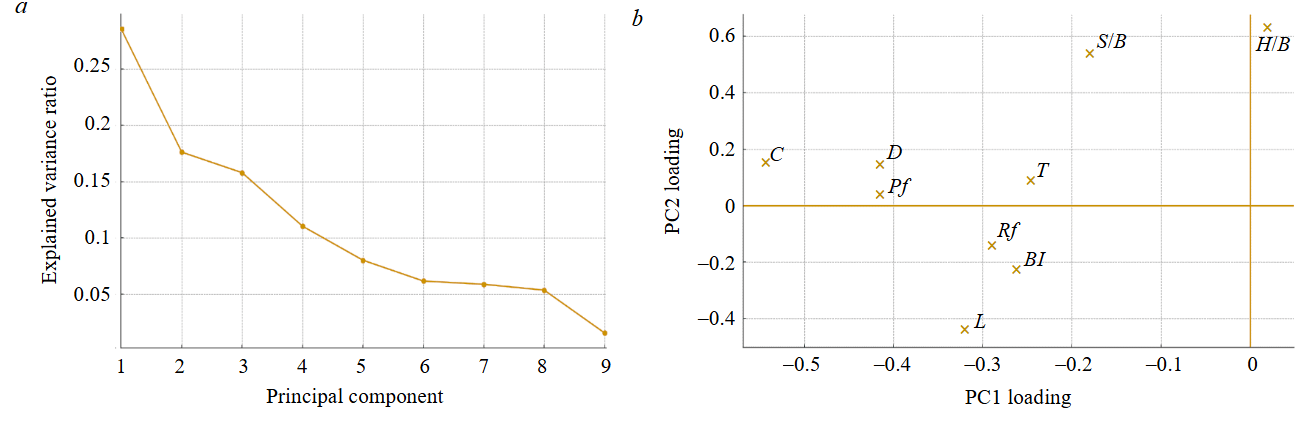
Fig.4. Principal component analysis: а – explained variance of the PCA components; b – PC1 and PC2 loadings
Principal component analysis (PCA) was applied to the nine input variables to summarise multicollinearity and reveal dominant blast design and rock factors. The first two components captured most of the input variance as shown by the scree plot in Fig.4, a. In Fig.4, b, PC1 is defined by large-magnitude loadings from C, D, Pf (and, to a lesser extent, T and L), representing an energy-scale axis (meaning greater hole, greater charge settings and more delivered energy). The PC2 contrasts relief ratios (H/B, S/B) against rockability indices (Rf, BI, negative), representing a rock-relief axis, meaning, given the same relief, tougher rockability needs more energy or design adjustment to hit the same fragmentation Fr. These results are consistent with the correlation matrix in Fig.3 in which relief/rockability variables (S/B, BI, Rf) dominate, with energy variables (Pf, L, C, D) providing a secondary, controllable influence.
AI methods
Several advanced machine learning techniques were utilised to predict rock fragmentation: ANN, PSO-ANN, ANFIS, and GA-ANN. Sensitivity analysis is conducted using the network weights of the best PSO-ANN model to determine the relative influence of input parameters on the output. The Monte Carlo method was utilised to systematically explore and evaluate various neural network architectures by varying the number of hidden layers (from one to three) and the corresponding number of neurons within each layer. This probabilistic sampling identified the optimum neural network architecture. Subsequently, gradient descent was applied to navigate the solution space and find the optimum value of rock fragmentation and the corresponding input parameters. To obtain a stable estimate of training runtime, the models were trained repeatedly for n = 10,000 cycles. At the start of the 10,000 cycles, we record the tstart. And at the end of the 10,000 cycles, we record tend.The average cycle time was computed as = (tend − tstart)/n. All timings were measured on an HP ProBook 455 G8 (laptop-class Ryzen 7 5800U CPU, 8 GB RAM, integrated Radeon graphics) under Python 3.11/TensorFlow 2.19. No discrete GPU acceleration was used.
The final cleaned sample of n = 120 blasts (from 2016-2024) is appropriate for the study’s objectives and parameter dimensionality (nine inputs), and it is in line with prior drill and blast modelling in the literature (Table 2), where high predictive accuracy has been achieved with datasets of similar or smaller size. To mitigate finite-sample risk and selection bias, we enforced a strict train/test separation with no leakage, used six-fold cross-validation only within the training set for model selection. On the blind test set, the best model (PSO-ANN) attains R2 = 0.96 and RMSE = 0.17, MAE = 0.30, consistent with the accuracy range reported for comparable sample sizes. Collectively, the dataset scale, alignment with published practice, and the validation/diagnostic controls support that the data are sufficient and fit-for-purpose for the modelling claims made.
Table 2
Performance indices from other studies
|
Best model |
Other models |
Inputs |
Dataset |
R2 |
Refe-rence |
|
PSO-ANFIS |
ANFIS; SVM; MNLR |
SC, T, S, B, MC |
72 |
0.89 |
[1] |
|
ANN |
|
D, L, B/S, T, Nr, Pf, RD, Tc |
250 |
0.98 |
[2] |
|
BPNN |
BPNN; RBFNN |
B, S, L, T, SC, SD |
103 |
0.90 |
[4] |
|
FIS |
FIS |
B, S, D, SHRN, DJ, Pf, T |
185 |
0.92 |
[15] |
|
FIS |
MVRA |
B, S, L, SD, T, MC, RD, Pf |
415 |
0.80 |
[16] |
|
ANN |
SVR; ANN; MVRA; Kuznetsov |
S/B, L/B, B/D, T/B, Pf, E, Xb |
90 |
0.96 |
[17] |
|
ANN |
ABC |
B, S, L, T, Pf |
34 |
0.78 |
[18] |
|
RES |
MVRA |
B, MIC, SC, S/B, T/B, H/B, Nr, INCL, D, B/D |
52 |
0.86 |
[19] |
|
FFA-ANFIS |
GA-ANFIS; ANFIS; SVR; ANN |
B, S, T, Pf, MC, RMR |
88 |
0.98 |
[20] |
|
FFA-ANN |
FFA-ANN; FFA-ANFIS; SVM; GPR; SVM; KNN |
Pf, MC, S, T, B, H |
136 |
0.98 |
[2] |
|
GPR |
SVM; ANFIS; PSO-ANFIS |
B, S, Pf, T, E |
72 |
0.95 |
[21] |
|
ANN |
SVR; Kuznetsov |
S/B, L/B, B/D, T/B, Pf, E, Xb |
102 |
0.87 |
[22] |
|
ANN |
MVRA |
D, Pf, TC, L, T, D, S/B |
180 |
0.99 |
[23] |
|
JSO-LGBM |
|
B, S, Pf, T, L, SD |
234 |
0.99 |
[24] |
|
ANN |
|
S, B, T, Pf, Lc, D, L |
70 |
0.88 |
[25] |
|
FFA-BGAM |
FFA-ANN; ANFIS; SVM; GPR; KNN |
Pf, MC, S |
136 |
0.98 |
[26] |
|
RES |
|
B, S/B, Pf, MH, H/B, HIL, HDVD, J/B, BI, IS, BHP, B/D |
64 |
0.93 |
[27] |
Note. BGAM – boosted generalized additive model; BPNN – back propagation neural network; MVRA – multi-variate linear regression; RES, rock engineering system; JSO-LGBM, jellyfish search optimizer-light gradient boosting machine; MIC – maximum instantaneous charge; INCL – hole inclination; GPR – Gaussian process regression; B/D – burden to hole diameter; L/B – hole depth to burden; T/B – stemming to burden; Xb – in situ block size; SC – specific charge; SD – sub-drilling; RD – rock density; J – density of joints; SHRN, Schmidt hammer rebound number; Nr – number of rows; PLI – point load index; Dr – delay between rows; MC – maximum charge; TC – total charge per delay; E – elastic modulus; UCS – uniaxial compressive strength; MH – maximum holes per delay; HIL – hole inclination; HDV – hole deviation; IS – initiation sequence; BHP – blast hole pattern.
The highest-performing model in Table 2 is the jellyfish search optimizer-light gradient boosting machine (JSO-LGBM,) by M.Yari et al. [24], which achieved an R2 of 0.99 using 234 datasets with six inputs (B, S, Pf, T, L, SD). This model’s superior performance can be attributed a large dataset, and the optimisation capabilities of the Jelly fish search optimizer (JSO) combined with GBM, which likely captures non-linearities more effectively than other models. The lowest-performing model is the ANN by E.Ebrahimi et al. [18] with an R2 of 0.78 using 34 datasets and five inputs (B, S, L, T, Pf). The limited dataset size and potentially less complex model architecture might have restricted the model’s ability to generalize and capture the variability in the data, leading to lower predictive accuracy.
In the middle range, the GPR model by W.Gao et al. [21] achieved an R2 of 0.95 using 72 datasets with five inputs (B, S, Pf, T, E) due to its ability to capture complex non-linear relationships using kernel functions like the radial basis function (RBF). Its uncertainty quantification makes it robust to noise, particularly in small-to-medium datasets like the 72 samples used. The GPRʼs smooth predictions, hyperparameter optimization, and flexibility in modeling intricate dependencies contributed to its strong performance.
Comparing these with our results, our PSO-ANN model achieved an R2 of 0.96 with 90 datasets and seven inputs. It performs well and aligns closely with other high-performing models, such as the ANN by L.Dimitraki et al. [17], which achieved an R2 of 0.96 with 90 blasting events. However, hybrid models that use advanced techniques and larger datasets, including FFA-ANN (R2 = 0.98, Q.Fang et al. [2]) and ANN with larger datasets (R2 = 0.97, M.Yari et al. [24]), perform slightly better than our model. These results imply that the accuracy and generalizability of model can be improved by increasing the dataset size and adding more inputs, allowing it to capture more complex interactions and improve generalizability, as seen in the highest-performing models.
Implementation of ANN
A three-layer feed-forward artificial neural network (ANN) was trained using the stochastic gradient descent method. To identify the optimal configuration for the network, a grid search combined with 6-fold cross-validation was performed. Several parameters were explored during grid search, including the number of hidden neurons (ranging from 5 to 50); learning rates (between 0.01 and 0.1); different activation functions such as rectified linear unit (ReLU), Sigmoid, and Tanh. Among these, the ReLU function consistently outperformed the others in terms of convergence and predictive accuracy. Table 2 demonstrates that a configuration with 15 neurons and a learning rate of 0.1 achieved the lowest RMSE across the folds. Training the three-layer ANN converged in 8 s for 100 epochs. Its dominant cost term is O(N·H), where N is the number of training samples processed per epoch; H is the number of hidden neurons (i.e., trainable weights), so that runtime increases with the increase in either N or H. When retraining, a warm start fine-tuning on an additional 10 % of new data was completed in ≈ 5 s.
Implementation of ANFIS
The ANFIS combines the principle of fuzzy logic into the neural network. The neural network constructs the if – then statements, acting as the rule building expert [28]. Grid search was used to tune the number of membership functions (ranging from 2 to 7), the type of membership function (Gaussian, triangular, and generalized bell), the learning rate (from 0.01 to 0.1), and the number of training epochs (50 to 150). A hybrid optimisation strategy, combining gradient descent with least squares estimation, was employed to fine-tune both premise and consequent parameters.
As illustrated in Table 2, the best model performance was achieved with three Gaussian membership functions and a learning rate of 0.1 across 100 epochs. Training the ANFIS model converged in 75 s. Its dominant cost term is O(N·R·M), where R is the number of fuzzy rules created during learning; M is the number of membership functions assigned to each input variable. Because every sample is evaluated against every fuzzy rule, training samples, and membership functions, runtime rises quickly if more data, rules, or functions are added. When retraining, ANFIS did not support quick fine-tuning, and any new data require rebuilding and retraining the full rule set.
Implementation of GA-ANN
According to the literature, ANN performance has been effectively improved using GA [29, 30]. The GA is a stochastic search method capable of avoiding entrapment in local minima, a common drawback of ANNs. Due to the significant advantage of GA in performing multi-directional searches, it can find global minima and improve the prediction capability of ANN [31]. Therefore, the weights and biases of the ANN were updated using GA. To overcome local minima problems often encountered in backpropagation-based ANN training, a hybrid model combining GA and ANN was implemented.
A comprehensive grid search explored key GA parameters such as population size (10-50), mutation rates (1-10 %), number of generations (50-150), and crossover strategies (single-point and uniform). During cross-validation, each parameter set was evaluated based on average RMSE to ensure the robustness of the selected configuration. Table 2 shows that a population size of 20, a mutation rate of 5 %, and 100 generations yielded the lowest error, and highest accuracy.
Training the GA-ANN (population – 20, generations – 100) took 115 s. Its dominant cost term O(P·G·H) depends on the genetic-algorithm population size P, the number of generations G, and the number of hidden neurons (weights) H in each network. Runtime therefore grows very fast if the population is enlarged, more generations are run, or a wider network is used. When retraining, because the genetic the search explores a new fitness landscape, a full retrain is usually needed whenever the data distribution changes.
Implementation of PSO-ANN
One of the shortcomings of ANN is that it can become stuck in the existence of local minima [32]. The PSO algorithm can search over a far larger space and locate global minima. As a result, the weights and biases of the neural network are updated to use the best positions discovered by the PSO method.
A three-layer back-propagation neural network was initialized with ten neurons in the hidden layer. Grid search was applied to explore a wide range of hyperparameters, including swarm size (10-50 particles), cognitive learning factor C1 (1.0-2.0), social learning factor C2 (1.5-2.0), inertia weight w (0.6-0.8), and the number of iterations (up to 150). The ANN architecture included a single hidden layer, and the number of neurons in this layer was also varied during the search. Table 3 reveals that the best-performing configuration used 30 particles, C1 = 1.3, C2 = 1.8, and an inertia weight of 0.8 over 100 iterations.
From Table 3, across all cross‑validation metrics (R2, RMSE, and MAE), the hybrid optimisation models consistently outperformed the standalone ANN and ANFIS models. PSO‑ANN achieved the highest predictive accuracy with the lowest error values, followed closely by GA‑ANN, while ANFIS showed moderate improvement over ANN.
Table 3
Cross-validation results for all the models
|
Model |
Best parameters |
Parameter (mean ± SD) |
||
|
R2 |
RMSE |
MAE |
||
|
ANN |
Neurons – 15; LR – 0.01 |
0.87 ± 0.03 |
1.15 ± 0.28 |
1.67 ± 0.19 |
|
ANFIS |
MF – 3; epochs – 200 |
0.89 ± 0.05 |
1.13 ± 0.32 |
1.34 ± 0.25 |
|
GA-ANN |
Neurons – 15; generations – 100; population – 20 |
0.93 ± 0.02 |
1.08 ± 0.21 |
1.12 ± 0.14 |
|
PSO-ANN |
Neurons – 15; particles – 30 |
0.95 ± 0.01 |
0.95 ± 0.17 |
0.85 ± 0.11 |
All the models exhibited low standard deviation (CD) values across the cross‑validation folds, indicating that their performance remained stable and consistent regardless of how the data was partitioned. This consistency, combined with the progressive improvement observed in the hybrid models, highlights the effectiveness of incorporating metaheuristic optimisation in enhancing model generalisation and reducing prediction errors. Training the PSO-ANN (swarm = 30 particles, iterations = 100) completed in 105 s. The dominant cost term O(S·I·H) shows very fast growth with the increase in swarm size S, the number of position-velocity update iterations I, and the hidden-layer size H. When retraining, the swarm’s last positions can be warm started, so an incremental update on fresh data is quicker than the initial run. Table 4 summarises the complexity or dominant cost expressions alongside the measured training time and the retraining considerations.
Table 4
Computational profile of the evaluated AI models: runtime, complexity, and retraining considerations
|
Model |
Train time |
Dominant cost |
Retraining note |
|
ANN |
8 s (100 epochs) |
O(N·H) |
Fine-tune on 10 % new data – 5 s |
|
ANFIS |
75 s |
O(N·R·M) |
Must retrain full rule-sets |
|
GA-ANN |
115 s (population – 100; generations – 20) |
O(P·G·H) |
Retrain required when data distribution shifts |
|
PSO-ANN |
105 s (swarm – 30; iterations – 100) |
O(S·I·H) |
Incremental update possible via warm start |
Sensitivity analysis
A sensitivity analysis was performed to assess the impact of input parameters on fragmentation using the network weights of the best-performing algorithm [33]:
where Ij indicates the relative importance of the j-th input variable on the output variable, ranging 0-1; Ni, Nh denote the number of neurons in the input and hidden layers, respectively. The network weights are represented by W; the superscripts i, h, o – correspond to the input, hidden, and output layers, respectively, while the subscripts k, m, n – denote the neuron numbers in the input, hidden, and output layers, respectively.
Gradient descent optimisation
This study employs gradient descent optimization alongside the Monte Carlo technique to fine-tune the architecture of the PSO-ANN used. The goal is to optimize a model with seven inputs, one output, and two hidden layers, specifically to determine the optimal number of neurons, which are 50 in the first layer and 25 in the second. Gradient descent, a widely used iterative optimisation algorithm in computational and machine learning applications, was employed to efficiently search the solution space to achieve maximum fragmentation and determine optimal blast-design parameters [34]. The underlying principle of gradient descent involves iteratively updating parameters by moving them in the direction opposite to the gradient of the objective function, thereby gradually converging towards the optimum. In this study, the gradient descent algorithm updates each input parameter according to the following rule:
where Pi represents the current value of the parameter being optimised; the term Poldi denotes the parameter’s value from the previous iteration, allowing the numerical calculation of the gradient via finite differences; the learning rate is represented as η, a small positive value controlling the magnitude of each update step, thus influencing both the stability and speed of convergence; the function f represents the PSO-ANN, which predicts rock fragmentation based on the blast design parameters.
Specifically, we set the learning rate η = 0.05 to ensure stable yet sufficiently rapid convergence. The iterative updates continued until the change in predicted fragmentation between consecutive iterations became less than 10–4, with a maximum allowable number of iterations set at 200 to prevent indefinite computations. Furthermore, by explicitly fixing the random seed at 42, this optimisation process is rendered fully reproducible.
Results and discussion
Three key performance indices were employed to assess each predictive model’s efficacy: RMSE, MAE, and R2:
where n is the number of observations; yi and y'i are the measured and predicted values of the i-th observation, respectively; and is the mean value.
Table 5 presents the performance indices of the best‑performing configurations of each model on both the training and testing datasets. Across all metrics, the results demonstrate notable variations in predictive capability depending on the chosen modelling approach and hyperparameter configuration. The PSO‑ANN model stands out as the best performer, achieving the highest R2 values (0.94 for training and 0.96 for testing) and the lowest error metrics (RMSE = 0.13 and 0.17; MAE = 0.25 and 0.30 for training and for testing). This indicates that the particle swarm optimisation algorithm effectively fine‑tuned the ANN parameters, enabling the model to learn complex input-output relationships while maintaining excellent generalisation to unseen data. The GA‑ANN model also performed strongly, with R2 values of 0.93 in both training and testing and comparably low RMSE and MAE values, confirming the benefit of using genetic algorithms for parameter optimisation.
Table 5
Best models calculated performance indices on the training and testing set
|
Model |
Parameter |
Training |
Testing |
||||
|
R2 |
RMSE |
MAE |
R2 |
RMSE |
MAE |
||
|
ANN |
Neurons – 15 |
0.87 |
0.45 |
0.50 |
0.85 |
1.75 |
1.57 |
|
GA-ANN |
Population – 10 |
0.93 |
0.15 |
0.80 |
0.93 |
0.80 |
0.47 |
|
PSO-ANN |
Particle size – 30 |
0.94 |
0.13 |
0.25 |
0.96 |
0.17 |
0.30 |
|
ANFIS |
MF – 3 |
0.91 |
0.42 |
0.50 |
0.87 |
1.36 |
1.08 |
The ANFIS model, although not the top performer, achieved solid results with R2 values of 0.91 (training) and 0.87 (testing). This shows that its hybrid neuro‑fuzzy approach can capture nonlinear relationships in the blasting data effectively, even without metaheuristic optimisation. In contrast, the ANN model exhibited the lowest predictive capability, with R2 values of 0.87 (training) and 0.85 (testing) and higher error metrics, suggesting that the basic network struggled to capture the data complexity compared to the hybrid approaches.
All models achieved high R2 values during training, indicating they learned the patterns in the dataset well. The testing performance also remained strong, especially for the hybrid models (GA-ANN and PSO-ANN), demonstrating good generalisation and minimal overfitting. The progression in results clearly highlights the impact of metaheuristic optimisation in improving predictive accuracy and stability for blast fragmentation modelling.
Figure 5, a illustrates that the predictions made by PSO-ANN model closely align with the actual fragmentation measurements, thus highlighting the model’s superiority in predicting fragmentation when compared with other models. The PSO-ANN model performs better than GA-ANN, ANFIS, and ANN due to the efficiency of PSO in exploring the search space and avoiding local minima, its capability to dynamically adjust velocity and position, and its computational efficiency. The PSO’s simpler update mechanisms allow it to find optimal solutions faster and more accurately than GA while avoiding the scalability issues of ANFIS. This hybrid approach leverages the strengths of both PSO and ANN, optimizing the neural network weights more effectively and leading to higher prediction accuracy.
Figures 5, b-d display the correlations between the observed and estimated fragmentation for each model. The majority of data points lie reasonably close to the best-fit line for all models, indicating their potential for fragmentation prediction. Among all the models, the ANN model’s data points diverge most from the best-fit line, therefore it has the lowest coefficient of determination R2. This shows that optimization algorithms can improve the performance of the ANN model, as all the optimized models (ANFIS, GA-ANN, PSO-ANN) perform better than the standalone ANN.
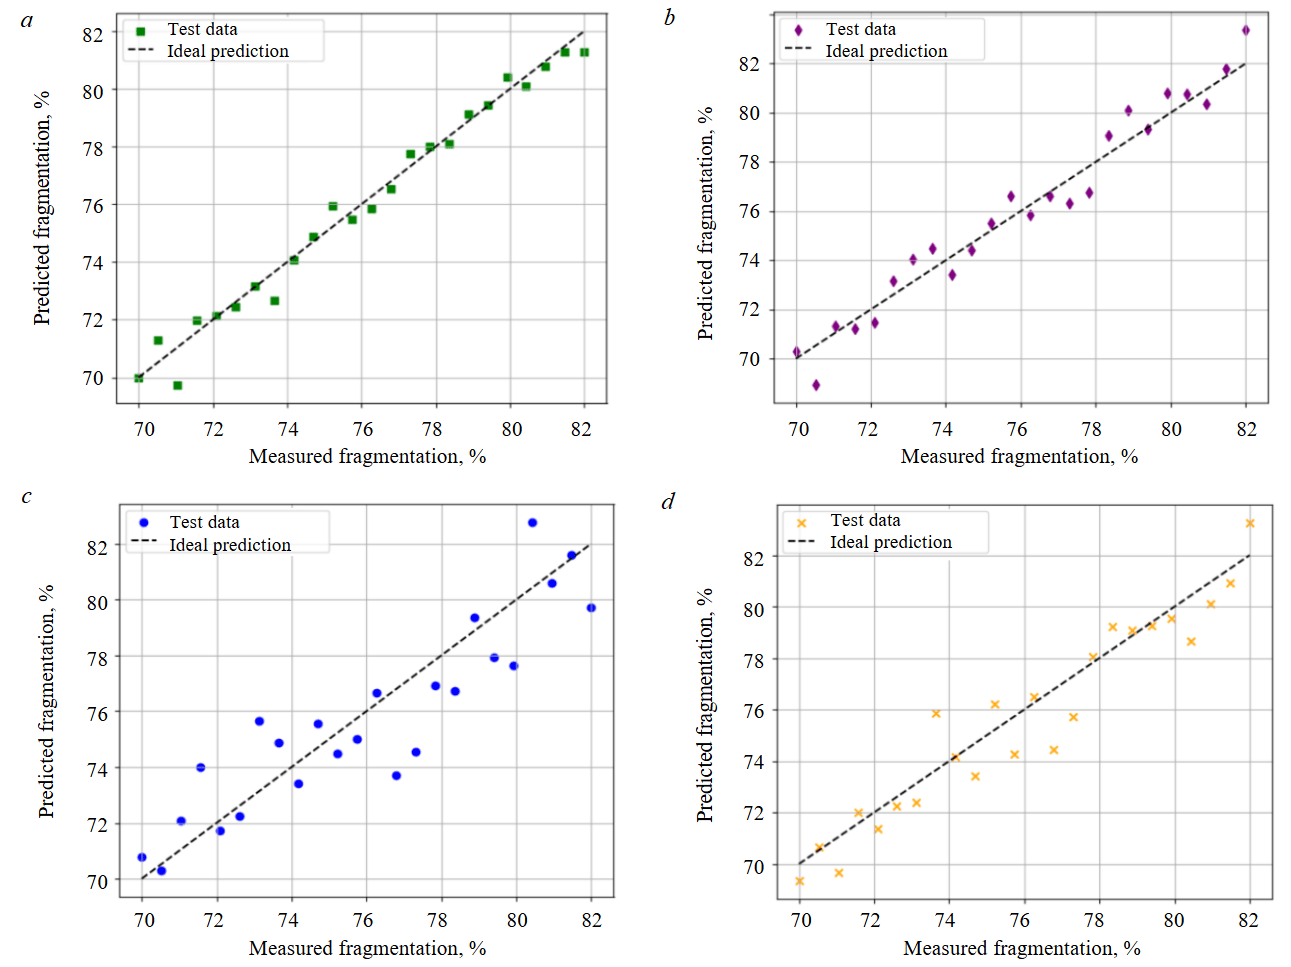
Fig.5. Scatter plots for the study models: а – PSO-ANN; b – GA-ANN; c – ANN; d – ANFIS
Sensitivity analysis
Figure 6, a shows a radar chart, each axis of the chart represents one of the input parameters (H/B, S/B, T, L, D, C, Pf, Rf, BI), the strength index Ij values are plotted along these axes. The area enclosed by the blue polygon reflects the relative sensitivity of each parameter. The blastability index BI, rock factor Rf, spacing-to-burden ratio S/B are the most influential input parameters, accounting for 15.3, 14.7 and 14.7 %, respectively, as indicated by the longest extension of the blue polygon. The stiffness ratio is the least effective parameter H/B (6.3 %) on fragmentation, with the shortest extension of the blue polygon. The sensitivity analysis highlights the critical role of the S/B ratio in influencing fragmentation [35-37]. These parameters should be given priority during the blast design process. The high sensitivity of the BI, Rf and especially S/B ratio as a controllable parameter, suggests that even minor adjustments can lead to significant changes in rock fragmentation, providing a powerful lever for engineers to control blast outcomes. On the other hand, the relatively low sensitivity of the H/B ratio indicates that it can be considered a secondary factor, allowing engineers to focus their optimisation efforts on more influential parameters. These sensitivity rankings are consistent with the correlation analysis, which also indicates strong positive associations for BI, Rf and S/B and a near-zero association for H/B.
Figure 6, b presents the mean absolute SHAP values for fragmentation Fr, illustrating the ave-rage contribution of each input parameter to the model’s prediction. SHAP is a unified framework based on cooperative game theory that explains individual predictions by computing the contribution of each feature relative to a baseline expectation [38]. From the figure, rock factor Rf emerges as the most influential parameter, followed by hole depth L, blastability index BI, and powder factor Pf. Other parameters such as stemming T, stiffness ratio H/B and hole diameter D have lower impacts.
These findings are consistent with the sensitivity analysis in Fig.6, a and the correlation matrix, confirming the robustness of the results. The agreement between SHAP and the sensitivity approach enhances confidence in the model’s interpretability and aligns with known blast physics, where rock properties and hole design factors dominate fragmentation outcomes.
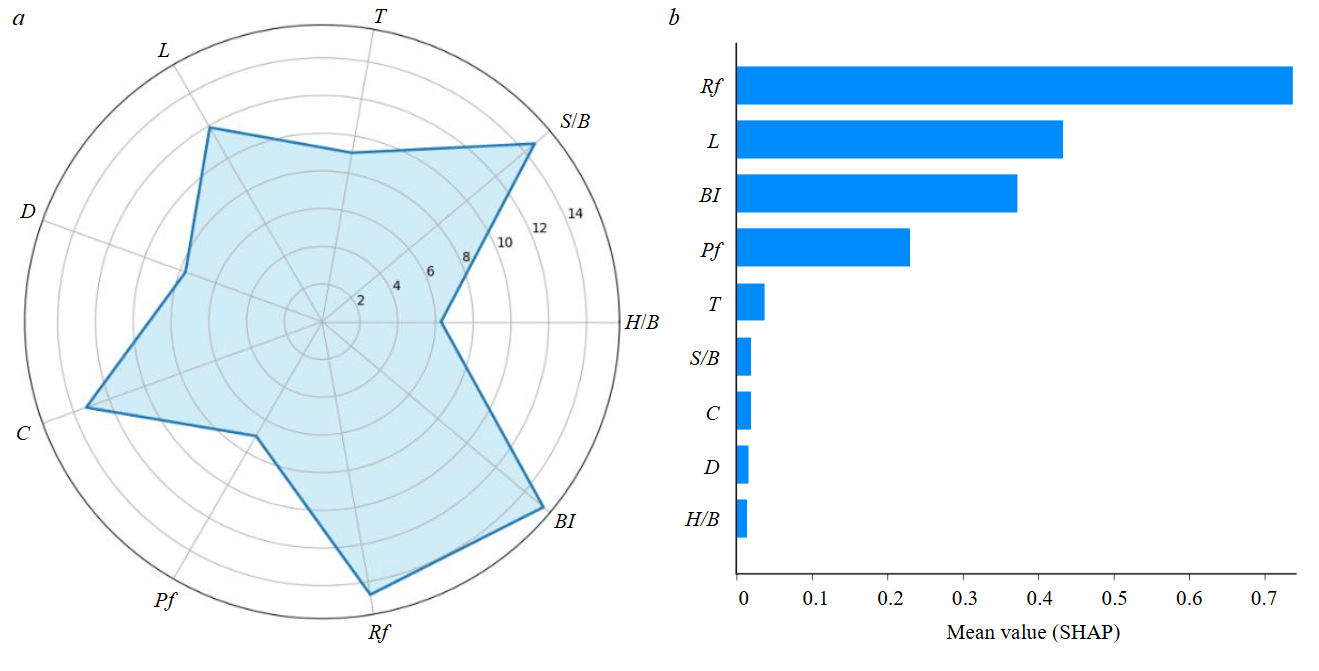
Fig.6. Sensitivity analysis (a) and mean absolute SHAP values (average impact on model output magnitude) for fragmentation (b)
Optimisation to maximize fragmentation
Figures 7, a-d illustrate the outcomes of the optimisation process, starting with seven initial points (represented as red dots) selected randomly and converging towards the optimised value (shown as blue dot). This optimisation enhanced fragmentation to about 86 %, with the refined input parameters being: powder factor Pf 0.56; charge per delay C 374; spacing to burden ratio S/B 1.2; stiffness ratio H/B 2.5; stemming T 4.6; hole depth L 15.5; diameter D 191; rock factor Rf 8 and blastability index BI 65.
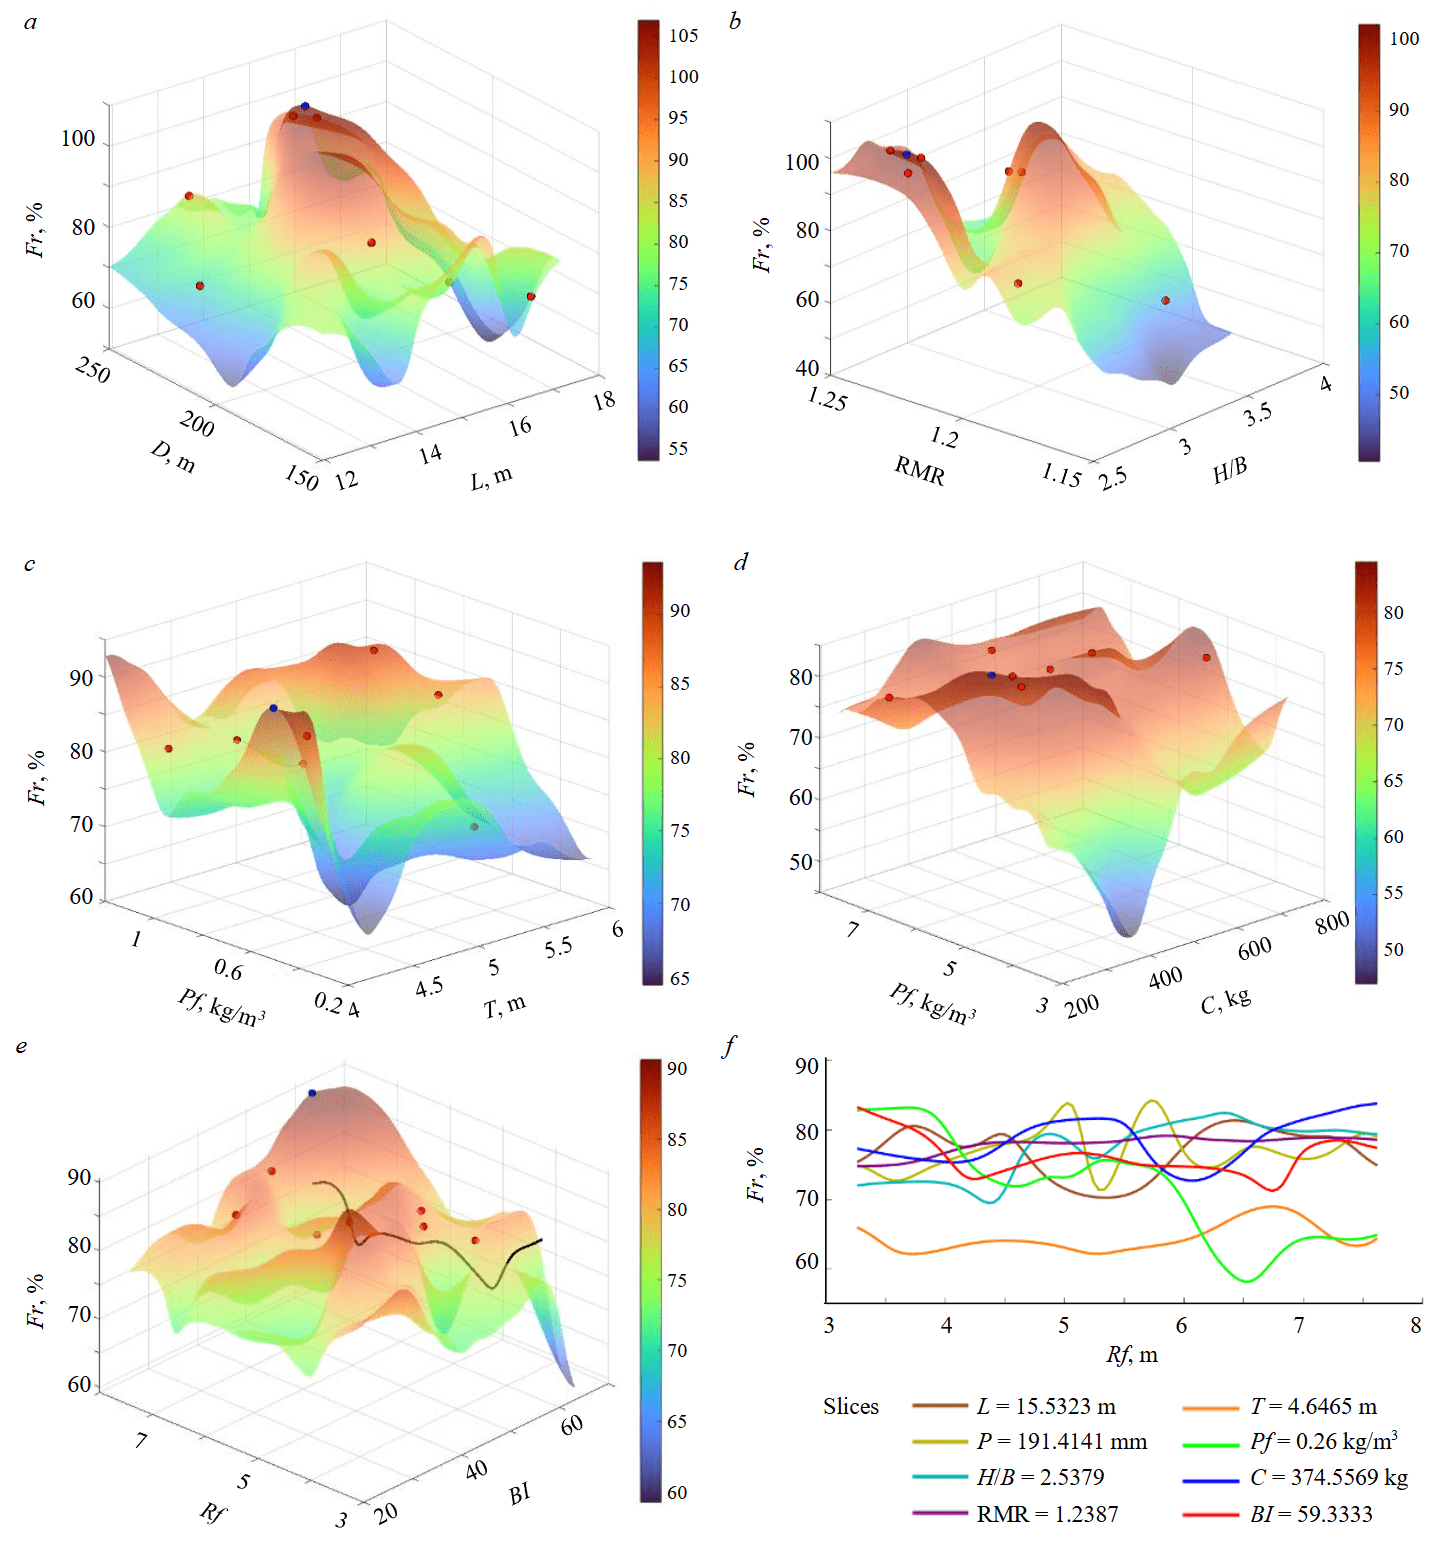
Fig.7. Solution space for rock fragmentation as the output parameter with input parameters, taken two at a time dependencie of hole diameter and hole dept on fragmentation Fr (a); spacing to burden ratio and stiffness ratio on Fr (b); powder factor and stemming on Fr (c); rock factor and charge per delay on Fr (d); rock factor and blastability on Fr (e) and combined plot for the 2-dimensional slices (f)
The highest point on the solution surface corresponds to the maximum value of rock fragmentation predicted by the model (approximately 86 %). Every point in the solution surface has ten components, i.e., nine components of the input parameters plus the output component of rock fragmentation. The solution surface is capable of prediction, optimisation and inverse solution. At the same time, the solution surface affords a visualisation of the interactions of the different parameters with the output.
In Fig.7, e, increasing the rock factor while keeping the blastability index (the blastability index is kept constant in the traced curve that includes the blue dot which is the minimum point) fixed results in fragmentation gradually decreasing and then increasing with fluctuations to an optimal value of fragmentation.
Figure 7, f shows rock fragmentation versus rock factor, the most influential input parameter, presented in a 2D plot. The values of the other nine input parameters at the optimal point are kept constant, while rock factor is plotted in its entire range.
The solution space also confirms the results of the sensitivity analysis. As shown in Fig.7, f, generated by varying the rock factor fixing all the other parameters, and taking a slice through the highest, optimised point in the solution space. Blastability index and spacing to burden ratio are the second most influential input parameters after rock factor and have sharp fluctuations/variations ranging from about. This indicates a high sensitivity, as changes in spacing to burden ratio significantly impact fragmentation. The stiffness ratio is the least influential parameter, this parameter shows gentle fluctuations, also suggesting lower sensitivity.
This optimisation has several practical benefits: it enhances efficiency by reducing the energy and time needed for crushing and grinding, lowers blasting operation costs by using explosives more effectively, improves safety by ensuring stable blasting conditions, reduces environmental impact through lower vibrations, and optimizes resource management by accurately utilizing drilling and blasting resources. These optimized parameters significantly enhance the operational efficiency, safety, and cost-effectiveness of the blasting process.
Conclusions
This study presents a methodology for predicting and optimising the particle size distribution of muck piles resulting from blasting operations at the Orapa Mine in Botswana, managed by Debswana. In this research, various artificial intelligence techniques were employed, including ANN, GA-ANN, ANFIS, and PSO-ANN. These models were trained using data from 120 blasting events. Nine input parameters were selected to predict and optimise fragmentation.
The results indicate that the PSO-ANN model out- performed the others, achieving the highest R2 value of 0.96 and the lowest RMSE and MAE values of 0.17 and 0.30, respectively for the test set. Consequently, the PSO-ANN hybrid model proved to be the most suitable for predicting fragmentation. Optimisation of fragmentation through gradient descent, aided by the Monte Carlo method to find the optimal architecture, enhanced the fragmentation to approximately 86 %. The optimal architecture derived from the Monte Carlo method is 7-65-30-1. The optimal input parameters are: powder factor Pf – 0.56 kg/m3, charge per delay C – 374 kg, spacing to burden ratio RMR – 1.2, stiffness ratio H/B – 2.5, stemming T – 4.6 m, hole depth L – 15.5 m, diameter D – 191 mm, rock factor Rf – 8 and blastability index BI – 65. Sensitivity analysis results reveal that the most influential input parameters on fragmentation are rock factor, blastability index, and spacing-to-burden ratio, with 15.3, 14.7 and 14.7 %, respectively. In contrast, the stiffness ratio 6.3 % has the least influence on fragmentation.
The modelling framework developed in this study is designed to be scalable and adaptable to other mining sites. The results obtained here can serve as a baseline model, which can then be refined by incorporating site‑specific data. Through iterative recalibration and validation, the model’s parameters can be adjusted until prediction errors are minimised, ensuring that the adapted model accurately represents the conditions of the new site.
References
- Hasanipanah M., Amnieh H.B., Arab H., Zamzam M.S. Feasibility of PSO–ANFIS model to estimate rock fragmentation produced by mine blasting. Neural Computing and Applications. 2018. Vol. 30. Iss. 4, p. 1015-1024. DOI: 10.1007/s00521-016-2746-1
- Qiancheng Fang, Hoang Nguyen, Xuan-Nam Bui et al. Modeling of rock fragmentation by firefly optimization algorithm and boosted generalized additive model. Neural Computing and Applications. 2021. Vol. 33. Iss. 8, p. 3503-3519. DOI: 10.1007/s00521-020-05197-8
- Bakhtavar E., Khoshrou H., Badroddin M. Using dimensional-regression analysis to predict the mean particle size of fragmentation by blasting at the Sungun copper mine. Arabian Journal of Geosciences. 2015. Vol. 8. Iss. 4, p. 2111-2120. DOI: 10.1007/s12517-013-1261-2
- Zhi Yu, Xiuzhi Shi, Xianyang Qiu et al. Optimization of postblast ore boundary determination using a novel sine cosine algorithm-based random forest technique and Monte Carlo simulation. Engineering Optimization. 2021. Vol. 53. Iss. 9, p. 1467-1482. DOI: 10.1080/0305215X.2020.1801668
- Esmaeili M., Salimi A., Drebenstedt C. et al. Application of PCA, SVR, and ANFIS for modeling of rock fragmentation. Arabian Journal of Geosciences. 2015. Vol. 8. Iss. 9, p. 6881-6893. DOI: 10.1007/s12517-014-1677-3
- Dumakor-Dupey N.K., Arya S., Jha A. Advances in Blast-Induced Impact Prediction – A Review of Machine Learning Applications. Minerals. 2021. Vol. 11. Iss. 6. N 601. DOI: 10.3390/min11060601
- Jian Zhou, Yulin Zhang, Yingui Qiu. State-of-the-art review of machine learning and optimization algorithms applications in environmental effects of blasting. Artificial Intelligence Review. 2024. Vol. 57. Iss. 1. N 5. DOI: 10.1007/s10462-023-10636-8
- Kaklis K., Saubi O., Jamisola R., Agioutantis Z. Machine Learning Prediction of the Load Evolution in Three-Point Bending Tests of Marble. Mining, Metallurgy & Exploration. 2022. Vol. 39. Iss. 5, p. 2037-2045. DOI: 10.1007/s42461-022-00674-1
- Saadati G., Javankhoshdel S., Javad Mohebbi Najm Abad et al. AI-Powered Geotechnics: Enhancing Rock Mass Classification for Safer Engineering Practices. Rock Mechanics and Rock Engineering. 2024, p. 1-31. DOI: 10.1007/s00603-024-04189-7
- Kaklis K., Saubi O., Jamisola R., Agioutantis Z. A preliminary application of a machine learning model for the prediction of the load variation in three-point bending tests based on acoustic emission signals. Procedia Structural Integrity. 2021. Vol. 33, p. 251-258. DOI: 10.1016/j.prostr.2021.10.031
- Taihua Yang, Tian Wen, Xing Huang et al. Predicting Model of Dual-Mode Shield Tunneling Parameters in Complex Ground Using Recurrent Neural Networks and Multiple Optimization Algorithms. Applied Sciences. 2024. Vol. 14. Iss. 2. N 581. DOI: 10.3390/app14020581
- Zhiheng Ma, Jinguo Wang, Yanrong Zhao et al. Research on Multi-Objective Optimization Model of Foundation Pit Dewatering Based on NSGA-II Algorithm. Applied Sciences. 2023. Vol. 13. Iss. 19. N 10865. DOI: 10.3390/app131910865
- Lawal A.I. A new modification to the Kuz-Ram model using the fragment size predicted by image analysis. International Journal of Rock Mechanics and Mining Sciences. 2021. Vol. 138. N 104595. DOI: 10.1016/j.ijrmms.2020.104595
- Ghaeini N., Mousakhani M., Amnieh H.B., Jafari A. Prediction of blasting-induced fragmentation in Meydook copper mine using empirical, statistical, and mutual information models. Arabian Journal of Geosciences. 2017. Vol. 10. Iss. 18. N 409. DOI: 10.1007/s12517-017-3189-4
- Shams S., Monjezi M., Majd V.J., Armaghani D.J. Application of fuzzy inference system for prediction of rock fragmentation induced by blasting. Arabian Journal of Geosciences. 2015. Vol. 8. Iss. 12, p. 10819-10832. DOI: 10.1007/s12517-015-1952-y
- Asl P.F., Monjezi M., Hamidi J.K., Armaghani D.J. Optimization of flyrock and rock fragmentation in the Tajareh limestone mine using metaheuristics method of firefly algorithm. Engineering with Computers. 2018. Vol. 34, p. 241-251. DOI: 10.1007/s00366-017-0535-9
- Dimitraki L., Christaras B., Marinos V. et al. Predicting the average size of blasted rocks in aggregate quarries using artificial neural networks. Bulletin of Engineering Geology and the Environment. 2019. Vol. 78. Iss. 4, p. 2717-2729. DOI: 10.1007/s10064-018-1270-1
- Ebrahimi E., Monjezi M., Khalesi M.R., Armaghani D.J. Prediction and optimization of back-break and rock fragmentation using an artificial neural network and a bee colony algorithm. Bulletin of Engineering Geology and the Environment. 2016. Vol. 75. Iss. 1, p. 27-36. DOI: 10.1007/s10064-015-0720-2
- Hasanipanah M., Armaghani D.J., Monjezi M., Shams S. Risk assessment and prediction of rock fragmentation produced by blasting operation: a rock engineering system. Environmental Earth Sciences. 2016. Vol. 75. Iss. 9. N 808. DOI: 10.1007/s12665-016-5503-y
- Jian Zhou, Chuanqi Li, Arslan C.A. et al. Performance evaluation of hybrid FFA-ANFIS and GA-ANFIS models to predict particle size distribution of a muck-pile after blasting. Engineering with Computers. 2021. Vol. 37. Iss. 1, p. 265-274. DOI: 10.1007/s00366-019-00822-0
- Wei Gao, Karbasi M., Hasanipanah M. et al. Developing GPR model for forecasting the rock fragmentation in surface mines. Engineering with Computers. 2018. Vol. 34. Iss. 2, p. 339-345. DOI: 10.1007/s00366-017-0544-8
- Amoako R., Jha A., Shuo Zhong. Rock Fragmentation Prediction Using an Artificial Neural Network and Support Vector Regression Hybrid Approach. Mining. 2022. Vol. 2. Iss. 2, p. 233-247. DOI: 10.3390/mining2020013
- Tiile R.N. Artificial neural network approach to predict blast-induced ground vibration, airblast and rock fragmentation: A Thesis Presented to the Faculty of the Graduate School of the Missouri University of Science and Technology in Partial Fulfillment of the Requirements for the Degree Master of Science in Mining Engineering. Missouri, 2016. N 7571, p. 99.
- Yari M., He B., Armaghani D.J. et al. A novel ensemble machine learning model to predict mine blasting–induced rock fragmentation. Bulletin of Engineering Geology and the Environment. 2023. Vol. 82. Iss. 5. N 187. DOI: 10.1007/s10064-023-03138-y
- Koopialipoor M., Armaghani D.J., Haghighi M., Ghaleini E.N. A neuro-genetic predictive model to approximate overbreak induced by drilling and blasting operation in tunnels. Bulletin of Engineering Geology and the Environment. 2019. Vol. 78. Iss. 2, p. 981-990. DOI: 10.1007/s10064-017-1116-2
- Hosseini S., Poormirzaee R., Hajihassani M. An uncertainty hybrid model for risk assessment and prediction of blast-induced rock mass fragmentation. International Journal of Rock Mechanics and Mining Sciences. 2022. Vol. 160. N 105250. DOI: 10.1016/j.ijrmms.2022.105250
- Hosseini S., Mousavi A., Monjezi M., Khandelwal M. Mine-to-crusher policy: Planning of mine blasting patterns for environmentally friendly and optimum fragmentation using Monte Carlo simulation-based multi-objective grey wolf optimization approach. Resources Policy. 2022. Vol. 79. N 103087. DOI: 10.1016/j.resourpol.2022.103087
- Jelušič P., Ivanič A., Lubej S. Prediction of Blast-Induced Ground Vibration Using an Adaptive Network-Based Fuzzy Inference System. Applied Sciences. 2021. Vol. 11. Iss. 1. N 203. DOI: 10.3390/app11010203
- Mohamad E.T., Armaghani D.J., Hasanipanah M. et al. Estimation of air-overpressure produced by blasting operation through a neuro-genetic technique. Environmental Earth Sciences. 2016. Vol. 75. Iss. 2. № 174. DOI: 10.1007/s12665-015-4983-5
- Yilmaz A., Poli R. Successfully and efficiently training deep multi-layer perceptrons with logistic activation function simply requires initializing the weights with an appropriate negative mean. Neural Networks. 2022. Vol. 153, p. 87-103. DOI: 10.1016/j.neunet.2022.05.030
- Chen Z., Zhu L., Lu H. et al. Research on bearing fault diagnosis based on improved genetic algorithm and BP neural network. Scientific Reports. 2024. Vol. 14. N 15527. DOI: 10.1038/s41598-024-66318-0
- Temeng V.A., Ziggah Y.Y., Arthur C.K. A novel artificial intelligent model for predicting air overpressure using brain inspired emotional neural network. International Journal of Mining Science and Technology. 2020. Vol. 30. Iss. 5, p. 683-689. DOI: 10.1016/j.ijmst.2020.05.020
- Pizarroso J., Portela J., Muñoz A. NeuralSens: Sensitivity Analysis of Neural Networks. Journal of Statistical Software. 2022. Vol. 102. Iss. 7, p. 36. DOI: 10.18637/jss.v102.i07
- Armaghani D.J., Hasanipanah M., Mahdiyar A. et al. Airblast prediction through a hybrid genetic algorithm-ANN model. Neural Computing and Applications. 2018. Vol. 29. Iss. 9, p. 619-629. DOI: 10.1007/s00521-016-2598-8
- Hosseini M., Khandelwal M., Lotfi R., Eslahi M. Sensitivity analysis on blast design parameters to improve bench blasting outcomes using the Taguchi method. Geomechanics and Geophysics for Geo-Energy and Geo-Resources. 2023. Vol. 9. Iss. 1. N 9. DOI: 10.1007/s40948-023-00540-4
- Mboyo H.L., Bingjie Huo, Mulenga F. K. et al. Assessing the Impact of Surface Blast Design Parameters on the Performance of a Comminution Circuit Processing a Copper-Bearing Ore. Minerals. 2024. Vol. 14. Iss. 12. N 1226. DOI: 10.3390/min14121226
- Singh P.K., Roy M.P., Paswan R.K. et al. Rock fragmentation control in opencast blasting. Journal of Rock Mechanics and Geotechnical Engineering. 2016. Vol. 8. Iss. 2, p. 225-237. DOI: 10.1016/j.jrmge.2015.10.005
- Lundberg S.M., Su-In Lee. A Unified Approach to Interpreting Model Predictions. 31st Conference on Neural Information Processing Systems (NIPS 2017), Long Beach, CA, USA, December, 2017, p. 10. DOI: 10.48550/arXiv.1705.07874