
Cluster approach for industrial CO2 capture and transport: savings via shared infrastructure
- Ph.D. Associate Professor Empress Catherine ΙΙ Saint Petersburg Mining University ▪ Orcid
Abstract
One promising avenue for reducing CO2 emissions is through the use of carbon capture, utilization, and storage (CCU|S) technologies, which necessitate capital-intensive capture stage implementation. This study proposes implementing a cluster-based approach to its organization, which enables cost reduction through economies of scale achieved by integrating stationary emission sources into a single network with a shared infrastructure. To evaluate the economic effects of this organizational framework, an optimization model was developed utilizing algorithms (SLSQP, Nelder – Mead method, etc.) that account for: spatial distribution of emission sources, emission volumes, CO2 partial pressure in flue gas streams. The model was tested using data from 533 Russian industrial enterprises in the energy, cement, and ferrous metallurgy sectors, with aggregate annual emissions exceeding 0.5 billion tons of CO2. For a preliminary analysis of the spatial and technological data of these enterprises, a methodical approach was developed (based on the DBSCAN algorithm), which made it possible to identify 94 geographical areas of their increased concentration. Information about industrial enterprises forming six largest regions was utilized for modeling 90 configurations of carbon capture and transportation projects with shared infrastructure. The results demonstrated that the cluster-based approach reduced the cost of capture in the considered examples by 6.44-13.51 %, depending on the maximum radius of a cluster. An additional reduction in transportation costs due to the use of joint gas pipelines averaged 37.26 and 57.01 % for a 200 and 500 km distances, respectively. Under the same distances and with a maximum cluster radius of no less than 20 km, the average reduction in aggregate costs across the evaluated configurations amounted to 17.81 %. The results obtained confirm the importance of organizational solutions for scaling up CCU|S projects and establishing novel cross-sectoral technological chains. The proposed methodologies can be effectively employed to identify promising areas for the implementation of CCU|S pilot projects and to design highly efficient local networks for CO2 capture and transportation with shared infrastructure.
None
Introduction
Climate change is a global challenge, the need to combat it, both in terms of reducing man-made greenhouse gas emissions and in terms of adapting to its negative consequences, has been noted in a number of international agreements [1] and recognized by the International Court of Justice1. To achieve these objectives, climate policy is being formulated at both governmental and international levels. The cornerstone of modern climate policy (with regard to emissions mitigation), driven by both objective and subjective factors [2], are renewable energy sources (RES). While RES undoubtedly hold significant long-term potential [3], they have proven insufficient in the recent past to reverse the upward trajectory of global greenhouse gas emissions (Fig.1)2. At the same time, the volume of climate investments is also growing rapidly, a significant part of which is unbalanced [4].
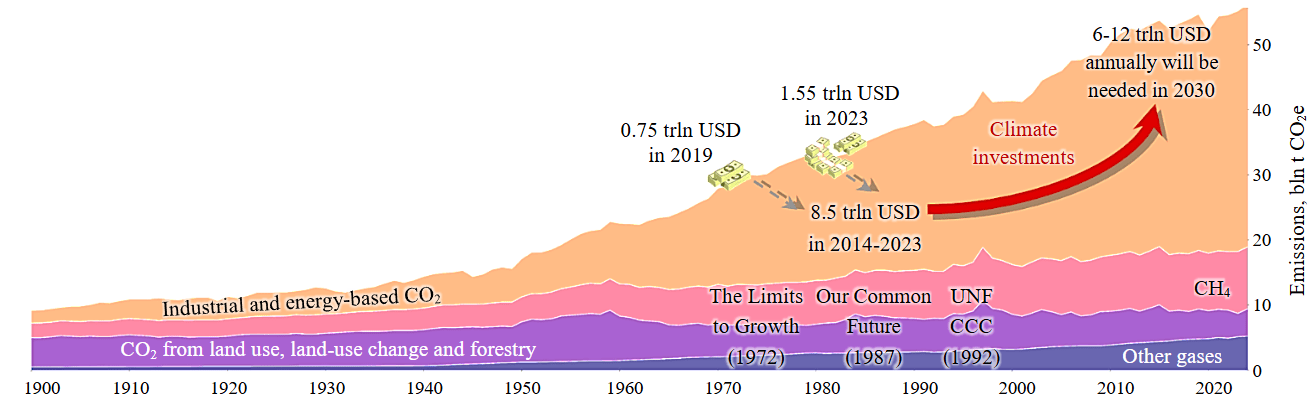
Fig.1. GHG emissions trend and climate investment data
A possible solution to the problem of increasing the effectiveness of current climate policy is to diversify it by rethinking and re-evaluating alternative emission reduction processes [5, 6], which, in general, is already beginning to happen today. An example of this is the softening of the rhetoric of the European Union in 2024/25. Russia’s position on this issue boils down to:
- Focusing on individual examples of energy efficiency improvement. With regard to such measures, it should be noted that attention should be paid to the energy efficiency of buildings [7] and housing and utilities infrastructure (including fostering a culture of rational consumption), rather than focusing exclusively on the industrial sector. While the industrial domain undoubtedly requires innovative solutions [8], it generally possesses significantly greater self-sufficiency in initiating processes to address specific energy intensity reduction challenges [9]. At the same time, even in the case of a real increase in energy efficiency, it should be taken into account that the results at a macrolevel are likely to be lower than expected due to the rebound effects [10] (e.g. the Jevons effect).
- Overreliance on forest-climatic projects as the main tool for reducing (offsetting) emissions, including through a reassessment of the entire emission inventory [11]. This area certainly has strengths and should be defended as an important part of the national decarbonization strategy; however, there are risks that require close attention:
- as temperatures continue to rise, the frequency of forest fires, which have become a seasonal but regular occurrence in recent decades, will increase;
- deforestation and export of forests are actively carried out;
- ignoring technological directions for reducing emissions is fraught with the loss of important competencies necessary for the development and commercialization of low-carbon technologies;
- focusing solely on non-technological compensation of emissions risks not receiving the sup-port of partner countries, with which the formation of an international carbon trading systems is being discussed.
The objective strength of forest-climate projects is that they are not limited to the energy sector. Considering the structure of stationary CO2 emissions in Russia3, most of which, although related to energy generation [12], are still characterized by a significant proportion of other sources, it seems logical to overestimate the potential of equally flexible technologies applicable in a wide range of industries, namely CO2 sequestration (CCU|S). There are certainly many problematic issues regarding these groups of technologies, starting with the lack of sufficient real industrial data [13] applicable to Russian conditions, and ending with an almost complete lack of knowledge about the potential for CO2 utilization and conversion into various types of products as a single focus, rather than individual projects. And it is precisely this lack of information about their effectiveness, as well as the lack of scientific research in this area, that is a barrier to Russia’s development of a “balanced, economically sound and non-proactive” state climate policy [14], which includes CCU|S.
It is important that the starting point of all such projects is the stage of CO2 capture, which has been gaining global interest in recent years. It is noteworthy that in 2008-2013, Russia was one of the world leaders in the number of patents in this field [15]. Thus, the scientific problem highlighted in this paper is that the current pace of development of CO2 capture technologies required for all CCU|S projects does not give reasonable optimism about the imminent achievement of breakthrough results that can seriously reduce unit costs. With this in mind, it seems logical to develop not only technological, but also organizational approaches that can help improve this scientific and industry direction. Thus, the purpose of this study is to explore the possibility of using a cluster approach to the organization of a CO2 capture project from stationary industrial sources. The goal defined the following research objectives:
- analysis of CO2 capture methods and technologies, as well as various configurations of business models used in the implementation of CCU|S projects;
- development of a cluster approach to the implementation of a CO2 capture project and a model for assessing its effects;
- testing of the proposed approach based on data from industrial sources of CO2 emissions in the Russian Federation.
Problem statement
Carbon dioxide capture as a stage of CO2 sequestration technologies
CCU|S is a group of technologies that, instead of preventing CO2 emissions, involve it in various technological chains (Fig.2), which can be divided into three groups:
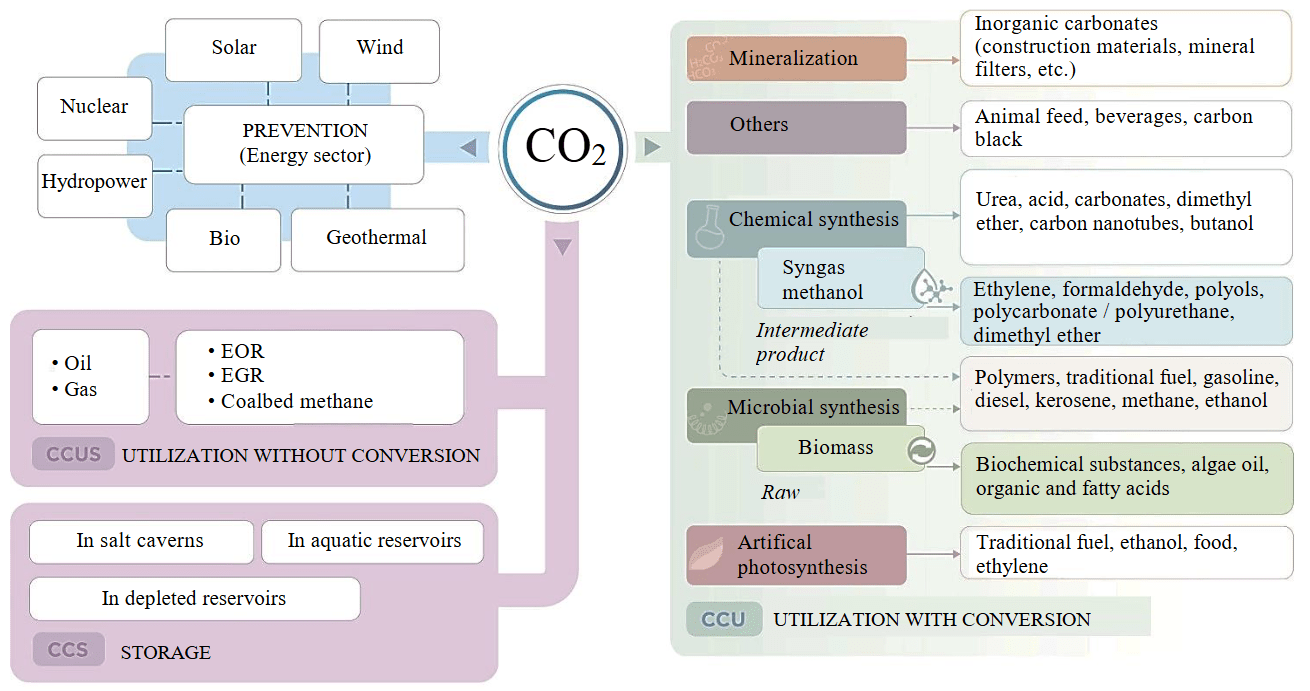
Fig.2. The diversity of CCU|S technologies
- Carbon capture and storage (CCS), which involves the capture and disposal of CO2 in any geological formation, or by marine storage, without any application options with positive current cash flows.
- Carbon capture, Utilization and Storage (CCUS) includes projects that use CO2 to improve the efficiency of natural resource extraction processes (oil, natural gas, groundwater, geothermal energy, etc.) [16]. After the extraction stage, CO2 is stored underground. Technologies for working with technogenic resources can also be attributed to this group. For example, relatively recently scientists at St. Petersburg Mining University have proven the technological possibility of obtaining scandium concentrate from alumina production waste by carbonizing it with exhaust gases [17].
- Carbon capture and recycling (CCU) projects involve the capture and use of CO2 in the production process as a raw material or chemical agent (i.e. these projects involve the “storage” of CO2 in various commodities). The list of CO2 disposal options shown in the Fig.2 is not exhaustive [18].
Despite their conceptual proximity, these technological chains have different goals, principles of implementation, effects, risks and prospects. In addition, the transition from one option to another leads to a change in the role of CO2: it becomes not just a waste, but a resource that can be useful in industries, which is a clear example of the transition from a linear economy to a circular economy. Nevertheless, their common initial stage, which in fact opens up the fundamental possibility of implementing such technological schemes, is capture, to which this study is devoted.
First of all, it is important that the total amount of CO2 emissions can be divided into:
- Not amenable to capture emissions. The sources of such emissions are some household processes, processes in natural ecosystems and agriculture. It can also include emissions from non-stationary sources (e.g. transport). At the current stage of development, the fight against such emissions from most sources can only be carried out by completely replacing technology (for example, switching to electric vehicles). In other cases, the measures are more promising and include removing CO2 from ecosystems, adjusting the culture of resource consumption, developing geoengineering technologies, etc. Taking this into account, today there is a growing attention to compensation (offsetting) mechanisms, for example, implemented through forest-climatic projects [19].
- Capturable emissionsoccurring within several controllable natural and technological processes, e.g. industrial emissions. The methods of combating them are renewable energy technologies, energy efficiency improvement, etc. In the case of CCU|S projects, capture is carried out from stationary sources, the main of which include energy generation facilities (13.3 billion t of CO2e per year), metallurgical (4.1 billion t of CO2e per year), cement (3.7 billion t of CO2e per year), chemical plants and oil refineries (1.1 billion t CO2e per year), as well as hydrogen production (25 million t of CO2e per year)4. There are already examples of successful implementation of industrial-scale technologies in almost all of these industries.
The costs and efficiency of the capture process at production facilities depend on many factors, however, one of the main ones is the partial pressure of CO2 (in proportion to its percentage in the mixture) (Table 1). Some sources note [20] that the content of SOx, NOx, and some other impurities can also affect the qualitative and quantitative characteristics of the capture process.
The “target” efficiency of the process is also important (the proportion of CO2 in the gas stream that can be captured), especially if we are talking about a difference of tens of percent, which can increase costs several times [21]. However, today, as a rule, it is customary to talk about high rates, i.e. 94±5 % of the efficiency of capture from the stream (Table 2), which somewhat reduces the spread of dependent values.
Table 1
Characteristics of some emission sources [22, 23]
|
Industry |
Source |
Partial pressure, kPa1 |
Price range, USD/t |
|
Cement |
Flue gases from the furnace |
18 |
37-118 |
|
Pre-firing device |
20-30 |
||
|
Ferrous metallurgy |
Lime firing |
7.1-8.1 |
55-120 |
|
Sintering plant |
3.7-4.2 |
||
|
Oil refining |
Liquid catalytic cracking |
10.1-14.2 |
45-120 |
|
The heater |
8.1-10.1 |
||
|
Steam cracking for ethylene production |
7.1-12.2 |
||
|
Steam reforming of methane to produce hydrogen |
300-4802 |
15-60 |
|
|
Production of ethylene oxide |
Over 92 |
5-35 |
|
|
Gas processing |
Gas processing plant |
Up to 50003 |
5-35 |
|
Pulp and paper industry |
Lime kiln |
16 |
30-45 |
|
Energy industry |
Coal-fired power plant |
12.2-14.2 |
43-80 |
|
Gas-fired power plant |
3.8-4.6 |
59-107 |
|
|
Aluminum smelting |
Aluminum plant |
0.8-1.1 |
180-300 |
|
Fertilizer production |
Coal gasification |
750-25004 |
5-40 |
|
Synthesis gas from natural gas |
300-12005 |
Notes:1 – at standard atmospheric pressure (101.3 kPa), unless otherwise stated; 2 – 2-3 MPa; 3 – 0.9-8.2 MPa and above; 4 – 3-6 MPa; 5 – 2-3 MPa.
Table 2
Comparison of CO2 capture technologies [24, 25]
|
CO2 capture technology |
Efficiency, % |
Energy consumption, GJ/t |
Cost of CO2 capture, USD/t CO2 |
Characteristics |
|
Industrial gas separation |
90 |
5.00 |
34.80-60.90 |
These technologies are common in the oil and gas and chemical industries, however, they require adaptation to the specifics of a particular gas component composition and are characterized by high energy consumption |
|
Post-combustion |
90 |
4.14 |
46-74 |
Technologies are suitable for upgrading existing industrial facilities, but require significant capital and operating costs |
|
Pre-combustion |
90 |
3.35 |
34-63 |
Highly efficient technology used in oil refining and hydrogen production processes. Application is not possible everywhere and requires a major reorganization of the production line |
|
Oxy-fuel combustion |
>90 |
4.05 |
52 |
The technology allows to obtain flue gases with a concentration of СО2 up to 90 %, which simplifies subsequent capture. The technology is promising for cement and meta-llurgical plants, however, it requires expensive oxygen production equipment and a complete reconstruction of the production line. So far, there are only pilot projects |
|
Chemical looping |
96-99 |
0.95 |
<59.20 |
An innovative technology in the early stages of development, with good energy efficiency indicators, but, so far, characterized by rapid wear of carrier materials |
|
Direct air capture |
85-93 |
5.25 |
140-1000 |
In theory, this is a carbon-negative technology, but only if the problem with energy supply is solved. The same problem now leads to the uncompetitiveness of such solutions in terms of price |
The difference between technologies may be aggravated by the specifics of the detection facility (Table 3). For example, if we talk about the cement industry, the difference in wet (5-7 GJ/ t of clinker) and dry (3-4 GJ/t of clinker) production methods can create a two-fold difference in energy consumption per unit of production5.
Table 3
The average cost of CO2 capture in various technological processes of the cement and metallurgical industries, without taking into account the specifics of the region6, 7, 8
|
Industry |
CO2 capture technology |
Cost of CO2 capture, USD/t CO2 |
Increased production costs, USD/t of cement or steel* |
|
Cement |
Traditional chemical absorption |
34-79 |
46-116 |
|
Advanced absorption technologies |
45 |
20 |
|
|
Membranes |
51-57 |
39 |
|
|
Oxy-fuel |
39-57 |
38-39 |
|
|
Solid sorbents |
40-74 |
40-74 |
|
|
Metallurgy |
Traditional chemical absorption |
7-23 |
31-110 |
|
Advanced absorption technologies |
7-13 |
36-37 |
|
|
Vacuum pressure swing adsorption |
11-15 |
40-45 |
* The estimated cost increase for cement is ~20-60 %, for steel – 5-25 %.
A general description of the capture technologies has been given more than once, both in Russian and in English-language literature. A fairly detailed and exhaustive scheme of the processes is available, for example, in the study [24].
It is also important to clarify the technologies for direct CO2 capture from the air (DAC) as part of the review. The most efficient laboratory processes of this kind require electrical energy costs of the order of 1-2 GJ/t CO2. In real operating conditions, this indicator can rise to 5 GJ/t CO2 (taking into account the increase in electrical energy consumed), which is due to both natural factors and the need to process huge volumes of air [26]. At the same time, electricity costs are only about 10-20 % of the total energy costs. Other thermal energy is needed, for example, for the regeneration of sorption material. As a result, the energy needed for the DAC can be used more efficiently, for example, reducing direct emissions. There is no alternative to the situation when the already emitted CO2 must be removed from the atmosphere.
The situation is much better with a multiple increase in the concentration of CO2 in the treated gas. In most cases this value ranges from 4 to 30 %. At these levels, the total energy consumption for capture spans 1 to 5 GJ/t CO2 [27], which, as a result, affects the cost of the process, in addition to the difference in the technologies themselves.
Another cost growth factor is evident when the transition from “catch-from-flow” planning to “catch-from-facility” is underway. The difference is that there may be several streams of CO2-containing gas at a single facility from different processes with different component compositions. In such cases, it is possible either to combine gas flows, or to use several separate trapping plants (metallurgical plants, hydrogen production, etc.), and then the cost increase may be a multiple of the increase in the number of plants.
For example, steam methane reforming plants capture CO2 only in concentrated synthesis gas, which is why the capture efficiency of the entire plant is 50-80 %9. Taking into account less concentrated sources could lead to an increase in this value to 65-90 %, but the cost would also increase by 15-20 % (from about 40 to more than 50 USD/t). A similar situation is typical for the production of biodiesel (an increase from 78 to 96 % corresponds to an approximate increase in costs from 12 to 26 USD/t) and for the production of bioethanol (an increase from 12 to 91 % corresponds to an approximate increase in costs from 15 to 48 USD/t).
Given this, it is logical to assume that industries where such an approach is possible will form strategies for the transition to carbon-free production based on the gradual introduction of CO2-reduced streams into the process, consistent with an increase in the carbon tax and/or strengthening other mechanisms to support such projects10.
Development of business models of CCU|S technological chains
In addition to improving technological processes, CCU|S is also undergoing changes in organizational methods, models, and approaches. This is usually associated with the improvement of business models of projects, which are also a tool for developing and implementing corporate strategies. There are many approaches to creating a business-models (BM), each of which has its own unique features in terms of processes, elements, implementation mechanisms or organizational structure [28], however, the key elements of a successful BM are usually standard [29]. BM, as well as methods for their construction/validation, should strive for structural integrity, complexity, validity and feasibility [30]. If, with this in mind, it is possible to formulate a value proposition, analyze at least part of the cash flows and identify target market segments, then such a BM can be considered successful. As for CCU|S BM, they can be divided into two large groups9.
BM projects of the complete technological chain. In many modern CCU|S projects, it is the full chain BM that is used, in which a single organization assumes responsibility for all stages of the project. In Fig.3 (extended and adapted version of schemes from11)it is shown in a green zone. These BM correspond to the specifics of “first-of-its-kind” (FOAK) innovative projects, which often require serious resource support from the state or other structures. The main advantages of this strategy are risk reduction and improved coordination through centralized management. However, this also implies that the operator is fully responsible and must have experience in all aspects of the process, which is rare.
In addition, such a BM has several significant disadvantages11. Firstly, it is almost impossible to scale (in terms of the rapid growth in the number of projects). The implementation of a complete chain requires significant investments in infrastructure, which makes it financially feasible only for large-scale industrial enterprises. This limits the possibilities of implementing CCU|S in small and medium-sized enterprises, preventing the introduction of technology in regions with less developed infrastructure and preventing companies from many sectors of the economy from fully participating in such projects.
Secondly, access to the project for external participants, such as independent technology providers or specialized service companies, is often limited. This hinders the formation of partnerships, which, in its turn, hinders the promotion of innovative technologies and CO2 sequestration as an independent scientific and industrial area.
Thirdly, such a BM does not imply competition. As a result, there are no incentives to develop innovations, and the cost reduction process becomes more complicated. An alternative solution is to divide the CCU|S value chain between different participants, as suggested by the second group of BM.
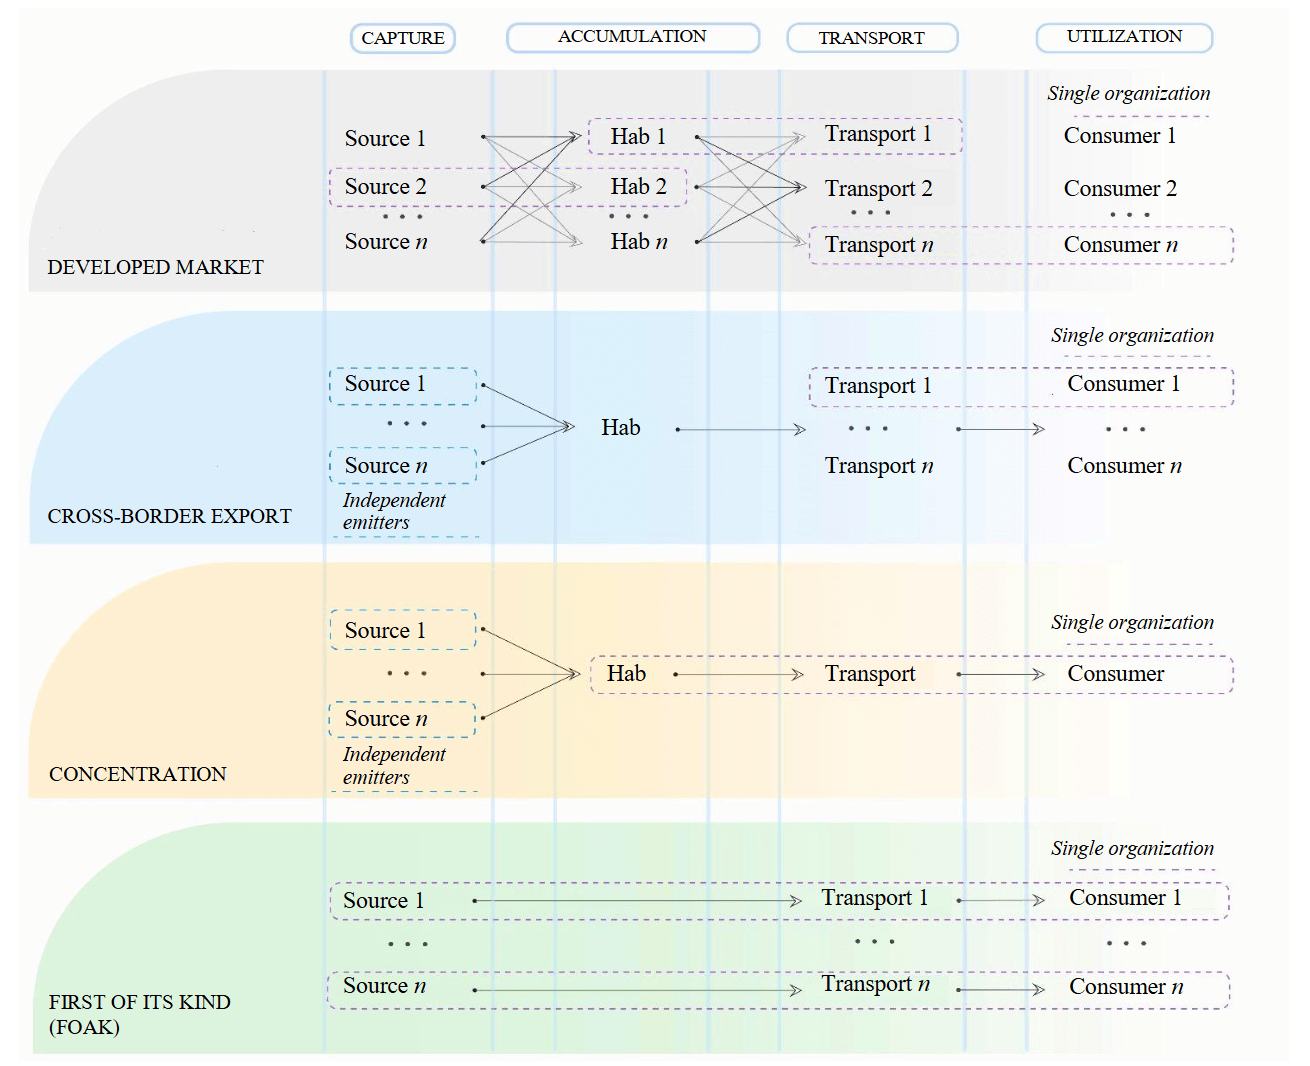
Fig.3. Various configurations of BM CCU|S. Green is the BM of the complete technological chain,other colors are the BM of partial technological chains
BM of partial chain projects – more flexible and more suitable for low-tonnage projects, such as CCU12. They allow businesses to delegate responsibilities for CO2 capture, transportation, and storage to specialized firms. This is especially important when CO2 capture is not included in the initial design of the technological process and requires a significant amount of additional equipment and new organizational solutions, unlike, for example, natural gas processing. As a result, new players may enter the CCU|S market, including companies from the metallurgical and machine-building sectors (equipment manufacturers), the chemical industry (as emitters or technology developers), as well as suppliers of infrastructure and engineering services. Despite the fact that CCU|S partial chain models are relatively new, high barriers to entry due to capital requirements and experience in the process have allowed some companies to take a leading position in the Capture as a service sector, for example: Aker Carbon Capture, Carbon Clean, Air Liquide, Svante, Entropy, Linde, etc.
It is also possible to implement the “Transportation as a service” or “Storage as a service” models. In the first case, the supplier may offer services for moving the captured CO2 from emission sources to storage or disposal sites using various technological means. In the second case, only CO2 storage services are provided13. An example of a combination of these schemes is the Alberta Carbon project (Canada)14, in which Wolf Carbon Solutions is a transportation service provider and Enhance Energy is responsible for storage. The Emirates Steel CCS (United Arab Emirates) project15 is organized in a similar way, where CO2 emissions are collected at the Emirates Steel Industries complex, and ADNOC reported their plans to carry out transportation and storage in the Rumaith and Bab oil fields.
Overall, separation of the chain increases flexibility, which accelerates the integration of new projects into CO2 sequestration systems. In addition, the presence of competition helps to reduce and distribute costs due to the creation of shared infrastructure. At the same time, small and geographically distributed stationary sources of emissions can be easily integrated into these systems by creating nodes that combine the resources and expertise of various participants in the technological chain.
However, these BM are not without drawbacks. They are largely related to the need to coordinate the multitude of project participants, as each requires guarantees of demand for the products/ services they create. The solution to this problem is the active position of the state in terms of creating the necessary conditions. For example, providing financial support and reducing the risks of participating in a project is possible through a public-private partnership mechanism. An example of this approach is the activities of the Danish company Nordsofonden, which has a stake in many CO2 storage projects16. Or the Porthos project (Netherlands, Port of Rotterdam), which has extensive support from both the national government and the European Union.
Partial chain BM also require strict antitrust regulation, since one company can have a significant impact on weaker players in an as-yet-unformed market. For example, the Stella Maris CCS project (Norway) uses a shared floating infrastructure for collecting, transporting and storing CO2 in the North Sea. The planned capacity of the project is up to 10 million t of CO2 per year, which is a significant amount, given the current level of technology development.
If the market can be considered formed, i.e. there are many independent companies with mature technologies (n-th of a kind, NOAK) operating in it, then government participation in it is minimized. As a rule, monitoring of legislative measures is necessary, but there is no need for substantial financial support for FOAK projects, which is urgently needed at the current stage due to their high cost, primarily due to the capture stage.
It can be concluded that the development of BM CCU|S leads, on the one hand, to the splitting of a single value chain, but, on the other hand, to the concentration of production activity in hubs (clusters). This corresponds to the general trend towards the decentralization of some industrial systems, which is being actively discussed, for example, in relation to distributed energy. It is important that the goal of this trend should not be the creation of separately located enterprises/production facilities, but the creation of many highly efficient local area networks, which, as technology develops, can be combined with higher-level networks [31].
Despite the growing interest in the CO2 sequestration sector, many problems of further development of CCU|S projects are still far from being solved. In particular, this article focuses on the gaps in scientific knowledge related to the stage of CO2 capture. As it was shown, the development of BM CCU|S proceeds towards the formation of cluster organizational structures; however, in the scientific literature, as a rule, we are talking about clusters of storage and/or transportation. The creation of capture clusters has practically not been studied, although this may allow the use of organizational cost reduction mechanisms at this stage.
Methods
An approach to assessing the effects of organizing CO2 capture clusters
The cost of capture from stationary industrial sources depends on the two key characteristics of the CO2-containing stream mentioned earlier: CO2 partial pressure and potential CO2 capture capacity. Considering this, the following principles are proposed as the basis for combining emission sources into clusters with shared infrastructure (Fig.4, а):
- Increasing the capacity of the CO2-containing gas flow, both at the facility and in the cluster as a whole. Clockwise movement from the upper-right graph. The transition from the upper-right graph to the cluster level (all other graphs) can be intuitively perceived as an association of many identical enterprises of the corresponding color, i.e. having the same capacity and partial pressure of CO2 in the gas stream.
- Increase in the average partial pressure of CO2 in the stream due to a combination of highly and weakly concentrated sources. Counterclockwise movement from the upper-right graph.
Based on these principles, as well as the information provided in the literature review, an analysis of the effect of economies of scale on capture costs for coal-fired power plants in the range of installed capacity from 100 MW to 1.5 GW was performed (Fig.4, b), as new economic strategies have been developed in recent years based on the likely growth of coal generation [32]. For each option considered, the reported costs of CO2 capture were calculated based on modeling in the Integrated Environment Control Model software17.
In addition, based on approximate GCCSI data [22] a generalized dependence of changes in the cost of capture on the partial pressure of CO2 in the gas stream was constructed (Fig.4, c), as well as the dependence of pipeline transportation costs on the volume of gas. The presented approach allows to draw a number of conclusions that are significant from the point of view of the development of cluster organization schemes in the implementation of CO2 capture projects with shared infrastructure:
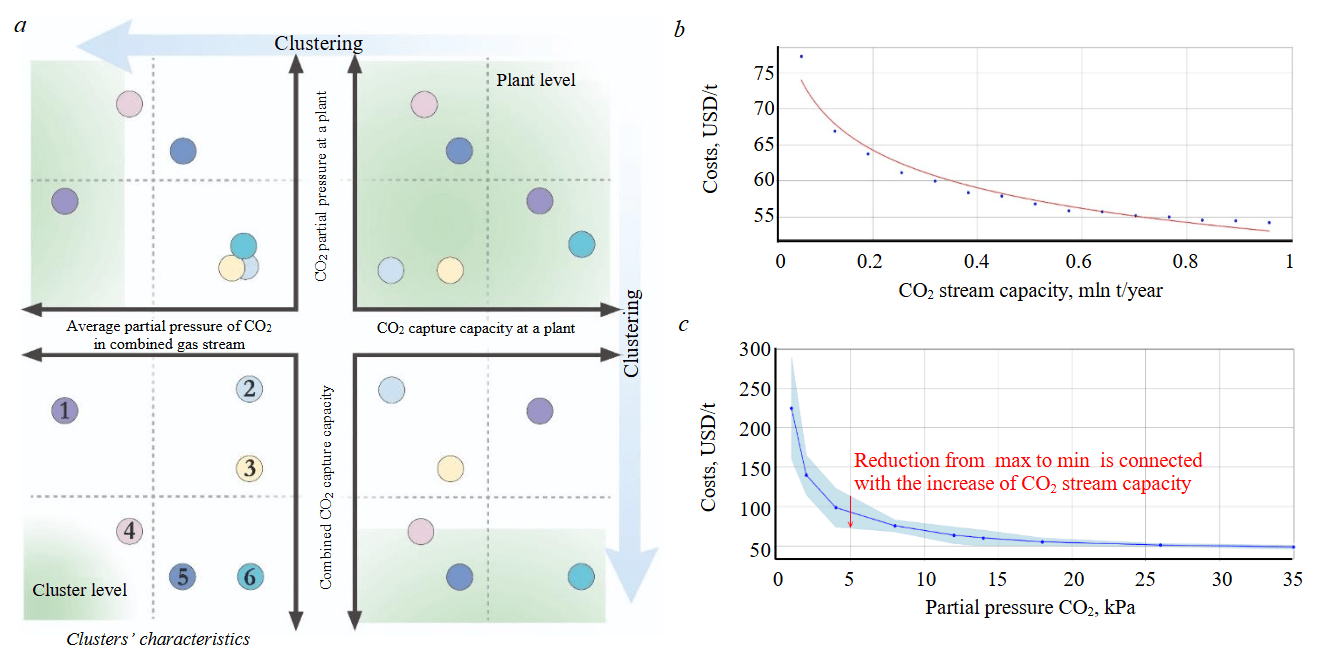
Fig.4. Principles of formation of capture clusters (а), estimation of the dependence of the cost of CO2 capture in coal-fired power plants on partial pressure (b) and volume of emissions (c)
1 – the capacity shortage; 2, 3 – the shortage of capacity and partial pressure CO2; 4 – promising cluster; 5, 6 – the shortage of partial pressure CO2
- the effect of scale on the cost of capture is most significantly manifested with small amounts of emissions from emitting facilities;
- the effect of increasing partial pressure on the cost of capture is also more noticeable when combining small emitters;
- the combined effect of these two factors forms a wide range of unit costs for CO2 capture, the maximum values of which can be many times higher than the minimum, which is consistent with similar estimates in international analytical reports [33].
To test the described approach, a model for the formation of CO2 capture clusters and a software for working with it in the Python environment were developed [34]. It allows to find the optimal location of the hubs (shared CO2 capture plant), where industrial gas flows are concentrated, obtained through onshore gas pipelines from other nearby enterprises. Centralized CO2 capture can be carried out both at a stand-alone facility and, for example, at a large emitter in the geographical area under consideration, which can reduce costs, but requires greater trust from other network participants. To do this, such projects may require the participation of the state as a guarantor of the reliability of the project. Such examples are widely adopted in some industries [35].
The developed model evaluates the effect of using the described cluster approach, taking into account the above-mentioned characteristics of the emitting enterprises; the distance to the storage of CO2; the cost of capture; transportation costs; the possibility of combining pipelines of several clusters. In this case, a storage facility is understood to mean either a production facility where CO2 will be disposed of, or an underground reservoir in which it will be disposed of.
The location of the objects under consideration is either initially set in the Cartesian coordinate system (a unit segment is 1 km), or indicated using geographical coordinates. In the second case, the coordinates are converted to a Cartesian system using a local approximation, where 1° latitude corresponds to 111 km, and 1° longitude was calculated as 111 cos(φ) km, where φ is the average latitude of the region under study. This method provides acceptable accuracy for territories with linear dimensions up to 100 km. The location of the storage facility was set in five variants: in the “center of mass” (centroid) of all emitters (weighted average coordinates, taking into account emissions), as well as 50, 100, 200, and 500 km away from the center.
This model is based on an algorithm that includes three optimization tasks:
- Minimizing the overall system costs (Greedy Algorithm). This task is to choose a cluster configuration that maximizes overall system savings by prioritizing the formation of hubs around the largest sources of emissions, without taking into account how this choice may affect future opportunities for the formation of new clusters.
- Optimization of the hub location to minimize the total cluster costs (Sequential Least Squares Programming, SLSQP). While the “Greedy Algorithm” solves the combinatorial problem of which sources to group and which groups should be designated as clusters, SLSQP solves the problem of exactly where to place each hub, taking into account a fixed group of sources and minimizing the total cost of capture and transportation.
- Minimizing the total transportation costs of clusters (their estimation model is based on data from19, the cost growth coefficient for crude gas is assumed 1.1) by searching for the optimal pipeline connection point (the Nelder – Meadmethod). This method uses as a basis the construction of a simplex, i.e. a geometric shape (a triangle in two-dimensional space). Constructed with the coordinates of the vertices of the simplex at the points of initial approximation, the algorithm searches for the optimal position by iteratively replacing the worst vertex. The algorithm searches for a point that minimizes the sum of transportation costs from all hubs to the merge point plus the cost of transporting the combined flow from the merge point to the storage. Simultaneously, at this stage, a determination is made regarding the potential integration of non-clustered emitters into the shared pipeline infrastructure.
The developed model can be described in such a way that it calculates costs in two configurations: the costs of decentralized capture and transportation; the costs of shared capture in clusters, taking into account the possibility of creating shared pipelines. Thus, having information about the mechanisms for reducing costs by creating clusters, the model allows optimizing the total costs of the system through the implementation of a series of iterative procedures (Fig.5) for each of the considered configurations (90 in total). Within this study, a configuration is formally defined as the combined dataset comprising: facility-level parameters for all enterprises within a specified geographic area; maximum cluster radius as the spatial boundary criterion; geological storage site coordinates.
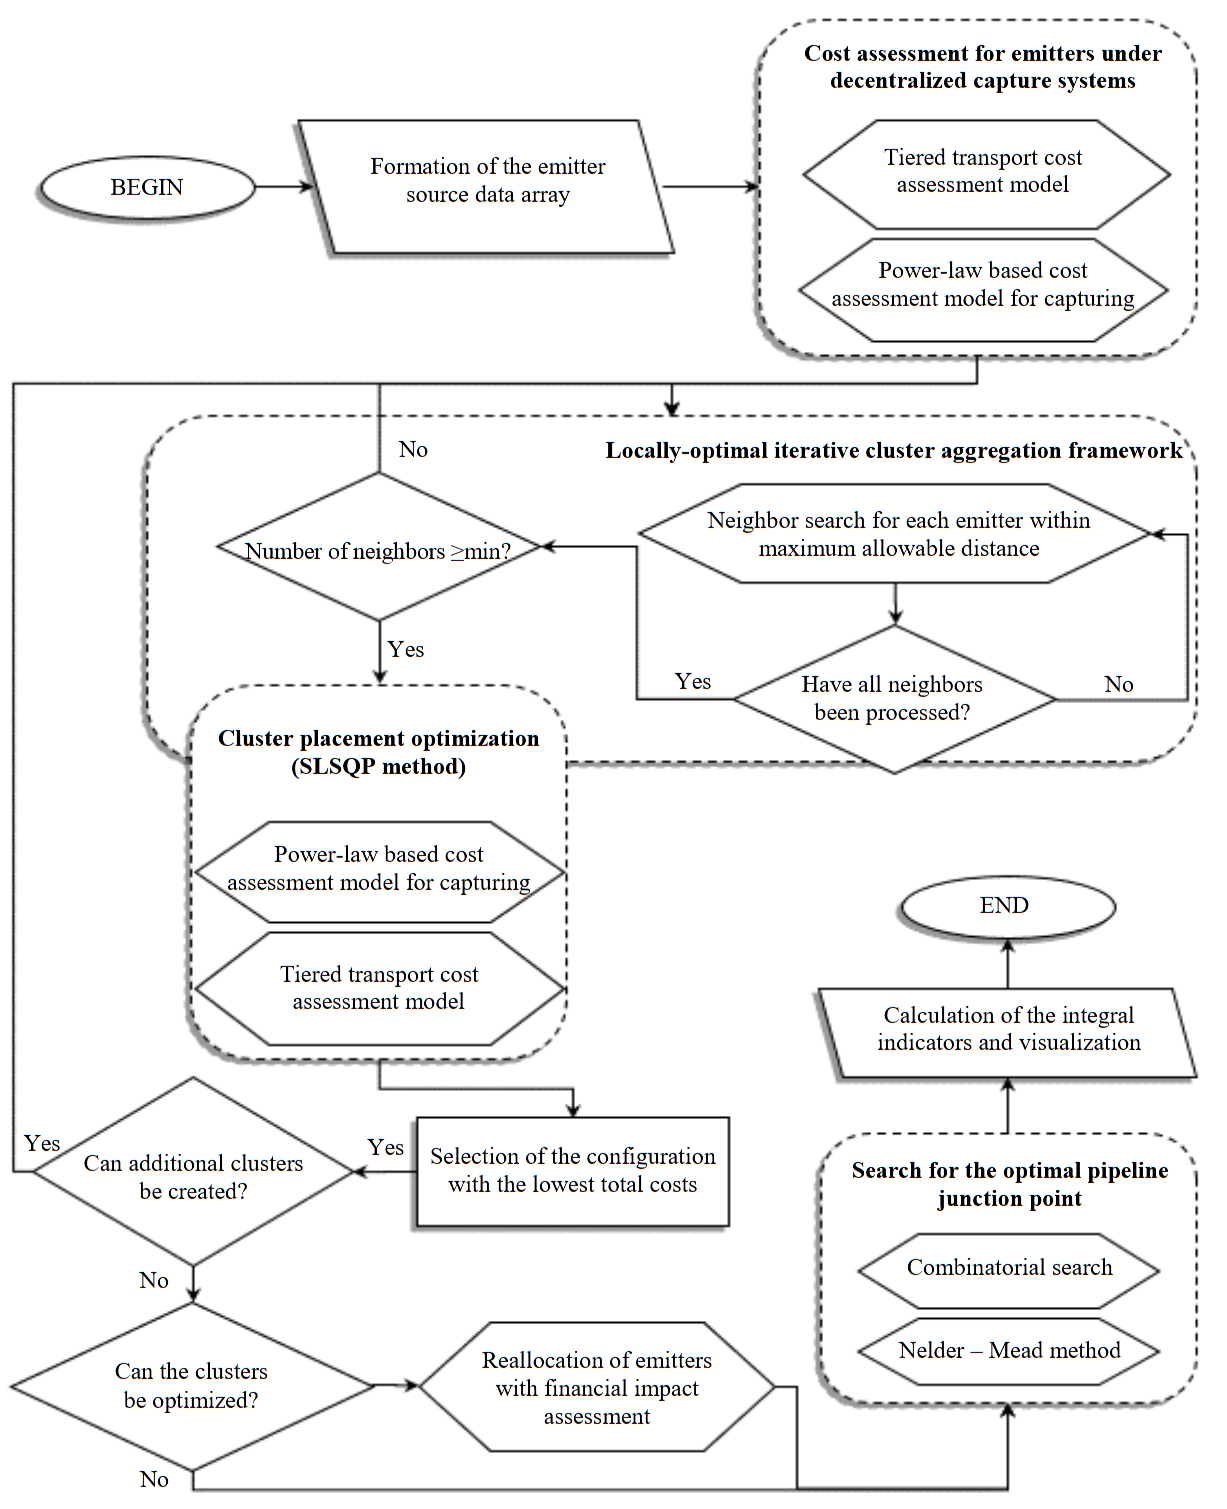
Fig.5. Algorithm of the model for searching the optimal cluster configuration
A model for preprocessing spatial data on industrial sources of CO2 emissions
Approach to assessing the effects of organizing CO2 capture clusters allows to evaluate the effects for a certain number of objects with specific geographical coordinates. It is applicable in a limited number of emitters, as well as a well-defined geographical area. Nevertheless, if we are talking about the scale of a country like Russia, which has an area of more than 17 million km2, and the number of large industrial facilities is estimated at many hundreds, then performing all the necessary assessment procedures becomes an excessively resource-intensive task. In this regard, it is advisable to develop a mechanism for preprocessing spatial data. The purpose of such a mechanism is to search for geographical areas characterized by clusters of industrial facilities with high levels of CO2 emissions. Such territories, for example, could be used to implement CCU|S pilot projects (similar to the Sakhalin experiment, but more localized) through the use of their cluster potential.
To search for such areas in Russia, information was collected on the technical and economic characteristics of 533 enterprises in the cement [36], energy19 [37] and metallurgical (ferrous) [38] industries with annual emissions of 28.1, 382.2 and 125.9 million t of CO2, respectively.
It is proposed to identify promising territories based on the developed model [39], the core of which is the density algorithm of spatial clustering with the presence of noise (DBSCAN).
Main steps of the model for analyzing spatial data on industrial CO2 emission sources and identifying geographic areas of their concentration:
- collection and systematization of spatial and techno-economic data, calculation of the distance matrix;
- determination of cluster formation parameters (minimum number of neighbors (n), allowable radius);
- identification of core points (at least n neighbors), border points near them, and remaining points;
- recursive procedure for cluster formation;
- visualization of the map and calculation of integral parameters for each cluster.
The general principle of operation of this algorithm is to iteratively “bypass” all points to divide them into “cores” (the number of neighbors is greater than or equal to the minimum), “neighbors” and “noise” (i.e., not falling into the cluster unless a core point appears in the vicinity). The following parameters were used as assumptions: the maximum distance between enterprises in a cluster is 50 km; the minimum number of enterprises in a cluster is 2; the minimum amount of cluster emissions is 500 thousand t of CO2 per year.
The convenience of the proposed approach using DBSCAN, as applied to solving the problem, lies in the fact that:
it does not require you to set the number of clusters in advance;
clusters can be of any shape;
it is suitable for working with geographical data;
the concept of “reachability” in DBSCAN intuitively corresponds to setting a maximum search radius for nearby objects.
Discussion of the results
Results of the allocation of geographical areas on the territory of the Russian Federation
An example of testing the proposed model for identifying regions of accumulation of industrial facilities (533 in total) that are promising from the point of view of organizing clusters of CO2 capture for emitters of the cement (65 plants), metallurgical (79 plants) and energy (389 plants) industries in Russia is shown in the Fig.6.
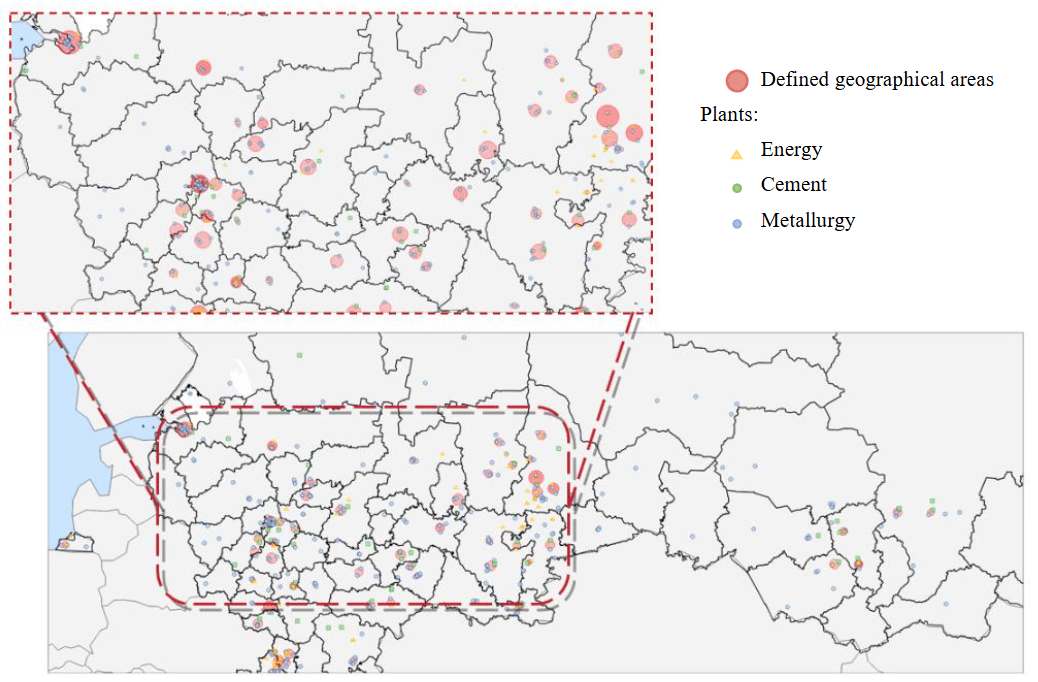
Fig.6. Visualization of search results for areas for the organization of CO2 capture and transport clusters in the Russian Federation
It is noteworthy that in terms of the size of the area (by the number of objects included in it), large cities of Federal significance, as well as the regions of their location, play a visible role. On the one hand, this indicates the presence of additional social barriers that may arise during the implementation of CCU|S projects in these geographical areas [40]. On the other hand, this is another confirmation of the role of large cities in shaping the climate agenda [41, 42], as well as the relevance of the development of initiatives such as C40 Cities.
Nationwide, 94 regions were identified, covering 63.7 % of all reviewed facilities (cement – 46, metallurgical – 49, and energy – 252 plants) and 72.2 % of total emissions (Fig.7). Naturally, energy companies, due to their prevalence, are present in 88 identified areas, covering 65.7 % of their total emissions. For metallurgical and cement plants, the share of emissions coverage in the identified areas was 95.6 and 55 %, respectively.
In terms of districts of the Russian Federation, in addition to large cities the significant share of emissions falls on traditional industrially oriented subjects (taking into account the industry coverage of the enterprises considered), such as Chelyabinsk, Sverdlovsk, Kemerovo regions, Krasnoyarsk Territory, etc. These same regions are leaders in terms of CO2 volumes concentrated in the designated geographic areas.
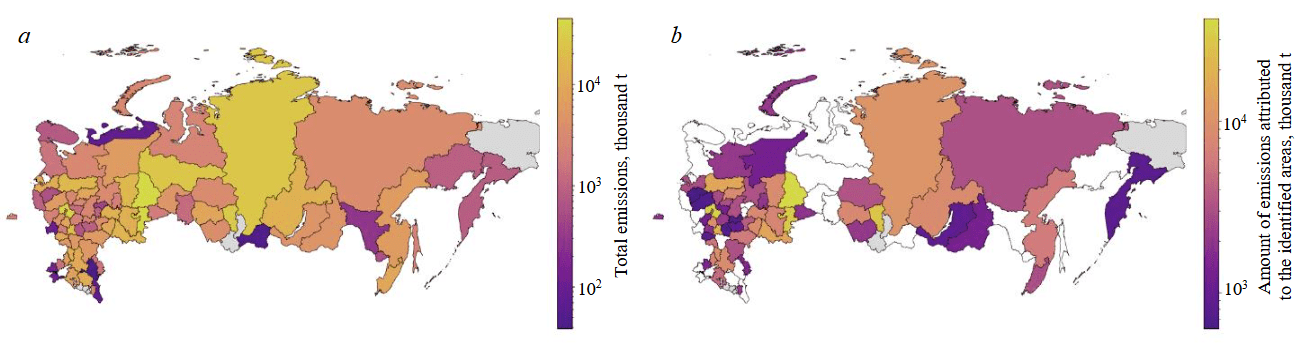
Fig.7. The results of the assessment of the total emissions of the districts (а) and the amount of emissions attributed to the identified areas in a specific district (b)
Assessment of the effects of the cluster approach
The analysis performed in the previous section allows us to make a first approximation in terms of identifying geographical areas that are promising from the point of view of cluster organization. The next step is to directly assess the effects they create, according to the approach to assessing the effects of organizing CO2 capture clusters. For this purpose, six areas were selected (out of 94 identified), characterized by different emissions, as well as the number of enterprises located in them (Table 4). The longitude and latitude values of all enterprises have been converted to the Cartesian coordinate system.
Table 4
Characteristics of geographical areas
|
Area |
Number of plants |
Total annual emissions, thousand t CO2 |
||
|
Energy |
Metallurgy |
Cement |
||
|
1 |
20 |
0 |
0 |
28876.8 |
|
2 |
4 |
3 |
0 |
22988.6 |
|
3 |
3 |
2 |
1 |
18745.1 |
|
4 |
2 |
2 |
1 |
12334.4 |
|
5 |
15 |
1 |
0 |
11346.6 |
|
6 |
2 |
1 |
2 |
11258.8 |
The results (Table 5) show that using a cluster approach in selected areas can reduce the total cost of CO2 capture by an average of 13.51 % (with a maximum cluster radius of 30 km), 12.46 % (20 km) and 6.44 % (10 km). The potential for economies of scale through shared pipeline is marginal for short transport distances (storage ≤50 km from centroid), demonstrating cost reductions in only 22.2 % of evaluated configurations (36 total cases) with savings ranging 4.14-29.2 %. However, with changing the transportation distance to 100 km, cost reductions occur in 66.67 % of configurations (18 cases), achieving 1.67-52.10 % savings. For transportation at 200 and 500 km, cost reductions were achieved in all the considered cases and averaged 37.26 % and 57.01 %, respectively, the possibility of which is confirmed in study [43].
Table 5
Matrix of CO2 capture and transportation cost changes* across different cluster configurations
|
Area |
Distance from the cluster center, km** |
Δ of capture costs, % |
Δ of transportation costs, % |
Δ of total costs, % |
||||||
|
10 km*** |
20 km |
30 km |
10 km |
20 km |
30 km |
10 km |
20 km |
30 km |
||
|
1 |
0 |
–3.87 |
–16.10 |
–17.05 |
175.11 |
347.30 |
633.60 |
–2.58 |
–10.60 |
–9.48 |
|
50 |
–4.14 |
147.64 |
228.38 |
–3.88 |
–11.91 |
–10.77 |
||||
|
100 |
–16.30 |
–41.15 |
42.43 |
79.89 |
–5.65 |
–13.50 |
–12.43 |
|||
|
200 |
–6.79 |
–17.04 |
–52.96 |
–14.67 |
–2.61 |
–10.71 |
–16.17 |
–15.82 |
||
|
500 |
–5.44 |
–16.59 |
–17.42 |
–70.06 |
–52.70 |
–47.81 |
–17.50 |
–23.33 |
–23.09 |
|
|
2 |
0 |
–11.38 |
–14.81 |
168.61 |
286.91 |
–10.60 |
–13.50 |
|||
|
50 |
–31.95 |
–13.32 |
–11.94 |
–14.77 |
||||||
|
100 |
–52.10 |
–42.62 |
–13.49 |
–16.25 |
||||||
|
200 |
–57.02 |
–51.56 |
–15.33 |
–17.99 |
||||||
|
500 |
–64.83 |
–62.67 |
–21.71 |
–24.06 |
||||||
|
3 |
0 |
–8.44 |
–14.26 |
–12.52 |
245.59 |
561.19 |
772.84 |
–7.45 |
–12.00 |
–9.44 |
|
50 |
–18.76 |
27.23 |
56.46 |
–8.72 |
–13.15 |
–10.68 |
||||
|
100 |
–41.69 |
–18.14 |
–2.96 |
–10.13 |
–14.45 |
–12.04 |
||||
|
200 |
–14.26 |
–50.38 |
–36.85 |
–12.03 |
–16.19 |
|||||
|
500 |
–11.56 |
–58.37 |
–52.94 |
–47.81 |
–17.87 |
–21.57 |
–18.41 |
|||
|
Area |
Distance from the cluster center, km** |
10 km*** |
20 km |
30 km |
10 km |
20 km |
30 km |
10 km |
20 km |
30 km |
|
4 |
0 |
–2.66 |
–4.76 |
–6.16 |
–10.07 |
65.37 |
386.19 |
–2.73 |
–4.06 |
–2.27 |
|
50 |
–13.53 |
–29.22 |
–17.43 |
93.25 |
–3.50 |
–5.16 |
–10.13 |
|||
|
100 |
–41.84 |
–35.36 |
19.97 |
–4.92 |
–6.52 |
–11.59 |
||||
|
200 |
–14.96 |
–59.31 |
–55.77 |
–18.05 |
–8.53 |
–10.04 |
–15.28 |
|||
|
500 |
–13.53 |
–62.15 |
–60.97 |
–48.97 |
–15.76 |
–17.14 |
–21.34 |
|||
|
5 |
0 |
–10.99 |
–19.38 |
409.22 |
722.20 |
–7.37 |
–7.82 |
|||
|
50 |
28.02 |
231.94 |
–9.52 |
–9.94 |
||||||
|
100 |
–27.18 |
76.29 |
–12.15 |
–12.49 |
||||||
|
200 |
–11.16 |
–18.53 |
–57.99 |
–0.66 |
–17.25 |
–16.21 |
||||
|
500 |
–10.95 |
–74.54 |
–50.88 |
–28.07 |
–27.24 |
|||||
|
6 |
0 |
–0.62 |
–5.88 |
–5.88 |
29.94 |
151.28 |
172.27 |
–0.35 |
–4.53 |
–4.35 |
|
50 |
0.00 |
–5.26 |
0.00 |
30.27 |
46.42 |
0.00 |
–4.52 |
–4.79 |
||
|
100 |
–10.47 |
–1.67 |
–5.48 |
–5.71 |
||||||
|
200 |
–0.62 |
–5.88 |
–44.07 |
–40.88 |
–38.77 |
–4.01 |
–8.62 |
–8.45 |
||
|
500 |
–1.94 |
–53.76 |
–53.10 |
–50.88 |
–9.95 |
–14.18 |
–10.54 |
|||
* The change in all costs was estimated in relation to a situation where capture is decentralized, i.e. at each emission source facility, and transportation does not involve the construction of a single main pipeline.
** The location of the storage facility was set arbitrarily in 5 variants, taking into account both the possibility of organizing clusters near cities (the need to move the storage/CO2 disposal facility outside the city/region) and the situation with the possible disposal of CO2 in geological storage facilities, usually located far from industrial facilities 50, 100, 200 and 500 km away. This means that the storage facility is located at an appropriate distance from the “center of mass” of all emitters.
*** 10, 20 and 30 km is a maximal radius for cluster creation.
Total cost reductions were achieved in every configuration, averaging 12.02 %. With expanded cluster radii (≥20 km) and storage distances (≥200 km), the impact on total costs intensified – exceeding 16.18 % in most configurations (mean – 17.81 %). Some modeled cases demonstrated even higher performance. Such cases represent exceptions rather than the norm, as achieving reductions exceeding 25 % (Area 5) requires: high density of small emission sources; optimal spatial distribution of facilities; strategic storage site placement. The results demonstrate that while the cluster approach is not a panacea for CCU|S cost reduction, it can make a significant contribution to addressing this challenge, particularly for small emission sources. This finding is consistent with the conclusions of a similar study [44], conducted using the SimCCSPRO software – a commercial version of the open software SimCCS [45].
Table 6
Characteristics of clusters formed under different configurations in each of the geographical areas
|
Area |
Number of |
|
|
clusters |
clustered emitters |
|
|
1 |
2-4 |
9-20 |
|
2 |
1 |
5-6 |
|
3 |
1-2 |
4-6 |
|
4 |
1-2 |
2-5 |
|
5 |
2-4 |
12-15 |
|
6 |
0-2 |
0-5 |
It is also important that the more enterprises are involved in creating a cluster, the greater the effect it can have. The limiting factor in this case is the technological feasibility of combining remote facilities into a single network to create a shared infrastructure. As mentioned above, the concept of combining emitters into a CO2 capture cluster (without taking into account its further transportation to storage), at the current level of techno-logy development, can be considered on a scale of tens of kilometers.
It should also be noted that there may be no differences between individual configurations for the same area in terms of the amount of reduction of certain types of costs. The reason for this is that the cost of capture will change only if the formed clusters are restructured (Table 6). If the clusters do not change, then their effect remains the same.
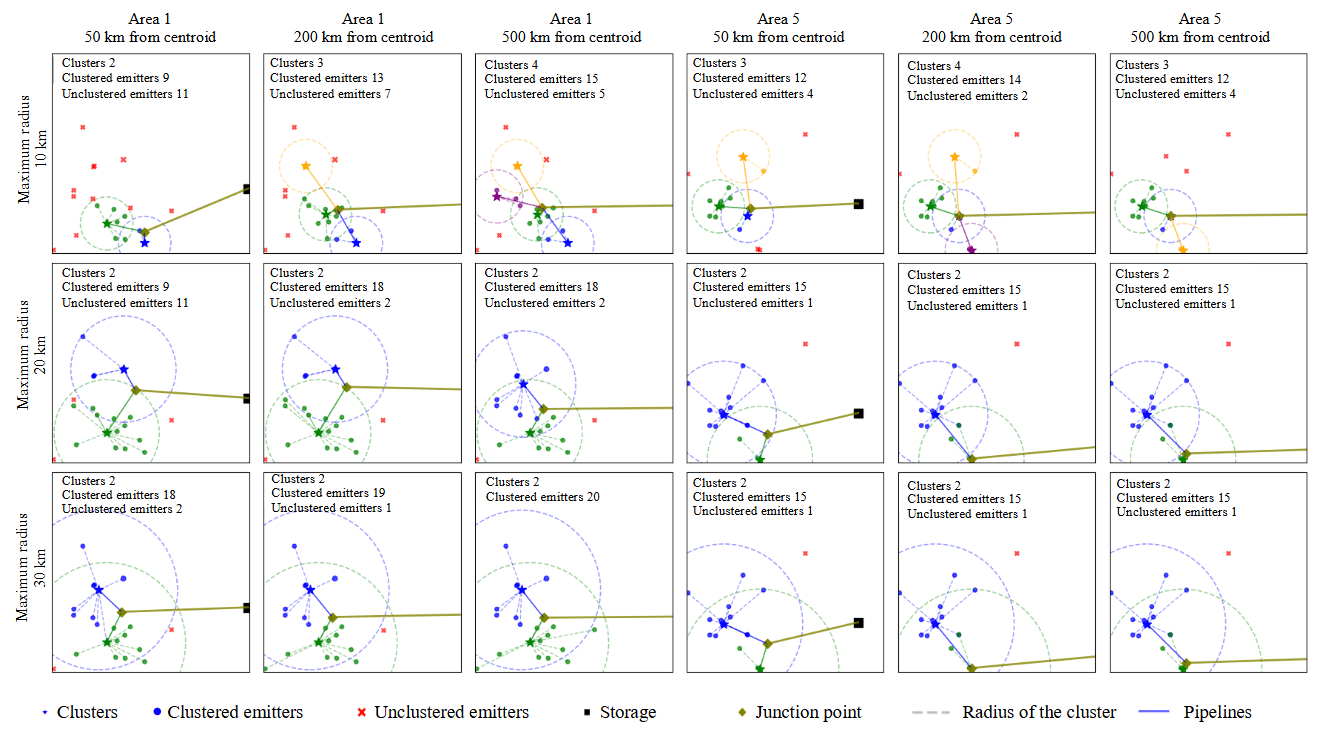
Fig.8. Visualization of clusters across selected configurations: storage locations at 50, 200, and 500 km from the centroid; and maximum cluster radii of 10, 20, and 30 km
Transportation costs are also related to cluster configuration. On the one hand, they influence the assessment of the feasibility of joining individual enterprises to clusters, since when removing the CO2 storage, the share of transportation costs in the considered cases reached 17.6 % of total costs. On the other hand, the emergence of new/changing current clusters affects the process of finding a pipeline connection point, which also affects costs. Visualization of the spatial organization of clusters in areas 1 and 5 (selected based on the largest number of emitters) is shown in Fig.8.
Conclusion
CCU|S technologies are one of the promising options for reducing greenhouse gas emissions, which, unlike renewable energy, does not require an immediate transition from hydrocarbon energy and is more flexible in terms of potential implementation industries. Nevertheless, they are not without drawbacks, the main one of which is the high cost of such solutions. Despite the strengthening and intensification of technical research, they are currently insufficient to radically reduce the cost of both CO2 capture and transportation.
A possible solution to this problem is the use of organizational schemes related to the formation of CO2 capture clusters with shared infrastructure, which are practically ignored in the international literature, unlike transportation and storage clusters. The importance of this issue is determined by the fact that it is at the capture stage that 60-80 % of the total costs of most CCU|S projects are carried out.
To study this issue, a series of models was developed in this paper, which allowed, firstly, to identify 94 geographical areas in Russia that are promising in terms of organizing clusters of CO2 capture. These areas are characterized by an increased accumulation of stationary industrial sources of emissions, among which 533 enterprises of the energy and cement industries, as well as ferrous metallurgy, were considered. The combined annual emissions of these enterprises amount to more than 0.5 billion t of CO2.
Secondly, a model was developed to assess the effects of using the cluster approach in the organization of CO2 capture and transportation through shared infrastructure. This model takes into account the spatial characteristics of the sources, as well as the amount of CO2 emissions and its partial pressure in the gas stream of enterprises. The model was tested based on information about industrial facilities in 6 geographical areas (out of 94 identified), selected based on the maximum cumulative annual emissions of CO2.
The results showed the reduction of capture costs by an average of 6.44-13.51 %, depending on the maximum radius of cluster formation. An additional effect can be obtained in the case of shared gas pipelines, which made it possible to reduce the costs of this stage by an average of 37.26 % and 57.01 % for a 200 km and 500 km distances, accordingly. Under the same distance and with a maximum cluster radius of no less than 20 km, the average reduction in aggregate costs across the evaluated configurations amounted to 17.81 %.
The results show that for scaling CCU|S technologies, not only regulatory changes and technological innovations are important, but also effective organizational schemes that largely determine the business models for the implementation of such projects. These business models can become the basis for the formation of new cross-industry value chains that can give impetus to the development of the CO2 sequestration industry and its large-scale shared infrastructure, if there is a sustained interest in this area from different stakeholders.
The approaches, algorithms, and models proposed in this article for identifying geographic areas, as well as evaluating the effects of cluster creation, can be used to identify promising areas for the implementation of CCU|S pilot projects in Russia. The developed toolkit also allows to answer the question of what is the effect of using the cluster approach with shared infrastructure in organizing the processes of CO2 capture at stationary industrial facilities and its transportation to an arbitrarily located storage facility.
Nevertheless, this study has a number of limitations that should be taken into account in further research and in the practical use of its results:
- It is unlikely that objects located at multiple greater distances from each other than discussed in this article will cluster. This is due to the increasing costs of transporting crude gas (up to the stage of CO2 separation).
- The developed toolkit is designed for rapid assessment of individual economic effects, but it is not sufficient to develop a detailed feasibility study of the project, which requires taking into account a significant number of additional factors, for example, the features of the natural landscape, the density of the current construction site (if we are talking about settlements), long-term infrastructure development plans, hydraulic regimes, etc. Similarly, further development of CCU|S cluster effects assessment models appears imperative.
- The testing was carried out within specific technological and industry boundaries, reflected in the text of the study. For example, only onshore pipeline delivery was considered, and only energy, cement, and metallurgical (ferrous metallurgy) enterprises were considered as sources of emissions.
- The results show that the cluster approach is an effective but not universal cost-cutting tool. Its effectiveness significantly depends on the specifics of emission sources, as well as on their relative location.
Obligations of States in respect of Climate Change. Summary of the Advisory Opinion of 23 July 2025. URL: icj-cij.org (accessed 10.08.2025).
Climate Change Tracker. URL: climatechangetracker.org (accessed 10.08.2025).
Russian Federation. 2024 National Inventory Document (NID). Biennial Transparency reports (BTR), GHG inventories. URL: unfccc.int/documents/645136 (accessed 10.08.2025).
Global Energy Perspective 2023: CCUS outlook. URL: www.mckinsey.com (accessed 10.08.2025).
IEAGHG Technical Report 2022-04: From Carbon Dioxide to Building Materials – Improving Process Efficiency. IEAGHG, 2022, p. 121. URL: publications.ieaghg.org (accessed 10.08.2025).
Ricome G., Guzzafame M., Degnan-Rojeski J., Jawa I. Cement’s Carbon Footprint Doesn’t Have to Be Set in Stone: The Future of Process Industries. URL: www.bcg.com/publications/2024/cement-industry-carbon-footprint (accessed 10.08.2025).
IEAGHG Technical Review 2018-TR03: Cost of CO2 capture in the industrial sector: cement and iron industries, IEAGHG, 2018, p. 65. URL: publications.ieaghg.org (accessed 10.08.2025).
Sprenger T., Moritz M., Wild P., Çam E. Low-carbon steel. A global cost comparison. Institute of Energy Economics at the University of Cologne: official website, 45 slides. URL: www.ewi.uni-koeln.de (accessed 10.08.2025).
CCUS Policies and Business Models: Building a Commercial Market. International Energy Agency, 2023, p. 121. URL: iea.blob.core.windows.net (accessed 10.08.2025).
IEAGHG Technical Review 2019-TR02: CO2STCap (Cutting cost of CO2 Capture in Process Industry). IEAGHG, 2019, p. 28. URL: publications.ieaghg.org (accessed10.08.2025).
Fattouh B., Muslemani H., Jewad R. Capture carbon, capture value: An overview of CCS business models. OIES Paper: CM, № 08. Oxford: The Oxford Institute for Energy Studies, 2024, p. 28. URL: www.econstor.eu/bitstream/10419/296651/1/1882397541.pdf (accessed 10.08.2025).
CCUS Policies and Business Models: Building a Commercial Market. International Energy Agency, 2023, p. 121. URL: iea.blob.core.windows.net (accessed 10.08.2025).
Seyyed M., Williams E., Smith B., Murfet C. Business Models for CCS Hubs: Challenges and Opportunities with a Focus on MENA. Global CCS Institute, 2024, p. 82. URL: www.globalccsinstitute.com (accessed 10.08.2025).
Enhance Energy and Wolf Midstream Sign Agreement to Finance and Construct the Alberta Carbon Trunk Line. URL: wolfmidstream.com (accessed 10.08.2025).
Al Reyadah: Project Details. URL: www.geos.ed.ac.uk/sccs/project-info/622 (accessed 10.08.2025).
Fattouh B., Muslemani H., Jewad R. Capture carbon, capture value: An overview of CCS business models. OIES Paper: CM, N 08. Oxford: The Oxford Institute for Energy Studies, 2024, p. 28. URL: www.econstor.eu/bitstream/10419/296651/1/1882397541.pdf (accessed 10.08.2025).
Integrated Environmental Control Model (IECM). Ver. 11.5. URL: www.uwyo.edu/iecm/download-iecm.html (accessed 10.08.2025).
2023 CCUS Cost Update: factors affecting levelised cost (LCOCCUS) to 2030 and beyond. Wood Mackenzie, 2023. URL: www.woodmac.com (accessed 10.08.2025).
[19] Global Power Plant Database. URL: github.com/wri/global-power-plant-database (accessed 10.08.2025).
References
- Tsvetkov P., Andreichyk A. The Analysis of Goals, Results, and Trends in Global Climate Policy Through the Lens of Regulatory Documents and Macroeconomics. Sustainability. 2025. Vol. 17. Iss. 10. N 4532. DOI: 10.3390/su17104532
- ÓhAiseadha C., Quinn G., Connolly R. et al. Energy and Climate Policy – An Evaluation of Global Climate Change Expenditure 2011-2018. Energies. 2020. Vol. 13. Iss. 18. N 4839. DOI: 10.3390/en13184839
- Belsky A.A., Ngyen V.T., Sheikhi M.H., Starshaia V.V. Analysis of specifications of bifacial photovoltaic panels. Renewable and Sustainable Energy Reviews. 2025. Vol. 224. N 116092. DOI: 10.1016/j.rser.2025.116092
- Tcvetkov P. Climate Policy Imbalance in the Energy Sector: Time to Focus on the Value of CO2 Utilization. Energies. 2021. Vol. 14. Iss. 2. N 411. DOI: 10.3390/en14020411
- Bashmakov I.A., Nilsson L.J., Acquaye A. et al. Industry. Climate Change 2022: Mitigation of Climate Change. Contribution of Working Group III to the Sixth Assessment Report of the Intergovernmental Panel on Climate Change. Cambridge University Press, 2022, p. 1161-1243. DOI: 10.1017/9781009157926.013
- Makarov I. Does resource abundance require special approaches to climate policies? The case of Russia. Climatic Change. 2022. Vol. 170. Iss. 1-2. N 3. DOI: 10.1007/s10584-021-03280-0
- Bashmakov I. Improving the Energy Efficiency of Russian Buildings: Forecast to 2050. Problems of Economic Transition. 2016. Vol. 58. Iss. 11-12. P. 1096-1128. DOI: 10.1080/10611991.2016.1316099
- Rzazade U., Deryabin S., Temkin I. et al. On the Issue of the Creation and Functioning of Energy Efficiency Management Systems for Technological Processes of Mining Enterprises. Energies. 2023. Vol. 16. Iss. 13. N 4878. DOI: 10.3390/en16134878
- Zhukovskiy Y., Koshenkova A., Vorobeva V. et al. Assessment of the Impact of Technological Development and Scenario Forecasting of the Sustainable Development of the Fuel and Energy Complex. Energies. 2023. Vol. 16. Iss. 7. N 3185. DOI: 10.3390/en16073185
- Mashhadi Rajabi M. Dilemmas of energy efficiency: A systematic review of the rebound effect and attempts to curb energy consumption. Energy Research & Social Science. 2022. Vol. 89. N 102661. DOI: 10.1016/j.erss.2022.102661
- Shirov A.A., Kolpakov A.Yu. Target Scenario of Low Greenhouse Gas Emissions Socio-Economic Development of Russia for the Period until 2060. Studies on Russian Economic Development. 2023. Vol. 34. N 6, p. 758-768. DOI: 10.1134/S1075700723060151
- Litvinenko V. The Role of Hydrocarbons in the Global Energy Agenda: The Focus on Liquefied Natural Gas. Resources. 2020. Vol. 9. Iss. 5. N 59. DOI: 10.3390/resources9050059
- Cherepovitcyn A.E. Economic and social aspects of CO2 capture and storage technologies development in the oil and gas complex of Russia. Journal of Mining Institute. 2015. Vol. 211, p. 125-130 (in Russian).
- Porfiriev B.N., Shirov A.A., Kolpakov A.Y., Edinak E.A. Opportunities and risks of the climate policy in Russia. Voprosy ekonomiki. 2022. N 1, p. 72-89 (in Russian). DOI: 10.32609/0042-8736-2022-1-72-89
- Pal M., Karaliūtė V., Malik S. Exploring the Potential of Carbon Capture, Utilization, and Storage in Baltic Sea Region Countries: A Review of CCUS Patents from 2000 to 2022. Processes. 2023. Vol. 11. Iss. 2. N 605. DOI: 10.3390/pr11020605
- Cherepovitsyna A., Kuznetsova E., Popov A., Skobelev D. Carbon Capture and Utilization Projects Run by Oil and Gas Companies: A Case Study from Russia. Sustainability. 2024. Vol. 16. Iss. 14. N 6221. DOI: 10.3390/su16146221
- Pasechnik L.A., Pigai I.N., Skachkov V.M., Yatsenko S.P. Extraction of Rare Elements from Residual Sludge of Alumina Production with the Use of Flue Gas of Sintering Kilns. Ecology and Industry of Russia. 2013. N 6, p. 36-38 (in Russian). DOI: 10.18412/1816-0395-2013-6-36-38
- Tcvetkov P., Cherepovitsyn A., Fedoseev S. The Changing Role of CO2 in the Transition to a Circular Economy: Review of Carbon Sequestration Projects. Sustainability. 2019. Vol. 11. Iss. 20. N 5834. DOI: 10.3390/su11205834
- Vaganov E.A., Porfiryev B.N., Shirov A.A. et al. Assessment of the contribution of Russian forests to climate change mitigation. Economy of Region. 2021. Vol. 17. N 4, p. 1096-1109. DOI: 10.17059/ekon.reg.2021-4-4
- Roussanaly S., Berghout N., Fout T. et al. Towards improved cost evaluation of Carbon Capture and Storage from industry. International Journal of Greenhouse Gas Control. 2021. Vol. 106. N 103263. DOI: 10.1016/j.ijggc.2021.103263
- Brandl P., Bui M., Hallett J.P., Mac Dowell N. Beyond 90 % capture: Possible, but at what cost? International Journal of Greenhouse Gas Control. 2021. Vol. 105. N 103239. DOI: 10.1016/j.ijggc.2020.103239
- Kearns D., Liu H., Consoli C. Technology Readiness and Costs of CCS. Global CCS Institute, 2021, p. 49.
- Technologies for carbon dioxide capture, useful use and storage (CCUS). Ed. by A.Osiptsova, I.Gaidy. Skolkovskii institut nauki i tekhnologii, 2022, p. 79 (in Russian).
- Wan Yun Hong. A techno-economic review on carbon capture, utilisation and storage systems for achieving a net-zero CO2 emissions future. Carbon Capture Science & Technology. 2022. Vol. 3. N 100044. DOI: 10.1016/j.ccst.2022.100044
- Geweda A.E., Zayed M.E., Khan M.Y., Alquaity A.B.S. Mitigating CO2 emissions: A review on emerging technologies/strategies for CO2 capture. Journal of the Energy Institute. 2025. Vol. 118. N 101911. DOI: 10.1016/j.joei.2024.101911
- Newman A.J.K., Dowson G.R.M., Platt E.G. et al. Custodians of carbon: creating a circular carbon economy. Frontiers in Energy Research. 2023. Vol. 11. N 1124072. DOI: 10.3389/fenrg.2023.1124072
- Dowson G.R.M., Reed D.G., Bellas J.-M. et al. Fast and selective separation of carbon dioxide from dilute streams by pressure swing adsorption using solid ionic liquids. Faraday Discussions. 2016. Vol. 192, p. 511-527. DOI: 10.1039/C6FD00035E
- Geissdoerfer M., Vladimirova D., Evans S. Sustainable business model innovation: A review. Journal of Cleaner Production. 2018. Vol. 198, p. 401-416. DOI: 10.1016/j.jclepro.2018.06.240
- Osterwalder A., Pigneur Y. Business Model Generation: A Handbook for Visionaries, Game Changers, and Challengers. Wiley, 2010, p. 288.
- Nevskaya M., Shabalova A., Kosovtseva T., Nikolaychuk L. Applications of simulation modeling in mining project risk management: criteria, algorithm, evaluation. Journal of Infrastructure, Policy and Development. 2024. Vol. 8. N 8. N 5375. DOI: 10.24294/jipd.v8i8.5375
- Ponomarenko T.V., Gorbatyuk I.G., Cherepovitsyn A.E. Industrial clusters as an organizational model for the development of Russia petrochemical industry. Journal of Mining Institute. 2024. Vol. 270, p. 1024-1037.
- Yashalova N.N., Potravny I.M. Tools to ensure carbon neutrality in the Russian coal business. Ugol. 2023. N 10 (1172), p. 66-71 (in Russian). DOI: 10.18796/0041-5790-2023-10-66-71
- Barlow H., Shahi S.S.M., Kearns D.T. Advancements in CCS technologies and costs. Global CCS Institute, 2025, p. 65.
- Tsvetkov P.S. Software Certificate of State Registration N 2025617009 (Russian Federation). Program for determining parameters of clusters for CO2 capture from stationary industrial emission sources. Publ. 20.03.2025. Bul. N 3 (in Russian).
- Litvinenko V.S., Petrov E.I., Vasilevskaya D.V. et al. Assessment of the role of the state in the management of mineral resources. Journal of Mining Institute. 2023. Vol. 259, p. 95-111. DOI: 10.31897/PMI.2022.100
- Cuihong Chen, Ruochong Xu, Dan Tong et al. A striking growth of CO2 emissions from the global cement industry driven by new facilities in emerging countries. Environmental Research Letters. 2022. Vol. 17. N 4. N 044007. DOI: 10.1088/1748-9326/ac48b5
- Xinying Qin, Dan Tong, Fei Liu et al. Global and Regional Drivers of Power Plant CO2 Emissions Over the Last Three Decades Revealed From Unit-Based Database. Earth’s Future. 2022. Vol. 10. Iss. 10. N e2022EF002657. DOI: 10.1029/2022EF002657
- Ruochong Xu, Dan Tong, Davis S.J. et al. Plant-by-plant decarbonization strategies for the global steel industry. Nature Climate Change. 2023. Vol. 13. N 10, p. 1067-1074. DOI: 10.1038/s41558-023-01808-z
- Tsvetkov P.S. Software Certificate of State Registration N 2025662463 (Russian Federation). A program for the automated prospecting of territories suitable for the establishment of CO2 capture clusters. Publ. 21.05.2025. Bul. N 6.
- Tcvetkov P., Cherepovitsyn A., Fedoseev S. Public perception of carbon capture and storage: A state-of-the-art overview. Heliyon. 2019. Vol. 5. Iss. 12. N e02845. DOI: 10.1016/j.heliyon.2019.e02845
- Porfiryev B.N., Bobylev S.N. Cities and Megalopolises: The Problem of Definitions and Sustainable Development Indicators. Studies on Russian Economic Development. 2018. Vol. 29. N 2, p. 116-123. DOI: 10.1134/S1075700718020119
- Kumar P. Climate Change and Cities: Challenges Ahead. Frontiers in Sustainable Cities. 2021. Vol. 3. N 645613. DOI: 10.3389/frsc.2021.645613
- Gunawan T.A., Gittoes L., Isaac C. et al. Design Insights for Industrial CO2 Capture, Transport, and Storage Systems. Environmental Science & Technology. 2024. Vol. 58. Iss. 33, p. 14608-14617. DOI: 10.1021/acs.est.4c05484
- Gunawan T.A., Hongxi Luo, Greig C., Larson E. Shared СО2 capture, transport, and storage for decarbonizing industrial clusters. Applied Energy. 2024. Vol. 359. N 122775. DOI: 10.1016/j.apenergy.2024.122775
- Middleton R.S., Yaw S.P., Hoover B.A., Ellett K.M. SimCCS: An open-source tool for optimizing CO2 capture, transport, and storage infrastructure. Environmental Modelling & Software. 2020. Vol. 124. N 104560. DOI: 10.1016/j.envsoft.2019.104560