
Permeability prediction of oil formations via machine learning-assisted simulation of well flow tests
- 1 — Postgraduate Student Perm National Research Polytechnic University ▪ Orcid ▪ Elibrary ▪ Scopus
- 2 — Ph.D., Dr.Sci. Professor Perm National Research Polytechnic University ▪ Orcid ▪ Elibrary ▪ Scopus ▪ ResearcherID
Abstract
We present an innovative approach to simulating flow tests of production wells operating in clastic reservoirs of oil fields in the Perm Region. To solve this issue, modern machine learning solutions (CatBoost, Random Forest, XGBoost, MLP, Gradient Boosting, etc.) were used, which allowed achieving high prediction accuracy. The main parameter for simulating and research is bottomhole pressure at various stages of its recovery during well flow testing. The use of the SHAP model interpretation method for the first time made it possible to assess the impact of geotechnical parameters on bottomhole pressure and identify key ones among them. Analysis of the bottomhole pressure recovery prediction model sensitivity to changes in initial parameters made it possible to evaluate the degree of their influence on the pressure recovery curves (PRC). The uniqueness of the proposed approach lies in studying the significance of parameters at various time stages of bottomhole pressure recovery during flow testing, which allows for a more detailed understanding of the processes occurring under formation conditions. The proposed algorithms made it possible to simulate PRC that are as close as possible to actual data, as well as to study the dynamics of permeability of the remote formation zone in real time. This approach opens up new horizons in simulating flow tests and allows for highly detailed and timely assessment of formation filtration properties across the entire production well stock simultaneously. The process engineering solution is aimed at promptly assessing filtration parameters of remote formation zones and provides the ability to monitor permeability changes, which helps to timely identify areas of reduced oil inflow and develop measures to restore well productivity. This approach significantly reduces economic risks associated with conducting expensive field tests while ensuring reliability and validity of predicted indicators with minimal resource and time costs.
The research was supported by the Ministry of Science and Higher Education of the Russian Federation (project N FSNM-2024-0005).
Introduction
Formation permeability and the bottomhole zone (BZ) state are key factors determining the efficiency of oil and gas production [1, 2]. The prediction and monitoring of these parameters allow optimizing field development [3], preventing operational complications during exploitation, and increasing the overall hydrocarbon recovery factor [4, 5].
Existing methods for determining permeability have numerous drawbacks. Empirical correlations depend on statistical relationships between core permeability measurements and petrophysical properties, making them unsuitable for application in various geological conditions [6, 7]. The Flow Zone Indicator (FZI) method requires extensive core material analysis, resulting in a lengthy process, and the obtained results may not fully reflect the properties of the remote formation zone [8, 9]. Traditional methods based on empirical correlations for permeability estimation using petrophysical data often lead to inaccuracies, uncertainties, and can be time-consuming and expensive [10, 11]. Permeability prediction using machine learning interpretation of logging data is being actively studied, characterizing formation properties in close proximity to the wellbore [12-14]. Predicting permeability through image analysis and void space information using machine learning methods shows promise. However, this approach requires core samples and does not allow evaluating properties in remote formation zones [15].
One of the primary methods for assessing formation filtration parameters is the interpretation of well flow testing (WFT) under unsteady flow conditions using pressure recovery curves (PRS) and level recovery tests (LRT). The specific features of these methods include prolonged well shutting-in and associated reduction in oil production [16]. Accurate prediction of remote formation permeability is complicated by the peculiarities of WFT interpretation. It is necessary to identify the reasons for the low quality of a significant number of WFT in the Perm Region:
- difficulty in isolating the plane-radial flow section due to wellbore influence;
- insufficient duration of the testing period [17];
- impact of constant pressure boundary;
- well interference effects;
- low resolution of the telemetry system (TMS).
With the increasing application of downhole pressure sensors [18], it has become possible to widely utilize the pressure stabilization method (PSM) [19]. However, not all wells are equipped with TMS, which complicates the monitoring of reliable bottomhole pressure dynamics. Cases of abrupt changes and prolonged interruptions in pressure recording are observed. Another widely used method is decline curve analysis, also known as production history analysis (PHA). This empirical method is utilized for estimating hydrocarbon production, evaluating formation filtration parameters and well condition (skin factor). This procedure has several drawbacks: requirement for stable operation of neighbouring wells, uncertainty of filtration regimes in multilayer reservoirs with multiple types of void spaces, fluctuations in key parameters [20, 21]. The main advantages of PSM and PHA methods include the absence of the need to shut wells in. However, extending the duration of studies leads to uncertainty regarding the emergence of indirect factors and limitations [22].
Machine learning methods for estimating formation permeability are being actively studied and improved. The use of artificial neural networks (ANN) in studies [23-25] for permeability prediction showed better metrics compared to multiple linear regression (MLR) and multiple nonlinear regression (MNLR). The authors of [26] proposed an evolving ANN with a genetic algorithm (GA) optimizer, achieving higher accuracy than a standard ANN. Study [27] employed a combination of MLP (Multilayer Perceptron), RBF (Radial Basis Function), and GRNN (Generalized Regression Neural Network) networks optimized using GA, which improved prediction accuracy. The authors of [28] investigated PSO (Particle Swarm Optimization) and SSD (Social Ski-Driver) algorithms for permeability prediction, finding that the MLP-SSD model demonstrated the highest accuracy after feature selection using the SHAP (Shapley Additive Explanations) library. This library was also applied in studies [29, 30] for feature selection and interpretation, with the PSO-XGBoost model showing the best results.
Despite the promising nature of ANN, there is a significant issue of slow convergence – the training rate determines how quickly the model adapts to the task. A high training rate can lead to suboptimal solutions, while a low rate can slow down the convergence process, i.e., the adjustment of model weights to minimize error. Study [31] presents a solution to this issue using a Modular Neural Network (MNN) model. The use of an RBF Neural Network [32] provided faster permeability prediction based on porosity compared to a standard fully connected network. Study [33] combines ANN with fuzzy logic, where the combination of their advantages resulted in improved permeability prediction accuracy compared to using the models separately. Work [34] utilized Nuclear Magnetic Resonance (NMR) in combination with logging data to enhance permeability prediction metrics. The application of a Functional Network (FN) [35] provided better results compared to ANN and regression methods. Researchers [36] employed Relevance Vector Regression (RVR) with GA optimization, which outperformed the Support Vector Machine (SVM) model. In [37], fuzzy logic was applied for effective permeability prediction. The proposed clustering technique confirmed its efficiency and accuracy. The author of [7] improved fuzzy logic through feature engineering for more accurate permeability predictions. This increased the coefficient of determination R2 to 0.76 compared to linear regression (0.04) and fuzzy logic without feature engineering (0.41). Research [38] compared MLP, Support Vector Regression (SVR), and MLR models, with MLP and SVR demonstrating high accuracy. In [39], the authors used Least Squares Support Vector Machine (LSSVM) and Multilayer Extreme Learning Machine (MELM) models optimized with Cuckoo Optimization Algorithm (COA), PSO, and GA for permeability prediction. The MELM-COA hybrid showed superior metrics (Root Mean Square Error, RMSE – 0.56) compared to LSSVM and MELM with PSO and GA optimizers, as well as Convolutional Neural Network (CNN) (RMSE ranging from 0.72 to 1.24).
In [40], an ensemble machine learning model that demonstrated superior results compared to single configurations was proposed. The bagging method [15] for permeability prediction showed the best metrics. The application of ensemble models is also presented in several other studies [41-43]. The authors of [44] utilized an empirical formula and a new ensemble model for more accurate permeability prediction. The combination of SVM, ANN, and Adaptive Neuro-Fuzzy Inference System (ANFIS) models improved permeability prediction accuracy in heterogeneous oil fields [45]. Work [46] proposed a hybrid SVM-T2FL (Fuzzy Logic) with FN and feature selection, which demonstrated excellent permeability prediction model results. The authors of [47] proposed a unique MIRes (Multiple-Input deep Residual) CNN model for permeability prediction, utilizing the integration of digital and graphical data, which outperformed SIRes 1D-CNN, SIRes 2D-CNN (Single-Input deep Residual one (two) Dimensional CNN), GMDH (Group Method of Data Handling). A hybrid model using Random Forest, Lasso Regularization, and XGBoost [43] was developed for permeability prediction.
Analysis of scientific and technical literature demonstrates that the scientific community is actively developing machine learning (ML) methods for permeability estimation and prediction. However, most currently applied ML solutions rely on logging data [48]. The drawbacks of this approach include inability to estimate the average effective permeability of the well drainage zone, and requirement for up-to-date geophysical surveys on which the assessment is based.
This study is the first to utilize significant Big Data sets from well testing (pressure recovery curves, operational parameters before well shutting-in for testing, geological and physical properties of the formation and oil) conducted throughout the entire operation history of clastic deposits in oil fields of the Perm Region. The uniqueness of this work lies in the development of an approach for predicting bottomhole pressure during recovery, which in the future eliminates peculiarities and interpretation errors. The presented algorithm allows for real-time simulating of the pressure recovery curve in a well, significantly accelerating the determination of filtration parameters and enabling coverage of the entire well stock. The proposed approach contributes to more efficient and economically rational field development, ensuring resource optimization and improved decision-making in oil production. We do not suggest completely eliminating flow testing, as it serves its intended purposes, including model refinement. Synthetic tests are necessary for describing processes occurring in the formation and predicting engineering and economic indicators.
Methods
A database of highly informative flow tests of clastic reservoirs in the Perm Region fields was formed. The following WFT were excluded from the sample: tests with significant interference from neighbouring wells, tests with low TMS resolution, tests with substandard bottomhole pressure recovery measurements. The proportion of WFT with these characteristics is approximately 15 %. Thus, the primary initial information for training consists of 85 % of all analysed WFT (≈3500), including well operational parameters, pressure recovery time, geological and physical properties of the formation and oil. Category features used include well profile (directional (DW), horizontal (HW), well completion procedure (hydraulic fracturing (HF), multi-stage hydraulic fracturing (MHF). Ranges of initial parameter variations: bottomhole pressure – 0.5-24 MPa; water cut – 0-99.9 %; flow rate – 0.1-244.8 m3/day; formation volume factor – 1.0-1.7; formation compressibility – 1.1-4.6 (MPa·104)–1; rock compressibility – 0.7-1.5 (MPa·104)–1; gas content – 1.2-1210 m3/t; oil compressibility – 2.5-26.2 (MPa·104)–1; oil density – 0.6-1.2 g/cm3; effective oil-saturated thickness – 0.4-19.6 m; oil viscosity – 0.5-114.1 mPa·s; formation pressure – 1.9-24.9 MPa; porosity – 4.6-34 %; saturation pressure – 3.9-22.9 MPa; bottomhole pressure at recovery start – 0.1-23.3 MPa; recovery time – 0-265,047 min. For handling the category feature containing four unique values, the One-Hot Encoding (OHE) method was applied. It converts the category feature into several binary columns, each corresponding to one of the unique values of the original feature. The recommended CatBoost model automatically processes category features without the need for prior encoding. The predicted parameter is the bottomhole pressure at each time period of pressure recovery curve (PRC) buildup. By sequentially predicting bottomhole pressure recovery at various test duration intervals, pressure recovery curve simulation is ensured.
To assess formation pressure, the results of computations in the Data Stream Analytics modular service [49] are used. This service determines formation pressure based on field geological data using machine learning methods for both retrospective periods and prospective periods up to one year ahead. This opens up the possibility of simulating pressure recovery curves at any moment, both retrospectively and in forecast without shutting-in wells during the survey period.
The following machine learning models were used for prediction:
- MLP Neural Network – an artificial neural network consisting of multiple layers of neurons (input, hidden, and output) that can simulate complex nonlinear relationships.
- Gradient Boosting – an ensemble method that creates a sequence of models, each correcting the errors of the previous ones. Typically used with decision trees and known for high accuracy.
- Random Forest – an ensemble algorithm that builds multiple decision trees on random subsets of data and features. Predictions are averaged (for regression) or determined by voting (for classification). Provides resistance to overtraining and works well with various data types.
- XGBoost – an optimized version of gradient boosting designed for high performance and accuracy. Includes regularization, parallel training, and other improvements.
- Decision Tree – an interpretable and simple algorithm that builds a tree-like model for decision-making. Branching is based on rules that minimize errors. However, it tends to overtraining without depth limitations.
- Linear Regression – a classical statistical method assuming a linear relationship between input features and the target variable. Known for simplicity, interpretability, and speed but limited in simulating complex nonlinear relationships.
- SVR – an algorithm that constructs a hyperplane that most accurately describes the relationship between features and the target variable while minimizing errors within a specified margin. Suitable for small datasets but requires significant computational resources.
- K-Nearest Neighbors – a method based on finding the nearest neighbours of a target. Prediction is based on the target variable values of the k closest targets. Simple and effective but sensitive to data size and noise.
- CatBoost – a gradient boosting algorithm that prevents overtraining and provides high performance and accuracy. Hyperparameters were tuned using the Optuna framework – a library for hyperparameter search in machine learning, providing a convenient interface for optimization using various search algorithms. The following parameters were varied: learning rate (learning_rate) – 0.01-0.3; L2 regularization coefficient (l2_leaf_reg) – 1e-8-100.0; bagging temperature (bagging_temperature) – 0.0-10.0; random noise strength (random_strength) – 1e-8-10.0; tree depth (depth) – 4-10; number of feature split borders (border_count) – 32-255; minimum number of targets in a leaf (min_data_in_leaf) – 1-100; tree growth policy (grow_policy) – SymmetricTree, Depthwise, Lossguide. Cross-validation was used to assess model accuracy on different subsets of training data. The best hyperparameters found were: 'depth' – 10; 'learning_rate' – 0,128; 'l2_leaf_reg' – 0,0117; 'bagging_temperature' – 6,509; 'random_strength' – 1,501; 'border_count' – 183; 'min_data_in_leaf' – 5; 'grow_policy' – 'Depthwise'.
The training digital dataset was formed as follows:
- Verification and sequential selection of pressure recovery curves were performed. The absence of outliers, sharp jumps, and stepwise changes in bottomhole pressure recovery was checked.
- For each PRC, duration of recovery and bottomhole pressure values were entered into the table. The table consisted of two columns: duration of recovery and bottomhole pressure (for each PRC point). The rows represented the results of PRC measurements, with each graph point being a table row.
- For each point of the selected pressure recovery curve, the following constant parameters were added as new columns corresponding to the values before well shutting-in: flow rate, water cut, formation pressure, bottomhole pressure, BZ permeability, recovery time (time after well shutting-in), porosity, rock compressibility factor, formation compressibility factor, effective oil-saturated formation thickness, oil viscosity, gas content, oil density, oil compressibility factor, oil volume factor, saturation pressure. The model training utilized formation pressure values obtained from the interpretation of qualified well flow tests and from the Data Stream Analytics modular service.
A Spearman correlation matrix was constructed to determine relationships between features (Fig.1). The Spearman correlation measures the relationship between variables based on ranks rather than actual values. It is used to determine connections between variables, especially when data is not normally distributed or when the relationship is nonlinear. Analysis of the heatmap reveals that the following parameters have the strongest correlation with the pressure recovery pattern in the well: bottomhole pressure, formation pressure, and flow rate. The analysis also reveals strong relationships between initial parameters: direct dependence of the formation volume factor on gas content and oil compressibility, as well as inverse dependence on oil density and oil viscosity; the compressibility of the rock on porosity; the viscosity of oil on the density of oil. We see potential multicollinearity issues observed in Fig.1. Since the objective was to obtain a general understanding of the influence of selected parameters, possible distortions due to multicollinearity are considered acceptable within the scope of this study. To enhance the reliability of the results, a more detailed investigation of methods to reduce multicollinearity impact is planned, including selection of the most significant features, data normalization, and application of regularization techniques.
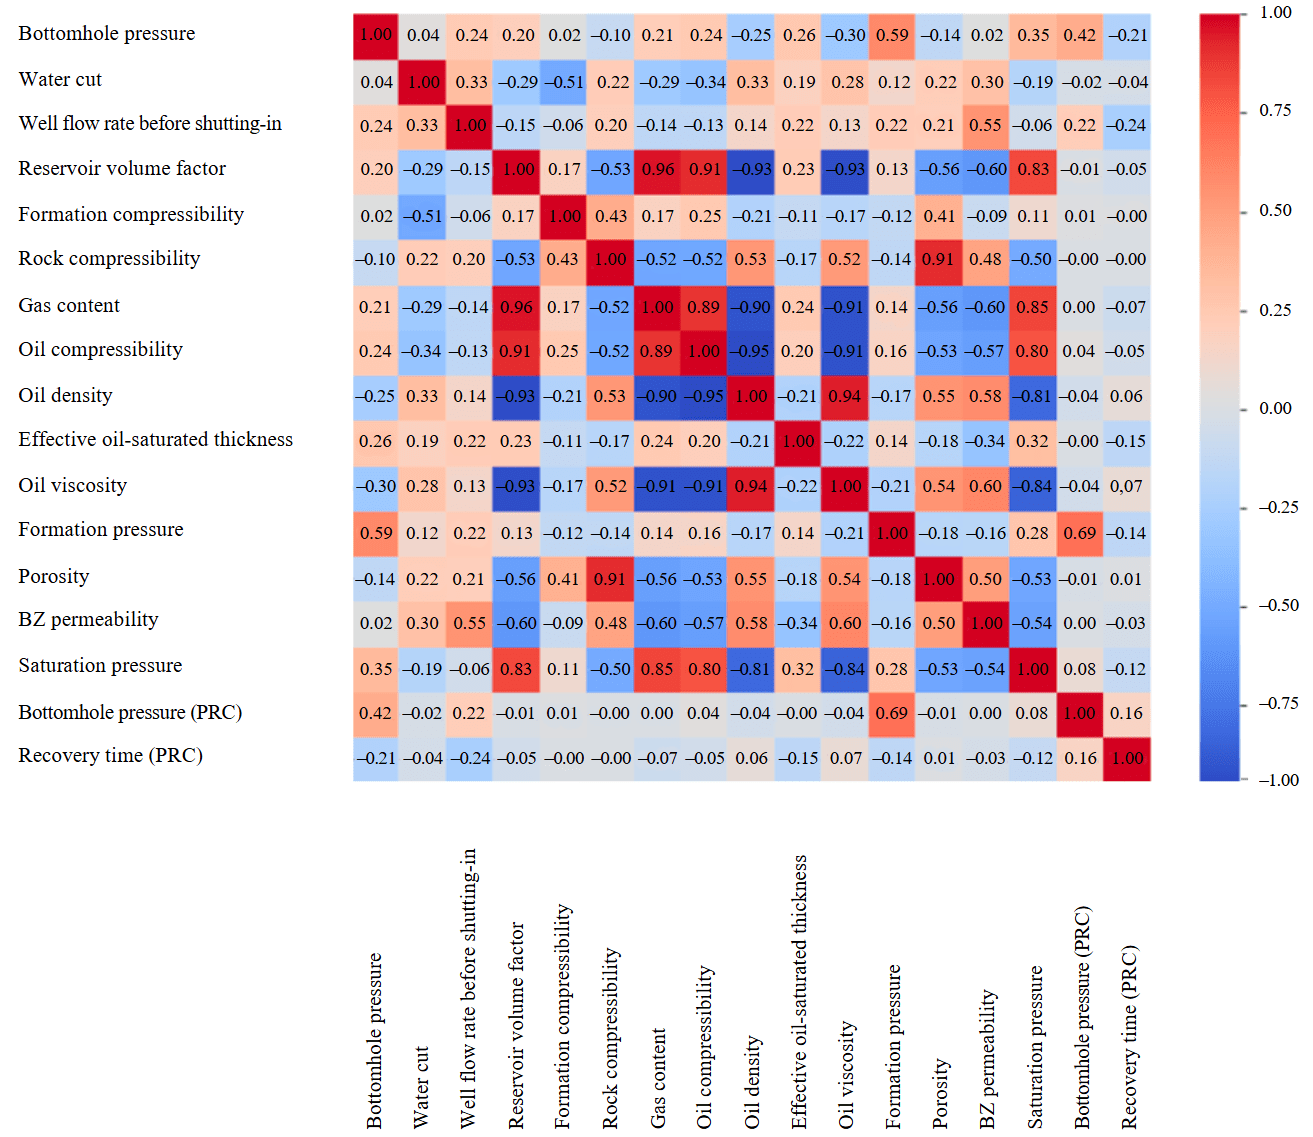
Fig.1. Spearman correlation matrix of the initial data
The proposed algorithm was applied to each PRC, sequentially forming a digital dataset. The predicted parameter is the bottomhole pressure at the recovery moment. The digital dataset was split into training set – 80 %, validation set – 10 %, and test set – 10 %. To equalize the contribution of features, MinMaxScaler scaling was used, which normalizes the data to the range from 0 to 1.
To tune and evaluate the models, statistical metrics were used – the coefficient of determination R2 and RMSE
where yi – actual value; yˆi – predicted value; n – number of observations; y¯i – mean value of actual data.
The procedure algorithm is built as follows:
- Collection of data of flow studies of the entire well stock for the retrospective period, including initial parameters (properties of the formation, oil, and operational parameters), dynamics of bottomhole pressure recovery, and interpretation data (formation pressure).
- Preparation, cleaning, and processing of data.
- Training models to perceive the pattern of bottomhole pressure recovery depending on input parameters.
- Obtaining a predictive simulated bottomhole pressure recovery curve for the current period based on a pre-trained model using retrospective flow studies conducted on wells and current field geological data.
- Interpretation of the simulated bottomhole pressure recovery curve and obtaining a predicted value of permeability of the remote formation zone.
Results and discussion
Training and comparison of R2 and RMSE metrics were performed, as shown in the table, both for individual machine learning models for predicting bottomhole pressure at the moment of recovery, and for an ensemble of the best models for the validation sample. Analysis of the convergence of predicted and actual values of the selected models shows that the best result was obtained using CatBoost – an open-source gradient boosting library based on decision trees.
Machine learning model quality metrics
|
Model |
R2 |
RMSE |
|
CatBoost |
0.997 |
0.176 |
|
Random Forest |
0.995 |
0.273 |
|
XGBoost |
0.988 |
0.406 |
|
Decision Tree |
0.987 |
0.432 |
|
MLP Neural Network |
0.983 |
0.498 |
|
Ensemble |
0.970 |
0.670 |
|
Gradient Boosting |
0.878 |
1.354 |
|
Linear Regression |
0.709 |
2.089 |
|
K-Nearest Neighbors |
0.331 |
3.171 |
|
SVR |
0.139 |
3.596 |
Figure 2, a shows the correlation field of predicted and actual values of bottomhole pressure at recovery moments. The linear correlation coefficient r between predicted and actual values for the test sample was 0.97, with RMSE of approximately 0.18. The simulated pressure recovery curve presented in Fig.2, b is close to the actual one, which demonstrates that machine learning models have the ability to train for solving the given task. It can be concluded that the application of these algorithms for estimating permeability of the remote formation zone through interpretation of simulated pressure recovery curves is promising.
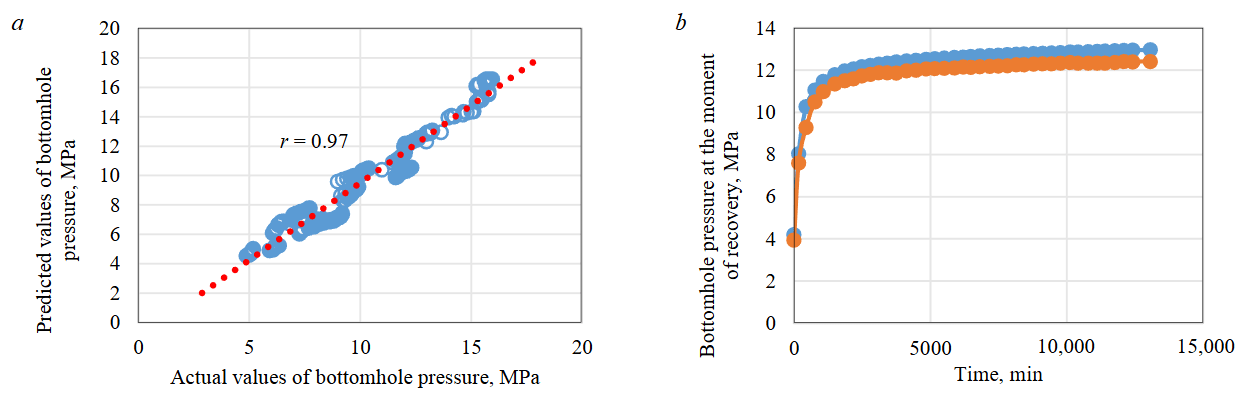
Fig.2. Scatter plot of predicted and actual pressure values at the moment of recovery (a); example of predicting the pressure recovery curve (b)
For a comprehensive study of the significance of initial parameters, gradient boosting was applied – a machine learning technique for classification and regression tasks that builds a prediction model in the form of an ensemble of weak predictive models, usually decision trees. The task was solved using the SHAP library and identifying the contribution of each feature to the final prediction of the target value – bottomhole pressure at the recovery moment. SHAP is a method based on the Shapley vector, which allows revealing the significance (measure of parameter influence on prediction result) of each feature. To determine the significance of a parameter, the model’s predictions are evaluated with and without the given feature.
Feature significances for predicting pressure recovery for the sample: formation pressure, MPa – 0.309; bottomhole pressure, MPa – 0.209; recovery time, min – 0.193; flow rate, m3/day – 0.053; water cut, % – 0.039; BZ permeability, μm2 – 0.024; well profile and development procedure – 0.024; gas content, m3/t – 0.024; effective oil-saturated thickness, m – 0.024; saturation pressure, MPa – 0.022; formation compressibility, (MPa·104)–1 – 0.016; porosity, % – 0.013; oil viscosity, mPa·s – 0.013; oil compressibility, (MPa·104)–1 – 0.011; rock compressibility, (MPa·104)–1 – 0.011; oil density, g/cm3 – 0.008; formation volume factor – 0.007. It is logical that formation pressure, bottomhole pressure, and recovery time have the greatest influence. However, an important feature is the impact of other parameters on pressure recovery in the well.
This approach was used for various durations of the study to investigate the nature of the pressure recovery process in the well. The time parameter was ranked from minimum to maximum values and divided into 10 sections to fully reflect the distribution of values and identify potential patterns. For each interval, a digital array was formed, and the SHAP library was used to assess the significance of parameters for pressure recovery in the well. Figure 3, a shows radar diagrams of the significance of initial parameters for different durations of recovery. The analysis shows that at the initial stage of pressure recovery, the formation compressibility parameter stands out. The flow rate influences all stages of recovery but shifts to later time intervals. The significance of gas content prevails at the initial stages of pressure recovery in the well. The significance of oil viscosity increases at high recovery time values. The significance of effective oil-saturated thickness is observed across all intervals of the PRC. An increase in the significance of water cut and rock compressibility is observed at high recovery duration values.
A similar analysis was conducted at various stages of the PRC recovery. For this purpose, an additional variable was introduced, representing the ratio of bottomhole pressure at a certain recovery interval to formation pressure. Fig.3, b shows radar diagrams of the significance of initial parameters for different recovery sites. The analysis shows that at the initial stage of pressure recovery, the formation compressibility parameter stands out. The flow rate influences mainly the initial and final periods of the PRC. The significance of the gas content parameter prevails at the initial stage of pressure recovery in the well. At the final stage of the PRC, the effective oil-saturated thickness parameter is significant.
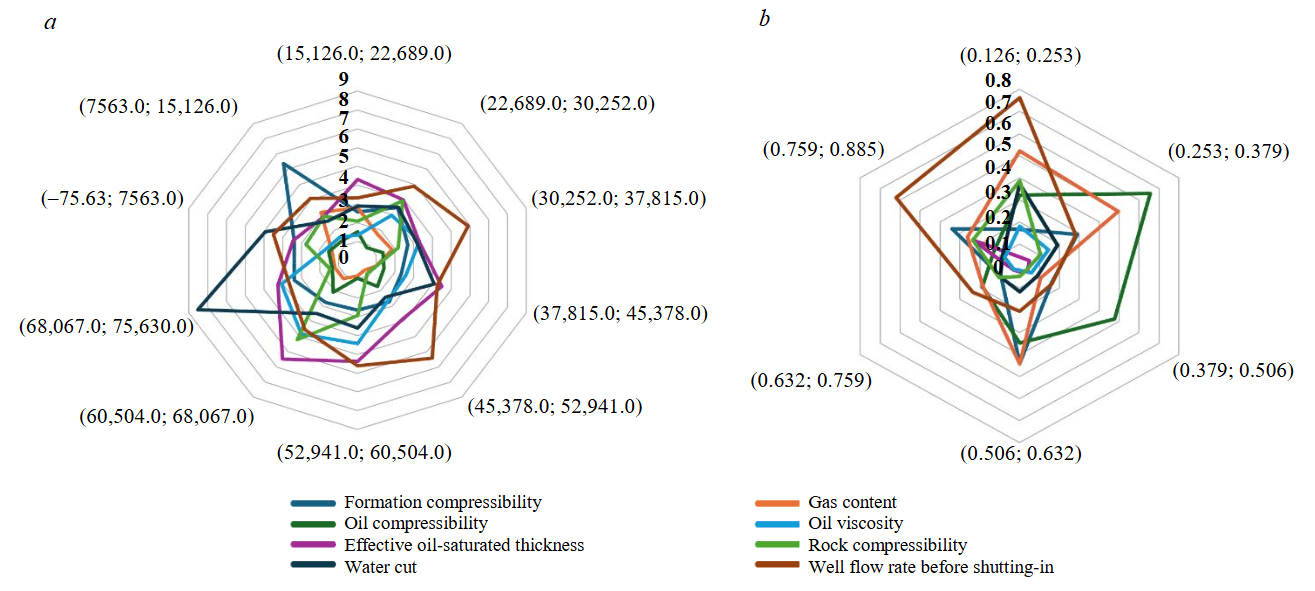
Fig.3. The significance of parameters for pressure recovery in the well at different time ranges (a) and at different recovery sites (b)
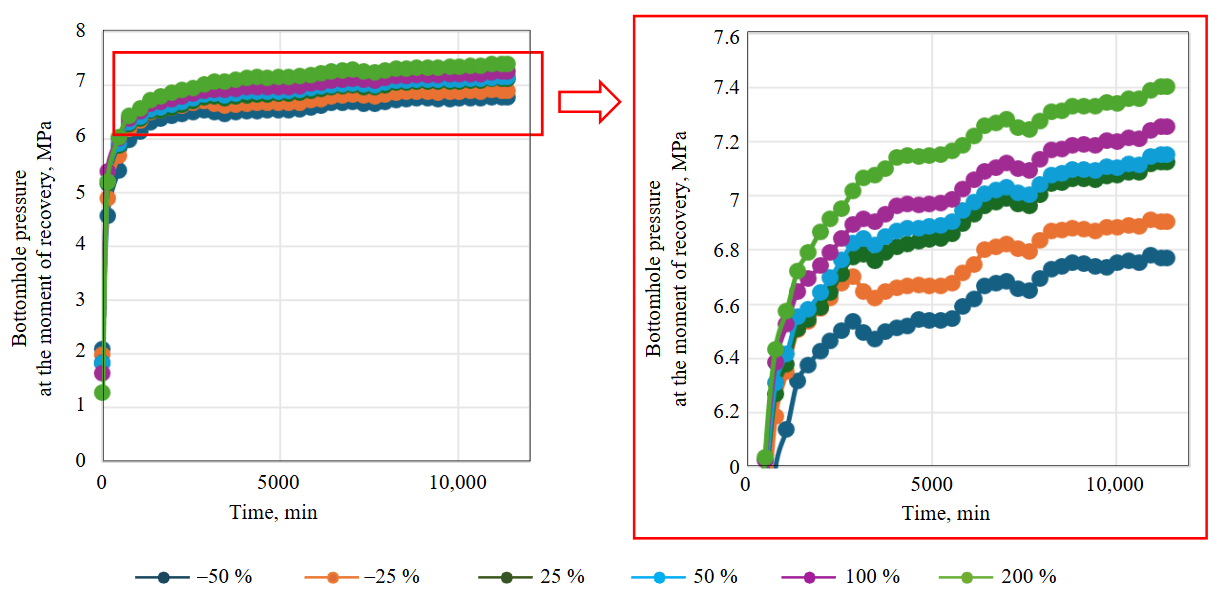
Fig.4. Analysis of the simulated pressure recovery curve sensitivity to changes in flow rate
The next stage of analysis is the assessment of pressure recovery curve sensitivity to changes in initial parameters. Each initial parameter was varied sequentially from –50 to +200 % without changing the others, and based on this data, actual and predicted pressure recovery curves were constructed. It was found that the model trains and is sensitive to changes in each of the analysed parameters. The most important feature is the flow rate, and Fig.4 presents the analysis of bottomhole pressure recovery sensitivity to this parameter. Figure 4 shows that the model is trainable and the dynamics of pressure recovery responds to changes in flow rate.
The next step involved comparing the results of interpreting actual (not used in training) and simulated pressure recovery curves, as shown in Fig.5, which demonstrated high convergence of results (r is 0.95). This approach is promising for predicting filtration parameters of the remote formation zone and eliminates uncertainties associated with the peculiarities of flow studies interpretation.
Figure 6 shows the prediction of formation pressure in the Data Stream Analytics modular service for the retrospective (red line) and prospective (one year, purple line) periods. Thus, it is possible to simulate pressure recovery curves for a forecasted point in time to assess the permeability of the remote drainage zone of wells when the energy state of the formation changes.
Fig.5. Comparison of the results of interpretation of actual and simulated PRC
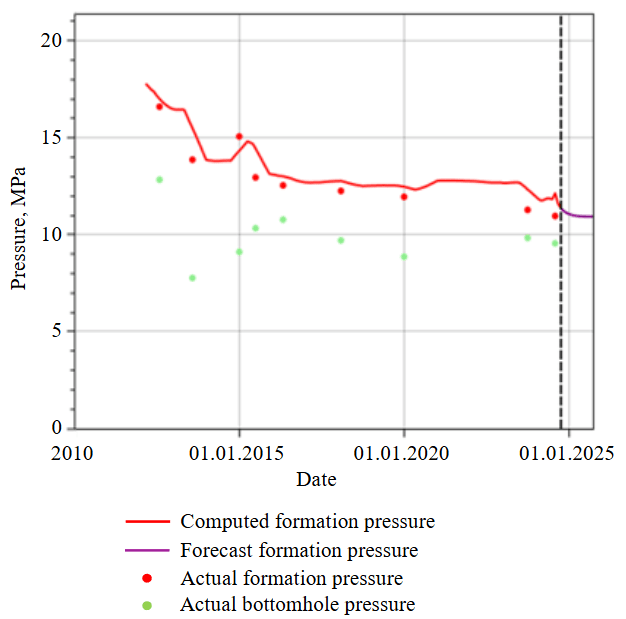
Fig.6. Forecasting formation pressure in the Data Stream
Analytics modular service
Figure 7 shows the actual pressure recovery curve (as of 01.08.2024 – green line), simulated PRC for the current state (01.12.2024 – blue line) and the prospective period (01.10.2025 – red line), and the results of their interpretation. The application of these algorithms can enable real-time monitoring of filtration parameters and assessment of the impact of formation pressure on formation permeability for the prospective period. The forecasted formation pressure value of 10.86 MPa for 01.10.2025, computed in the Data Stream Analytics modular service (Fig.6, purple line), was used as the predicted formation pressure.
The analysis of Fig.7 shows high convergence between the actual (dark green line) and simulated (light green line) pressure recovery curves as of 1 August 2024. The results of interpreting the actual and simulated bottomhole pressure recovery curves characterize the negative predictive dynamics of permeability in the remote formation zone (from 0.0462 to 0.0348 μm2), corresponding to a decrease in formation pressure (from 11.21 to 10.86 MPa).
The integration of machine learning methods and the use of real-time pressure recovery curves are promising for monitoring the development of hydrocarbon fields. These procedures will not only increase the accuracy of determining and predicting permeability but also reduce downtime associated with traditional well testing methods. The algorithms presented in this work will allow constructing dynamic maps of permeability distribution for the development target to identify filtration patterns and involve hydrocarbon reserves. As directions for future work, it is possible to note the expansion of the set of initial parameters and the generation of derivatives based on them, as well as the use of other algorithms for predicting PRC, including hybrid models.
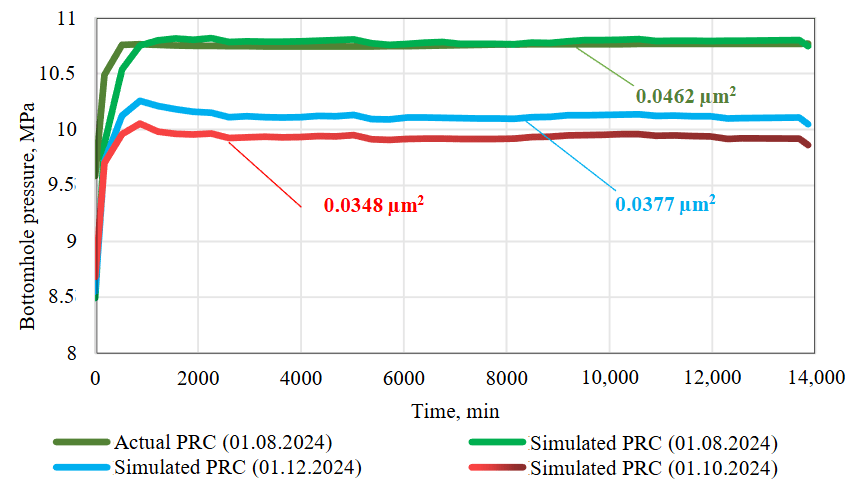
Fig.7. Simulated PRC in the period from 01.08.2024 to 01.10.2025 and the results of their interpretation
Conclusion
Permeability of formations and the state of the bottomhole zone are key parameters affecting the efficiency of oil and gas field development. This paper proposes an innovative approach for predicting bottomhole pressure recovery and simulating the pressure recovery curve based on machine learning methods (CatBoost).
The developed algorithm, based on well flow research data and geological and physical parameters, improves the accuracy of permeability assessment. The use of the SHAP library allowed identifying the significance of initial parameters at various stages of pressure recovery. Sensitivity analysis confirmed the models’ ability to account for parameter changes and their impact on the PRC.
The developed approach provided high convergence between predicted and actual pressure recovery curves, making it a promising tool for monitoring and optimizing field development. The linear correlation coefficient r between predicted and actual values for the bottomhole pressure recovery test sample was 0.97, with RMSE of approximately 0.18.
The high statistical metrics of the machine learning model, based on accumulated field geological data, demonstrate the ability to simulate PRC in real time and interpret them to assess changes in permeability of the remote formation zone simultaneously across the entire well stock. The linear correlation coefficient r between predicted and actual values when comparing the results of interpreting actual and simulated PRC is 0.95.
Permeability of the remote zone of the pay plays a key role in assessing the efficiency of oil production. The main method for determining it is well flow testing, which has significant limitations: incomplete coverage of the well stock, low measurement regularity, and the need to shut wells in.
The innovative approach proposed in the article provides for continuous assessment of filtration characteristics across the entire active well stock in real time. The developed method accelerates monitoring of the bottomhole zone state, ensuring timely identification of candidates for effective geotechnical interventions. The advantage of the algorithm is the use of conditioned measurements of bottomhole pressure at the recovery moment.
The algorithms are based on and validated using significant databases of well flow tests of clastic reservoirs from oil fields in the Perm Region. The described approach eliminates the peculiarities of the interpretation process and significantly speeds up the determination of filtration parameters, expanding coverage while ensuring timely and accurate model updates. This, in turn, will impact the improvement of forecasting processing and economic development indicators.
References
- Yazkov A.V., Kolbikov S.V., Shadchnev N.A. et al. Geological and Technological Challenges and Experience in Developing Hard-to-Recover Reserves. Georesources. 2024. Vol. 26. N 3, p. 7-12 (in Russian). DOI: 10.18599/grs.2024.3.1
- Indrupskiy I.M., Ibragimov I.I., Tsagan-Mandzhiev T.N. et al. Laboratory, numerical and field assessment of the effective-ness of cyclic geo-mechanical treatment on a tournaisian carbonate reservoir. Journal of Mining Institute. 2023. Vol. 262, p. 581-593. DOI: 10.31897/PMI.2023.5
- Kanin E., Garipova A., Boronin S. et al. Combined mechanistic and machine learning method for construction of oil reservoir permeability map consistent with well test measurements. Petroleum Research. 2025. Vol. 10. Iss. 2, p. 247-265. DOI: 10.1016/j.ptlrs.2024.09.001
- Byrne M.T., McPhee C.A. The Extinction of Skin. SPE International Symposium and Exhibition on Formation Damage Control, 15-17 February 2012, Lafayette, LA, USA. OnePetro, 2012. N SPE-151807-MS. DOI: 10.2118/151807-MS
- Al-Obaidi S.H., Khalaf F.H., Alwan H.H. Performance Analysis of Hydrocarbon Wells Based on the Skin Zone. Technium. 2021. Vol. 3. Iss. 4, p. 50-56.
- Belhouchet H.E., Benzagouta M.S., Dobbi A. et al. A new empirical model for enhancing well log permeability prediction, using nonlinear regression method: Case study from Hassi-Berkine oil field reservoir – Algeria. Journal of King Saud University – Engineering Sciences. 2021. Vol. 33. Iss. 2, p. 136-145. DOI: 10.1016/j.jksues.2020.04.008
- Xidong Wang, Shaochun Yang, Ya Wang et al. Improved permeability prediction based on the feature engineering of petrophysics and fuzzy logic analysis in low porosity–permeability reservoir. Journal of Petroleum Exploration and Production Tech-nology. 2019. Vol. 9. Iss. 2, p. 869-887. DOI: 10.1007/s13202-018-0556-y
- Mirzaei-Paiaman A., Asadolahpour S.R., Saboorian-Jooybari H. et al. A new framework for selection of representative samples for special core analysis. Petroleum Research. 2020. Vol. 5. Iss. 3, p. 210-226. DOI: 10.1016/j.ptlrs.2020.06.003
- Mirzaei-Paiaman A., Saboorian-Jooybari H., Pourafshary P. Improved Method to Identify Hydraulic Flow Units for Reser-voir Characterization. Energy Technology. 2015. Vol. 3. Iss. 7, p. 726-733. DOI: 10.1002/ente.201500010
- Kochegurov A.I., Denisov V.I., Zadorozhnykh E.A. Analysis of applying machine learning methods in rock classification problems on core samples. Bulletin of the Tomsk Polytechnic University. Geo Assets Engineering. 2024. Vol. 335. N 9, p. 148-159. DOI: 10.18799/24131830/2024/9/4792
- Soromotin A.V., Martyushev D.A., Pereira J.L.J. On the application of machine learning algorithms in predicting the permea-bility of oil reservoirs. Artificial Intelligence in Geosciences. 2025. Vol. 6. Iss. 2. N 100126. DOI: 10.1016/j.aiig.2025.100126
- Bennis M., Torres-Verdín C. Automatic Multiwell Assessment of Flow-Related Petrophysical Properties of Tight-Gas Sandstones Based on the Physics of Mud-Filtrate Invasion. SPE Reservoir Evaluation & Engineering. 2023. Vol. 26. Iss. 3, p. 543-564. DOI: 10.2118/214668-PA
- Ishola O., Vilcáez J. Machine learning modeling of permeability in 3D heterogeneous porous media using a novel stochastic pore-scale simulation approach. Fuel. 2022. Vol. 321. N 124044. DOI: 10.1016/j.fuel.2022.124044
- Singh M., Makarychev G., Mustapha H. et al. Machine Learning Assisted Petrophysical Logs Quality Control, Editing and Reconstruction. Abu Dhabi International Petroleum Exhibition & Conference, 9-12 November 2020, Abu Dhabi, UAE. OnePetro, 2020. N SPE-202977-MS. DOI: 10.2118/202977-MS
- Qing Kang, Kai-Qi Li, Jin-Long Fu, Yong Liu. Hybrid LBM and machine learning algorithms for permeability prediction of porous media: A comparative study. Computers and Geotechnics. 2024. Vol. 168. N 106163. DOI: 10.1016/j.compgeo.2024.106163
- Jirjees A.Y., Abdulaziz A.M. Influences of uncertainty in well log petrophysics and fluid properties on well test interpreta-tion: An application in West Al Qurna Oil Field, South Iraq. Egyptian Journal of Petroleum. 2019. Vol. 28. Iss. 4, p. 383-392. DOI: 10.1016/j.ejpe.2019.08.005
- Martyushev D.A., Slushkina A.Yu. Assessment of informative value in determination of reservoir filtration parameters based on interpretation of pressure stabilization curves. Bulletin of the Tomsk Polytechnic University. Geo Аssets Engineering. 2019. Vol. 330. N 10, p. 26-32 (in Russian). DOI: 10.18799/24131830/2019/10/2295
- Kaleem W., Tewari S., Fogat M., Martyushev D.A. A hybrid machine learning approach based study of production forecasting and factors influencing the multiphase flow through surface chokes. Petroleum. 2024. Vol. 10. Iss. 2, p. 354-371. DOI: 10.1016/j.petlm.2023.06.001
- Yudin V.A., Volpin S.G., Efimova N.P., Afanaskin I.V. Some features of pressure stabilization curve in the well located in the fault’s dynamic influence zone. Oilfield engineering. 2020. N 12 (624), p. 15-22 (in Russian). DOI: 10.30713/0207-2351-2020-12(624)-15-22
- Zhiping Chen, Jia Zhang, Daren Zhang et al. Enhanced permeability prediction in porous media using particle swarm optimization with multi-source integration. Artificial Intelligence in Geosciences. 2024. Vol. 5. N 100090. DOI: 10.1016/j.aiig.2024.100090
- Zhuoheng Chen, Hannigan P. A shale gas resource potential assessment of Devonian Horn River strata using a well-performance method. Canadian Journal of Earth Sciences. 2016. Vol. 53. N 2, p. 156-167. DOI: 10.1139/cjes-2015-0094
- Muslimov R.Kh. History and prospects of hydrodynamic methods for oil fields development in Russia. Oil Industry Journal. 2020. N 12, p. 96-100 (in Russian). DOI: 10.24887/0028-2448-2020-12-96-100
- Piskunov S.A., Davoodi Sh. Horizontal well flow rate prediction applying machine-learning model. Bulletin of the Tomsk Polytechnic University. Geo Assets Engineering. 2024. Vol. 335. N 5, p. 118-130 (in Russian). DOI: 10.18799/24131830/2024/5/4553
- Ben-Awuah J., Padmanabhan E. An enhanced approach to predict permeability in reservoir sandstones using artificial neural networks (ANN). Arabian Journal of Geosciences. 2017. Vol. 10. Iss. 7. N 173. DOI: 10.1007/s12517-017-2955-7
- Elkatatny S., Mahmoud M., Tariq Z., Abdulraheem A. New insights into the prediction of heterogeneous carbonate reservoir permeability from well logs using artificial intelligence network. Neural Computing and Applications. 2018. Vol. 30. Iss. 9, p. 2673-2683. DOI: 10.1007/s00521-017-2850-x
- Irani R., Nasimi R. Evolving neural network using real coded genetic algorithm for permeability estimation of the reservoir. Expert Systems with Applications. 2011. Vol. 38. Iss. 8, p. 9862-9866. DOI: 10.1016/j.eswa.2011.02.046
- Bagheripour P. Committee neural network model for rock permeability prediction. Journal of Applied Geophysics. 2014. Vol. 104, p. 142-148. DOI: 10.1016/j.jappgeo.2014.03.001
- Matinkia M., Hashami R., Mehrad M. et al. Prediction of permeability from well logs using a new hybrid machine learning algorithm. Petroleum. 2023. Vol. 9. Iss. 1, p. 108-123. DOI: 10.1016/j.petlm.2022.03.003
- Xiaobo Zhao, Xiaojun Chen, Qiao Huang et al. Logging-data-driven permeability prediction in low-permeable sandstones based on machine learning with pattern visualization: A case study in Wenchang A Sag, Pearl River Mouth Basin. Journal of Petroleum Science and Engineering. 2022. Vol. 214. N 110517. DOI: 10.1016/j.petrol.2022.110517
- Jing-Jing Liu, Jian-Chao Liu. Permeability Predictions for Tight Sandstone Reservoir Using Explainable Machine Learning and Particle Swarm Optimization. Geofluids. 2022. Vol. 2022. N 2263329. DOI: 10.1155/2022/2263329
- Tahmasebi P., Hezarkhani A. A fast and independent architecture of artificial neural network for permeability prediction. Journal of Petroleum Science and Engineering. 2012. Vol. 86-87, p. 118-126. DOI: 10.1016/j.petrol.2012.03.019
- Kumar A., Lin Liang, Ojha K. Simultaneous inversion of permeability, skin and boundary from pressure transient test data in three-dimensional single well reservoir model. Petroleum Research. 2024. Vol. 9. Iss. 2, p. 265-272. DOI: 10.1016/j.ptlrs.2024.01.004
- Aïfa T., Baouche R., Baddari K. Neuro-fuzzy system to predict permeability and porosity from well log data: A case study of Hassi R’Mel gas field, Algeria. Journal of Petroleum Science and Engineering. 2014. Vol. 123, p. 217-229. DOI: 10.1016/j.petrol.2014.09.019
- Chaves G.S., Ferreira Filho V.J.M. Enhancing production monitoring: A back allocation methodology to estimate well flow rates and assist well test scheduling. Petroleum Research. 2024. Vol. 9. Iss. 3, p. 369-379. DOI: 10.1016/j.ptlrs.2024.03.008
- El-Sebakhy E.A., Asparouhov O., Abdulraheem A.A. et al. Functional networks as a new data mining predictive paradigm to predict permeability in a carbonate reservoir. Expert Systems with Applications. 2012. Vol. 39. Iss. 12, p. 10359-10375. DOI: 10.1016/j.eswa.2012.01.157
- Gholami R., Moradzadeh A., Maleki S. et al. Applications of artificial intelligence methods in prediction of permeability in hydrocarbon reservoirs. Journal of Petroleum Science and Engineering. 2014. Vol. 122, p. 643-656. DOI: 10.1016/j.petrol.2014.09.007
- Yanji Wang, Hangyu Li, Jianchun Xu et al. Machine learning assisted relative permeability upscaling for uncertainty quan-tification. Energy. 2022. Vol. 245. N 123284. DOI: 10.1016/j.energy.2022.123284
- Guoyin Zhang, Zhizhang Wang, Huaji Li et al. Permeability prediction of isolated channel sands using machine learning. Journal of Applied Geophysics. 2018. Vol. 159, p. 605-615. DOI: 10.1016/j.jappgeo.2018.09.011
- Sheykhinasab A., Mohseni A.A., Bahari A.B. et al. Prediction of permeability of highly heterogeneous hydrocarbon reservoir from conventional petrophysical logs using optimized data-driven algorithms. Journal of Petroleum Exploration and Production Technology. 2023. Vol. 13. Iss. 2, p. 661-689. DOI: 10.1007/s13202-022-01593-z
- Campos D., Wayo D.D.K., De Santis R.B. et al. Evolutionary automated radial basis function neural network for multiphase flowing bottom-hole pressure prediction. Fuel. 2024. Vol. 377. N 132666. DOI: 10.1016/j.fuel.2024.132666
- Anifowose F., Labadin J., Abdulraheem A. Improving the prediction of petroleum reservoir characterization with a stacked generalization ensemble model of support vector machines. Applied Soft Computing. 2015. Vol. 26, p. 483-496. DOI: 10.1016/j.asoc.2014.10.017
- Anifowose F.A., Labadin J., Abdulraheem A. Ensemble model of non-linear feature selection-based Extreme Learning Machine for improved natural gas reservoir characterization. Journal of Natural Gas Science and Engineering. 2015. Vol. 26, p. 1561-1572. DOI: 10.1016/j.jngse.2015.02.012
- Otchere D.A., Ganat T.O.A., Gholami R., Lawal M. A novel custom ensemble learning model for an improved reservoir permeability and water saturation prediction. Journal of Natural Gas Science and Engineering. 2021. Vol. 91. N 103962. DOI: 10.1016/j.jngse.2021.103962
- Mkono C.N., Chuanbo Shen, Mulashani A.K., Nyangi P. An improved permeability estimation model using integrated ap-proach of hybrid machine learning technique and Shapley additive explanation. Journal of Rock Mechanics and Geotechnical Engi-neering. 2025. Vol. 17. Iss. 5, p. 2928-2942. DOI: 10.1016/j.jrmge.2024.09.013
- Shijia Ma, Jiangfeng Liu, Yuanjian Lin et al. Prediction of permeability of various geotechnical materials under different temperatures based on physical characteristics and machine learning. Fuel. 2025. Vol. 379. N 133109. DOI: 10.1016/j.fuel.2024.133109
- Riyadi Z.A., Olutoki J.O., Hermana M. et al. Machine learning prediction of permeability distribution in the X field Malay Basin using elastic properties. Results in Engineering. 2024. Vol. 24. N 103421. DOI: 10.1016/j.rineng.2024.103421
- Masroor M., Niri M.E., Sharifinasab M.H. A multiple-input deep residual convolutional neural network for reservoir perme-ability prediction. Geoenergy Science and Engineering. 2023. Vol. 222. N 211420. DOI: 10.1016/j.geoen.2023.211420
- Lawal A., Yingjie Yang, Hongmei He, Baisa N.L. Machine Learning in Oil and Gas Exploration: A Review. IEEE Access. 2024. Vol. 12, p. 19035-19058. DOI: 10.1109/ACCESS.2023.3349216
- Zakharov L.А., Martyushev D.А., Ponomareva I.N. Predicting dynamic formation pressure using artificial intelligence methods. Journal of Mining Institute. 2022. Vol. 253, p. 23-32. DOI: 10.31897/PMI.2022.11