New approaches to mineral quality variability evaluation using big data for operational control of ore flows in mining operations
- 1 — Ph.D. Researcher Institute of Comprehensive Exploitation of Mineral Resources RAS ▪ Orcid
- 2 — Ph.D. Head of Laboratory Institute of Comprehensive Exploitation of Mineral Resources RAS ▪ Orcid
- 3 — Senior Specialist Piklema LLC ▪ Orcid
Abstract
This article examines the problem of managing ore flow quality at mining enterprises from the perspective of applying big data to improve the efficiency of mineral quality management. It is noted that assessing the feasibility of collecting and processing big data for ore flow quality control requires an optimal quantifiable weight parameter, which determines the data collection discreteness and the effectiveness of their processing. Currently, this parameter is the ore (or concentrate) batch. A scientific-practical approach to determining batch sizes at mining enterprises is proposed, based not on business process conditions, but on the analysis of the distribution of quality parameters within the ore body, considering subsequent methods of mineral raw material transportation. An analysis was conducted on the data from every technological process within the mining technical system, leading to the establishment of principles for calculating the minimum required data samples for each stage of the process. The applicability of the Kotelnikov theorem (Nyquist – Shannon sampling theorem) for determining the optimal quantifiable weight parameter of a mineral raw material batch within quality control frameworks is considered. To obtain a qualitative model, the required scope of quarry operation statistics should range from 16 to 52 months of excavator operation at the face. This range depends on the value of the mineral quality distribution coefficient at the mining enterprise. It was also established that for building a qualitative model, the mentioned coefficient must be considered; the higher its value, the lower the sampling frequency should be when collecting data from technological processing stages.
The research was funded by the Russian Science Foundation grant (project N 22-17-00142).
Introduction
The management of ore flow quality is one of the key processes within a mining engineering system, determining its operational efficiency [1-3]. Consequently, justifying the frequency of data collection must be based on information regarding the qualitative and quantitative distribution of the mineral resource in the natural deposit, while also considering an analysis of data from the technological processes associated with the movement of mined rock from the point of natural rock mass breakage up to its transportation for processing [4, 5].
As of 2024, approximately 55 % of Russian IT companies have implemented big data analytics, while 31 % plan to do so. This signifies a shift in the perception of data, with its business value increasing notably, as new tools for data analysis create opportunities for optimizing business models. Leveraging big data on the rock mass, which reflects its qualitative characteristics, enables the justification of technological process parameters and the development of recommendations for the sampling and accounting of mineral raw material samples. This facilitates tracking quality parameters from the excavation stage through to the production of final concentrate during the beneficiation process [6, 7].
The mining industry has well-established and thoroughly detailed methods for the sampling and preparation of samples for chemical analysis and moisture determination (technical sampling) during the stages of mineral storage and beneficiation. For instance, GOST 14180-80 is an essential document governing the sampling of both ore and concentrate batches. The primary limitation of the conventional approach lies in the fact that the key calculable parameter used – the “batch” – lacks strict definition. The operative definition of a “batch” is typically the volume of ore or concentrate moved during a specific loading (or unloading) period, with its size being established by contractual agreement. This stems from the standard's reliance on GOST R 50779.10 and GOST R 50779.11, which define the system of concepts and terminology in the field of probability theory and mathematical statistics. Within these referenced standards, the batch size is implicitly treated as a predefined variable, derived from the operational conditions of the applied processes within the mining engineering system. Furthermore, regulatory documentation typically defines a “batch” as the quantity of product units required to meet demand over a specific period, or the quantity produced within a single production cycle, accounting for production, storage, and logistics costs. This definition underscores that the concept is intrinsically linked to the attributes of business processes.
However, such definitions are suitable for the production of uniform commodity units with consistent quality parameters. In contrast, in mining, the batch size is influenced by the qualitative and quantitative distribution of the mineral component within the rock mass, as well as the applied method and conditions of rock transportation. This necessitates the calculation of an optimal sampling frequency for quality data collection [8]. Currently, mining enterprises commonly employ contractual agreements to determine batch size, which directly dictates the sampling frequency. Typically, this frequency is aligned with hourly intervals within a shift, a practice driven by tracking convenience.
The objective of this work is to develop a scientifically grounded methodology for determining the minimum required size of a transported rock mass batch, aiming to establish the optimal amount of data for predicting the quality of the supplied raw material [9]. To achieve this goal, it is necessary to define:
- the minimum data dimensions and collection frequency capable of characterizing the technological processes involved in mineral extraction;
- the quantitative values for the volume of data to be collected from each technological process.
This stated scientific and practical task is paramount for formulating the requirements and objectives for the digitalization of the mining engineering system.
Methods
Typically, the following formula is used to determine the sampling interval
where M – mass of the sampled ore or concentrate batch, t; Q – throughput of the sampled stream, t/h; N – number of incremental samples,
V – coefficient of variation, %.
The formulas used in the standard demonstrate that the calculation of sampling frequency universally incorporates the mass characteristic of the sampled mineral raw material batch. Furthermore, the batch size depends on: the productivity of the mining and processing complex for ore delivery; the dispatch frequency of the batch constituent units (e.g., a truckload); the coefficient of variation of the mineral's quality; regulations for raw material blending, etc. The described methodology confirms that at mining enterprises, although regulations are developed based on the coefficient of variation of quality parameters, their implementation in practice is tied to hourly intervals within a shift due to contractual agreements.
Based on the classification of digital data sources in the mining engineering system by their object of acquisition, this study defines the rock mass from a «data» perspective and identifies the factors influencing it [4]. The qualitative indicators of the mineral raw material are associated with [10-12]:
- geological structure (the distribution of the raw material can depend on the deposit's structure, including the formation features and morphology of ore bodies, as well as folds, faults, and other elements);
- petrographic composition (the quality of the raw material can vary depending on the nature of the spatial relationships between rock-forming and accessory minerals, including the character of their alteration and intergrowths, which determines the recovery rates during beneficiation).
The distribution of mineral raw material quality within the rock mass can be represented by various models, such as a random distribution model (which posits that raw material quality is distributed randomly) and a zonal distribution model (where quality is distributed zonally, with distinct zones characterized by different mineral raw material qualities). When these distribution models are considered in conjunction with the technological features of rock mass extraction and transportation, the distribution of the valuable component over time can be conceptualized as an analog signal with a defined maximum amplitude. In the case of a zonal distribution, this amplitude becomes predictable [13].
The discretization of analog signals in electronics relies on the Kotelnikov theorem, known in Western literature as the Nyquist – Shannon sampling theorem. Formulated in the ХХ century, this theorem establishes that a continuous signal with a limited frequency spectrum can be perfectly reconstructed from its discrete samples provided the sampling rate is at least twice the highest frequency component of the signal. This implies that for transmitting such a signal through a communication channel, it suffices to send only instantaneous values (samples) at specific intervals rather than the complete continuous data set [14, 15]. In practical applications, recording devices capture a finite number of such measurements, resulting in discrete signal representations [16].
Mathematically, the Kotelnikov theorem can be expressed by the following formula:
where f (t) is the original continuous-time signal; f (nT) – discrete samples of the signal; T – sampling period; sinc(x) – normalized sinc function.
The Kotelnikov theorem can be applied to the data generated during the management of the mining engineering system. When transmitting a signal originating from any technological process stage (drilling and blasting, excavation and transportation, storage, and beneficiation of solid minerals), it is not necessary to collect and transmit the complete continuous dataset. Application of the Kotelnikov theorem demonstrates that transmission of instantaneous samples is sufficient for signal reconstruction.
The methodology for testing the Kotelnikov theorem employed synthetic data – a dynamically scalable object generated according to predefined patterns derived from a trained machine learning model. The model was trained on two months of real sensor data from automated systems, utilizing, in this specific instance, the k-means clustering algorithm.
The developed methodology comprises the following stages:
- generation of a statistical distribution simulating the distribution of qualitative indicators of the mineral resource within the rock mass;
- modeling of the processes associated with drilling and blasting operations, excavation, and transportation of rock mass (for open-pit mining);
- modeling of dump truck unloading onto a stockpile or into a bin;
- modeling of belt conveyor operation, including the functioning of a sample cutting and division machine.
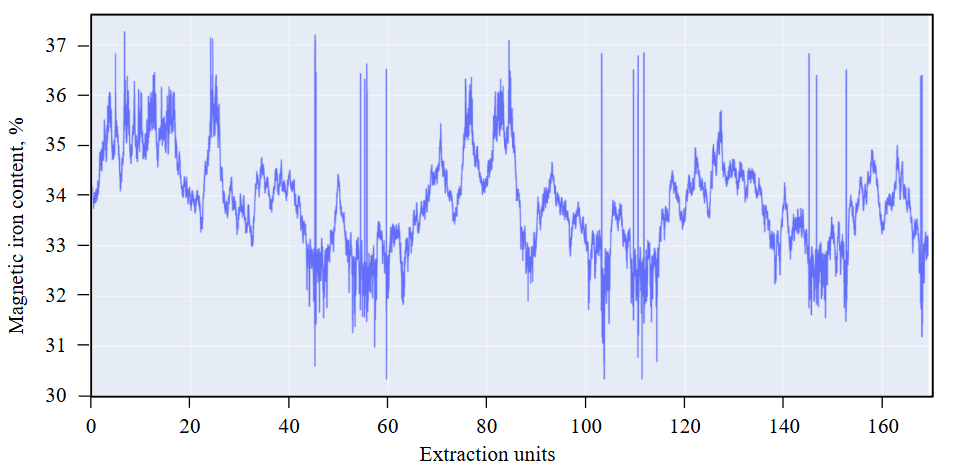
Fig.1. Initially generated distribution of qualitative characteristics within the rock mass volume
In accordance with the developed methodology, the research is directly linked to the physical processes of ore flow movement within the mining engineering system.
The following computational tools were employed for data array processing in this study: the NumPy library for signal analysis and processing, including filtration and Fourier transform operations; specifically, the library's fftfreq function was utilized, which returns the frequency array corresponding to the indices of the array obtained from the Fast Fourier Transform (FFT) [17].
The algorithm for generating the statistical distribution of mineral quality indicators within the rock mass was developed based on a reference dataset obtained from a dispatching automated system over a two-month period of operation at an iron ore enterprise conducting open-pit mining [18-20]. This resulted in a distribution (Fig.1) of the mineral quality indicators within the rock mass volume, representing 17 thousand excavator buckets [21, 22].
The resulting distribution was randomly assigned to the blast holes of extraction blocks according to the zonal distribution model [23]. This approach enabled the identification of multiple blocks with distinct quality characteristics, while maintaining consistent zoning within each block. In other words, within a single extraction block, closely spaced blast holes could not exhibit quality variations exceeding a step equivalent to 10 bucket loads (to the left or right), thereby conforming to the original distribution (Fig.1). This methodology successfully simulated a process where each loaded truck maintains a consistent quality parameter value in its payload during processes 1 and 2, as defined by the quality-aware ore delivery chain typical of mining enterprises (Fig.2) [24-27]. Processes 3 and 4 were simulated straightforwardly, as they are linear in nature, except for the blending stage. During this stage, the entire stockpiled volume undergoes mixing due to standard mining practices involving loading by front-end loaders or excavators [28, 29].
For data analysis, an experiment comprising several scenarios was conducted:
- The Kotelnikov theorem was applied to the initial distribution (Fig.1), where the extraction unit is an excavator bucket. This scenario assumes the technical feasibility of monitoring the flow quality at Stage 4 (Fig.2) with a sampling frequency corresponding to each dispatched bucket. In this setup, the blending process is disregarded, thereby simulating an ideal extraction and transportation process consisting of Stages 1, 2, and 4 (Fig.2).
- The Kotelnikov theorem was applied to the weighted average value of the initial distribution, with the blending volume set as one truckload. In this scenario, the truck's nominal capacity was conditionally set at 7 bucket loads, with blending performed over this volume. At Stage 4, the quality recording interval changes according to the blending volume – one truckload or a weighted average over 14 bucket loads. Similar to Scenario 1, the final configuration of this scenario comprises Stages 1, 2, and 4 (Fig.2).
- The Kotelnikov theorem was applied to the weighted average value of the initial distribution, with the blending volume set to 3 trucks or 42 bucket loads. This scenario simulates the unloading of trucks into a receiving hopper under a cyclic-flow transport scheme. The theorem is applied at Stage 4 during conveyor transport following the receiving hopper feeder (Fig.2).
- The Kotelnikov theorem was applied to the weighted average value of the initial distribution, with the blending volume defined by a transfer stockpile. In this scenario, the blending volume amounted to 10 trucks or 140 excavator buckets, simulating a small section of a transfer point. The theorem was applied similarly to the previous scenarios, with the recorded volume being a stockpile section, and the flow scheme comprises all four stages.
It should be noted that considering larger blending volumes in subsequent scenarios is unnecessary, as most modern mining enterprises operate automated dispatching systems capable of dividing large-volume stockpiles into sections, effectively creating quality-based zoning. Furthermore, the point for reconstructing the original distribution from its discrete samples is the belt conveyor, which carries fragmented mineral raw material delivered by trucks of a specific volume. The primary objective of all scenarios is to compare the initial quality distribution with the newly obtained distribution derived via the Kotelnikov theorem and to draw conclusions regarding the theorem's applicability under different conditions.
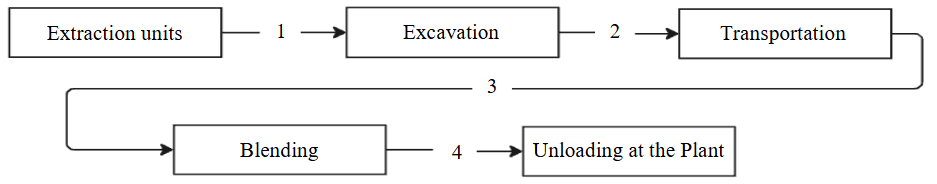
Fig.2. General simulated quality-aware ore delivery chain
Prior to the experiment, a decision was made to analyze the performance of the Kotelnikov theorem against variations in the distribution magnitude of the mineral within the rock mass. From the reference dataset obtained from an operating iron ore deposit, it was determined that the mineral quality distribution coefficient is 498 a.u. (spread = 498). Subsequently, based on this sample, initial distributions with spread = 1000 and 2000 were generated, simulating complex-structured, disturbed blocks. Thus, this part of the experiment was conducted without considering the rock mass delivery technology, and the Kotelnikov theorem was applied in its classical form – for reconstructing the original signal.
The Kolmogorov goodness-of-fit test was used as the metric to evaluate the conformity between the original distribution and the distribution obtained using the theorem. This method is widely used in practice as it is designed to test the hypothesis that a sample belongs to a specific distribution law, i.e., to assess the correspondence between an empirical distribution and a presumed model.
Results
Figure 3 shows the results of reconstructing the initial distribution according to the described methodology (Stage 1) for different initial quality distribution values – 498, 1000, and 2000.
The performance of the Kotelnikov theorem under ideal mining conditions is deemed acceptable, as the original distributions were reconstructed with sufficient accuracy; the corresponding evaluation metrics are presented in Table 1.
Interpreting the obtained results leads to an expected conclusion: the higher the initial spread value, the lower the sampling interval should be. For a spread of 498, the interval should be 104.95 s, meaning that for such a distribution, every 105th bucket must be sampled to achieve convergence, where the KS Statistic approaches zero and the P-value approaches one. For spreads of 1000 and 2000, it is necessary to sample every 43rd and 19th bucket, respectively.
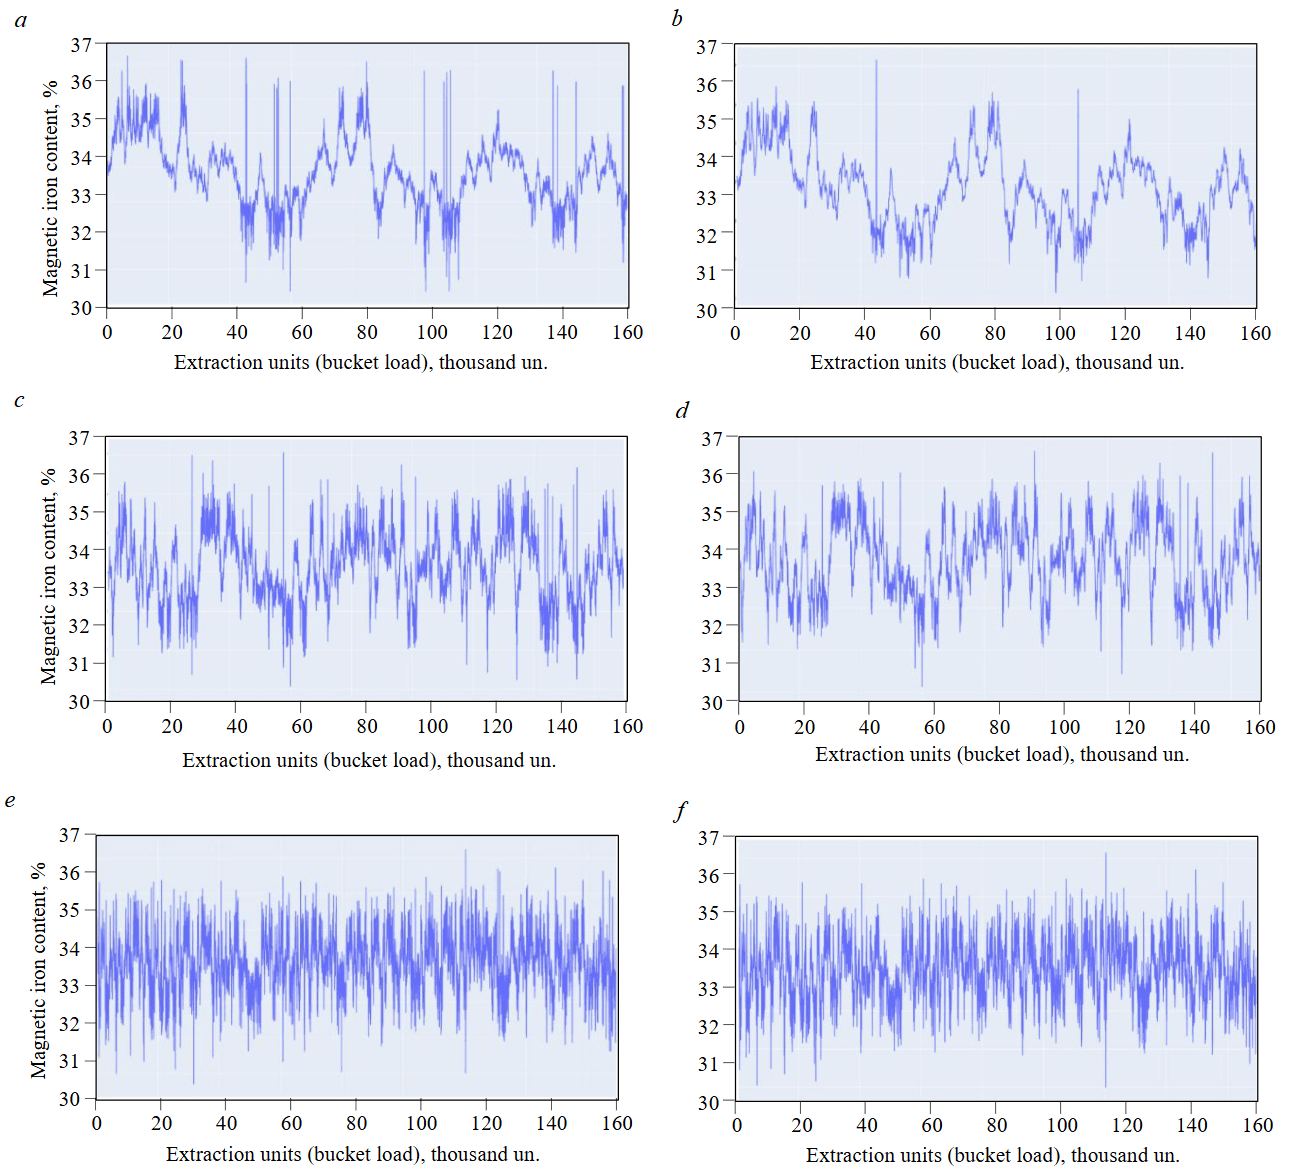
Fig.3. Original (a, c, e) and Kotelnikov theorem-reconstructed (b, d, f) distributions for spread = 498, 1000, and 2000
Table 1
Accuracy of distribution reconstruction via Kotelnikov theorem under different spread values
|
Distribution (spread) |
Kolmogorov – Smirnov test |
Sampling interval, s |
|
|
KS Statistic |
P-value |
||
|
498 |
0.0055 |
0.9999 |
104.950 |
|
1000 |
0.0076 |
0.9768 |
43.256 |
|
2000 |
0.0029 |
0.9999 |
19.329 |
However, the considered ideal scenario is unattainable in real production conditions due to numerous constraints and uncertainties. A key factor among these is the blending of the mineral material that occurs in truck beds and at transfer blending stockpiles. To assess the degree of influence of the blending volume on the performance of the Kotelnikov theorem, situations were modeled where rock mass transportation involves blending of the conveyed raw material in volumes equivalent to 1, 3, and 10 trucks (Fig.4).
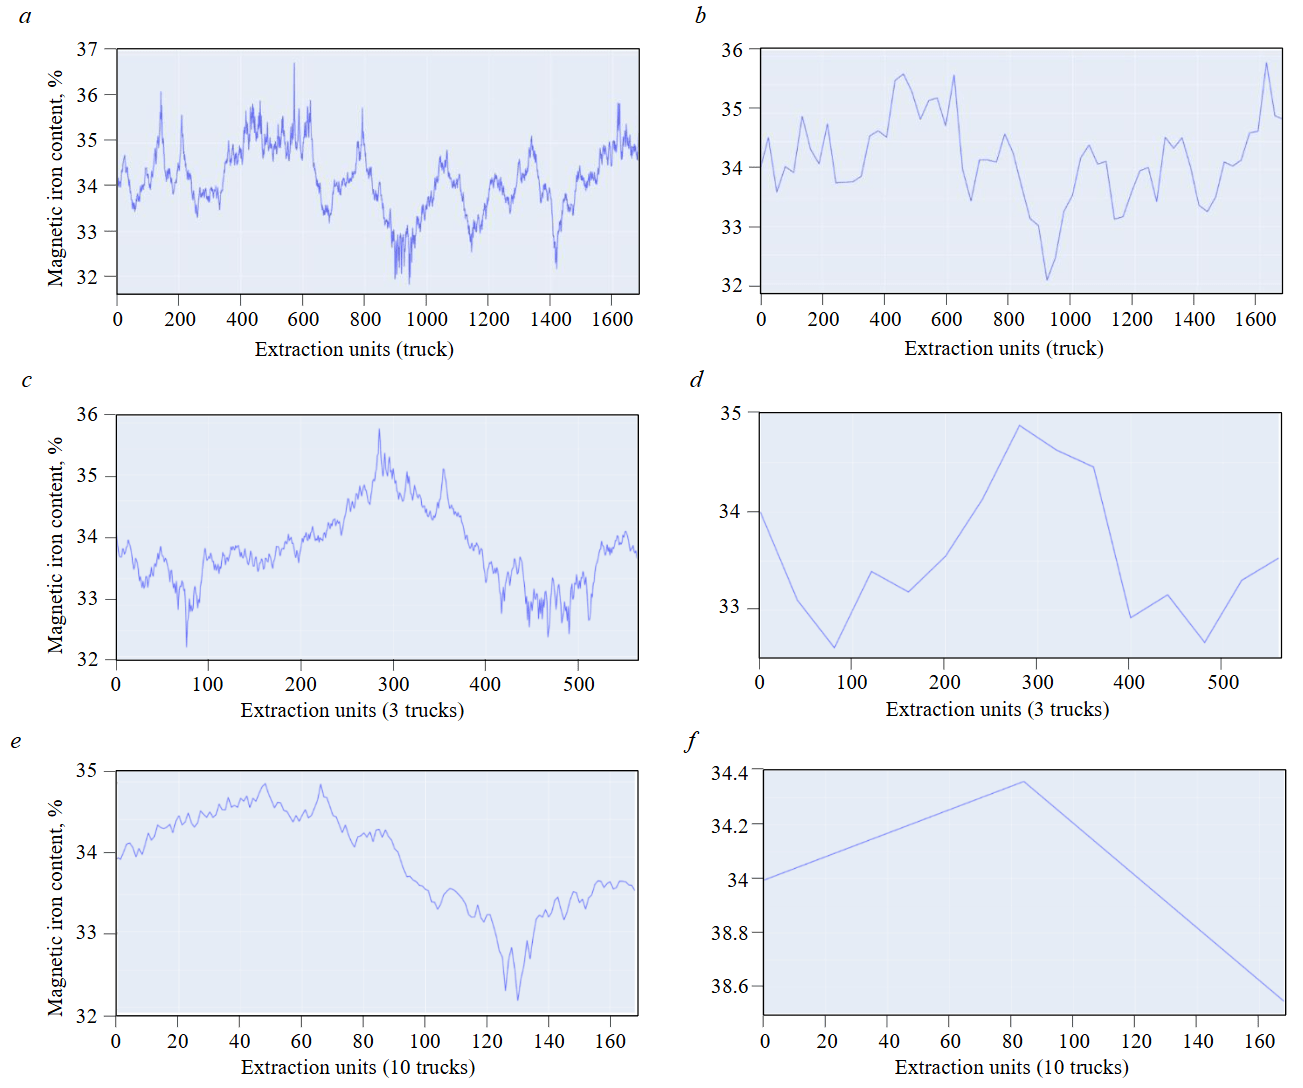
Fig.4. Original (a, c, e) and Kotelnikov theorem-reconstructed (b, d, f) distributions for blending volumes of 1, 3, and 10 trucks
Based on Fig.4, it can be concluded that the performance of the Kotelnikov theorem in reconstructing the original distribution deteriorates as the blending volume increases. For instance, in the case of blending at the transfer point (Fig.4, e, f), the theorem only identifies the general trend [29]. Reconstructing the original distribution requires a more substantial sample size, as indicated by Table 2.
Table 2
Accuracy of distribution reconstruction via Kotelnikov theorem under different blending scenarios
|
Blending volume |
Kolmogorov – Smirnov test |
Sampling interval, s |
|
|
KS Statistic |
P-value |
||
|
1 truck |
0.0697 |
0.9092 |
27.323 |
|
3 trucks |
0.1383 |
0.9064 |
40.286 |
|
10 trucks |
0.3669 |
0.6945 |
84.500 |
A comparison presented in Table 2 demonstrates that for cases involving a fixed volume (e.g., a block or stope), the Kotelnikov theorem cannot be universally applied across all blending volumes. This limitation is most evident with the 10-truckload blending scenario, where the fidelity of the original distribution reconstruction is notably low [6].
The obtained results indicate that applying the Kotelnikov theorem without a thorough assessment of the mineral resource base quality is impractical. Training models and constructing high-quality forecasts for extracted raw material quality requires a substantial volume of statistical data, which must be collected from the mining engineering system through the implementation of digital solutions [30, 31]. Modern IT tools for data archiving and rapid retrieval significantly reduce the requirements for data storage media, thereby lowering the cost of maintaining large information volumes for subsequent analysis.
A series of comparative experiments was performed to assess how mineral characteristics influence the requisite data volume. These experiments demonstrate how the spread parameter affects the sampling interval and what data volume needs to be collected to achieve a specific KS Statistic under different blending schemes. For this experiment, a KS Statistic value of 0.07 was selected as indicative of a highly variable distribution (see Fig.3). It should be noted that the target KS Statistic can be set to any value and is contingent upon the specific conditions and requirements of the mining enterprise. For instance, this metric is influenced to varying degrees by factors such as: truck payload capacity and fleet size, the productivity of the mining complex, the method of mineral raw material delivery, the distribution of minerals within the rock mass, the structure of extraction blocks, and the processing flowsheet of the beneficiation plant, among others. Figure 5 illustrates the variation in sampling frequency as a function of the changing spread parameter.
Figure 5 demonstrates an inverse relationship between the spread parameter and the required sampling frequency, with frequency stabilizing into a plateau beyond the threshold of spread = 1700. This plateau indicates that at high spread values, the informational contribution of each subsequent data point diminishes. The resulting lower sampling rate produces a trend line that is less sensitive to local variations.
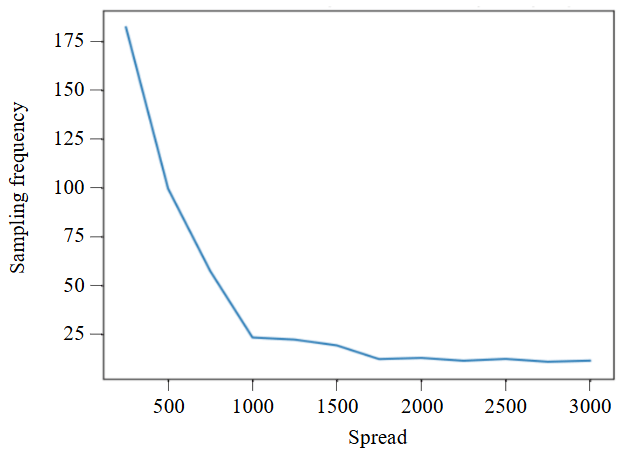
Fig.5. Dependence of sampling frequency on the spread parameter
To determine the data volume required to achieve a KS Statistic of 0.07 under different blending schemes, graphical analyses were constructed for blending volumes of 10 and 100 trucks. This substantial difference in scale was selected to clearly demonstrate the influence of the blending volume on the requisite size of the initial dataset.
Figure 6 demonstrates that, despite substantial blending volumes, a requisite minimum volume of initial data can always be identified for model training. Specifically, to achieve a KS Statistic of 0.07 with a blending volume of 10 trucks requires 50,820 excavator buckets, while a volume of 100 trucks necessitates 203,280 buckets. This is equivalent to 4.5 and 18 months of enterprise operation (based on a single excavator's workload) for each quarry section type, characterized by the specific quality distribution within the rock mass.
However, it is important to note that the numerical values obtained are valid only for the initial sample presented in Fig.6. Any modification of the source data could fundamentally alter the relationships illustrated in Fig.7.
To develop a high-fidelity model based on the Kotelnikov theorem for a rock mass delivery chain involving, for instance, a blending volume of 100 trucks, the required operational statistics range from 0.17 to 0.6 million bucket loads, equivalent to 16 to 52 months of continuous excavator operation [32-34]. This considerable variation is primarily governed by the value of the mineral's quality distribution coefficient.
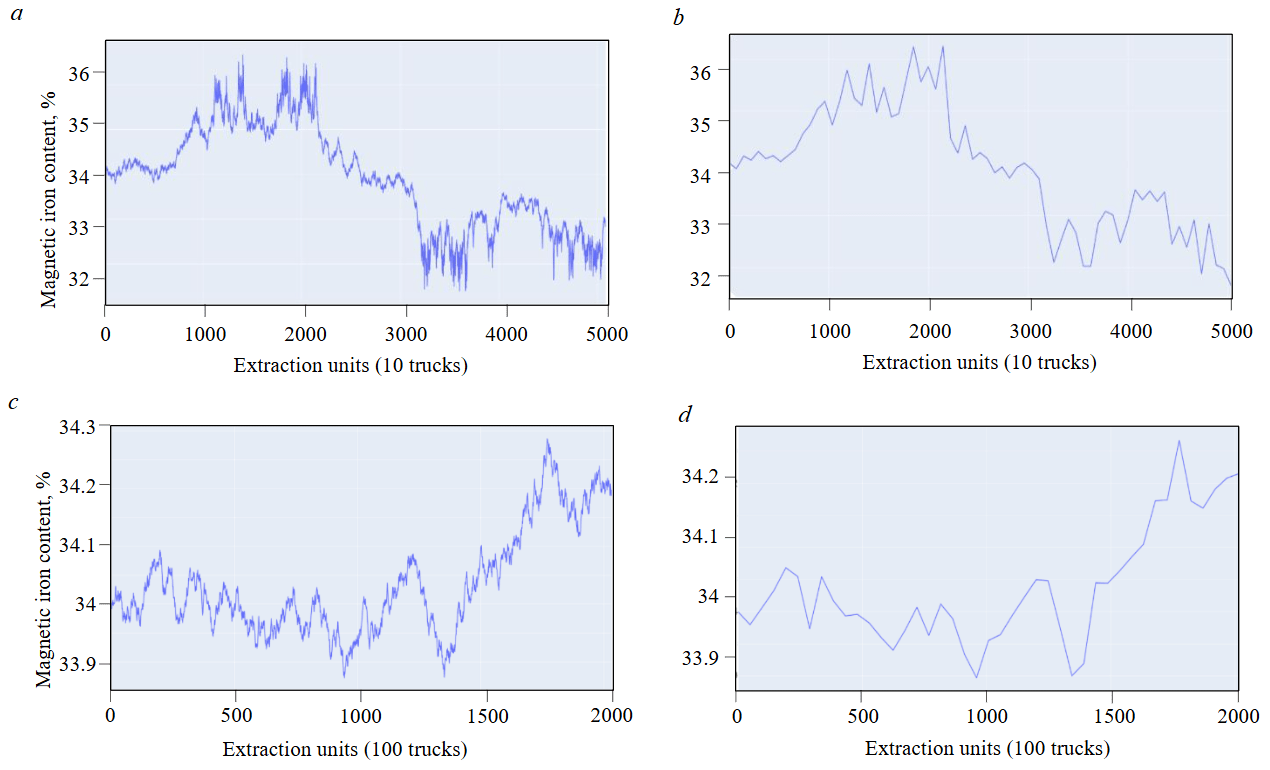
Fig.6. Original (a, c) and Kotelnikov theorem-reconstructed (b, d) distributions for blending volumes of 10 and 100 trucks at KS Statistic = 0.07
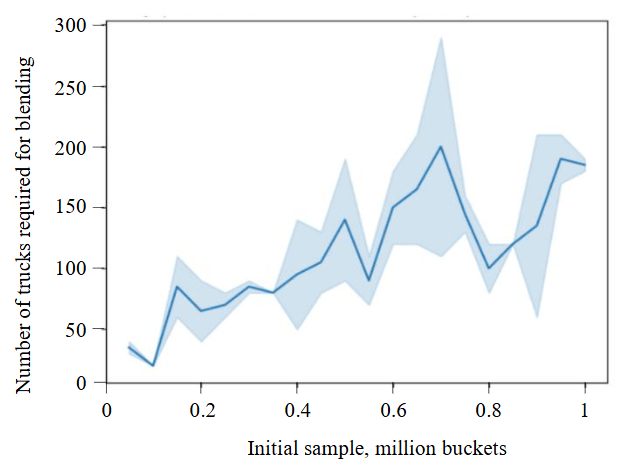
Fig.7. Blending volume versus initial sample size at a target KS Statistic of 0.07
Conclusion
Based on the conducted research following the outlined methodology, it has been established that the Kotelnikov theorem can be applied to determine the minimum batch size of transported mineral raw material, taking into account the productivity of technological equipment – specifically, the sampling frequency for recording quality parameters during rock mass transportation. Another significant outcome of applying the Kotelnikov theorem is the justification of the minimum required data volume necessary to describe each technological process within the mining engineering system. This information allows for the unambiguous determination of the requisite data collection frequency for various processes during the implementation of automation systems.
It was determined that the minimum data volume and the frequency of their recording and blending depend on the quality distribution of the mineral raw material in the original natural deposit, the structural features of the blocks, and the requirements set for the final product.
Data recording and collection must be performed for each technological process according to the rate of change of the structural properties of the mineral raw material within its boundaries. For instance, for the rock mass storage stage, quality and quantity indicators should be recorded at the moment of shipment or when the stockpile is being filled.
References
- Kaplunov D.R. Theory basis of designing of subsoil mastering: formation and development. Gornyi zhurnal. 2014. N 7, p. 49-51 (in Russian).
- Turtygina N.A., Miroshnikova L.K., Volkov N.A., Karpenko I.O. The prospective forecasting method and research Norilsk deposits formed in order to control the quality of the extracted ores. Mining Informational and Analytical Bulletin. 2016. N 2, p. 313-319 (in Russian).
- Kaplunov D.R., Rylnikova M.V., Yun A.B., Terenteva I.V. A new technological policy for integrated subsoil development in the conditions of depleting mineral reserves and resources. Gornyi zhurnal. 2019. N 4, p. 11-14 (in Russian). DOI: 10.17580/gzh.2019.04.02
- Barnewold L., Lottermoser B.G. Identification of digital technologies and digitalisation trends in the mining industry. International Journal of Mining Science and Technology. 2020. Vol. 30. Iss. 6, p. 747-757. DOI: 10.1016/j.ijmst.2020.07.003
- Rylnikova M.V., Vladimirov D.Ya., Pytalev I.A., Popova T.M. Robotic Geotechnologies as Way of Improving Efficiency and Ecologization of Mineral Resource Management. Journal of Mining Science. 2017. Vol. 53. N 1, p. 84-91. DOI: 10.1134/S1062739117011884
- Zakharov V.N., Kaplunov D.R., Klebanov D.A., Radchenko D.N. Methodical approaches to standardization of data acquisition, storage and analysis in management of geotechnical systems. Gornyi zhurnal. 2022. N 12, p. 55-61 (in Russian). DOI: 10.17580/gzh.2022.12.10
- Lomonosov G.G. Improving the quality of products of the mining production as a factor in increasing the effectiveness of the Russian mining and processing complex. Mineral Mining & Concervation. 2015. N 2, p. 51-61 (in Russian).
- Sony M., Antony J., Douglas J.A. Essential ingredients for the implementation of Quality 4.0: A narrative review of literature and future directions for research. The TQM Journal. 2020. Vol. 32. Iss. 4, p. 779-793. DOI: 10.1108/TQM-12-2019-0275
- Zhang Qi, Jiao ShouTao, Lu XinXiang. Discussion on causality and correlation in geological research. Acta Petrologica Sinica. 2018. Vol. 34. N 2, p. 275-280.
- Turtygina N.A., Okhrimenko A.V., Kovalchuk A.A., Kalashnikov K.A. Planning of mining works as organizational method of quality management for mineral raw materials in mining system. Mining Informational and Analytical Bulletin. 2018. Special Issue 17, p. 3-11 (in Russian). DOI: 10.25018/0236-1493-2018-5-17-3-11
- Kantemirov V.D., Yakovlev A.M., Titov R.S., Timokhin A.V. Improvement of Mineral Processing Methods in Mining Structurally-Complex Deposits. Russian Mining Industry. 2022. N 1S, p. 63-70 (in Russian). DOI: 10.30686/1609-9192-2022-1S-63-70
- Ruihan Zhao, Liang Luo, Pengzhong Li, Jinguang Wang. An industrial heterogeneous data based quality management KPI visualization system for product quality control. Assembly Automation. 2022. Vol. 42. Iss. 6, p. 796-808. DOI: 10.1108/AA-05-2022-0139
- Roberts F.S., Sheremet I.A. Resilience in the Digital Age. Springer, 2021, p. 199. DOI: 10.1007/978-3-030-70370-7
- Xianming Liu, Guangyue Han. Information-Theoretic Extensions of the Shannon-Nyquist Sampling Theorem. ArXiv, 2018, p. 30 (Preprint). DOI: 10.48550/arXiv.1810.08089
- Iudin S.V. Kotelnikov theorem and sampling periodicity for Schuhart maps. News of the Tula state university. Technical sciences. 2020. Iss. 10, p. 116-120 (in Russian).
- Zhexuan Zeng, Jun Liu, Ye Yuan. A Generalized Nyquist-Shannon Sampling Theorem Using the Koopman Operator. IEEE Transactions on Signal Processing. 2024. Vol. 72, p. 3595-3610. DOI: 10.1109/TSP.2024.3436610
- Shambina S.V., Shambin A.I. Scientific programming in Python. Works of the Adygheya Republic Physical Society. 2023. N 28, p. 42-52 (in Russian).
- Cheskidov V.V., Manevich A.I., Lipina A.V. Big data obtaining and analysis in the mining structures state monitoring practice. Russian Mining Industry. 2019. № 2 (144), p. 86-88 (in Russian). DOI: 10.30686/1609-9192-2019-2-144-86-88
- Rylnikova M.V., Klebanov D.A., Knyazkin E.A. Data analysis as a basis for improving the efficiency of mining equipment in open pit operations. Russian Mining Industry. 2023. N 1, p. 52-56 (in Russian). DOI: 10.30686/1609-9192-2023-1-52-56
- Kupriyanov V.V. Modern problems of control on the basis of systems approach and the theory of information. Mining Informational and Analytical Bulletin. 2014. N 2, p. 273-280 (in Russian).
- Le D.H., Temkin I.O., Do T.L., Agabubaev A.T. Optimization of scrapper conveyor run modes control based on the analysis of imitation modelling. Caspian Journal: Control and High Technologies. 2020. N 2 (50), p. 10-21 (in Russian). DOI: 10.21672/2074-1707.2020.50.2.010-021
- Turtygina N.A., Okhrimenko A.V., Tsygankova D.N. Factors affecting the level of variability of the quality of extracted ore raw. Scientific Bulletin of the Arctic. 2022. N 13, p. 5-14 (in Russian). DOI: 10.52978/25421220_2022_13_5-14
- Shvabenland E.E., Lapteva M.I. Principles of mineral raw material quality management in combined mining complex structural deposits. News of the Tula state university. Sciences of Earth. 2021. Iss. 3, p. 326-335 (in Russian). DOI: 10.46689/2218-5194-2021-3-1-320-329
- Rylnikova M.V., Vlasov A.V., Makeev M.A. Justification of Conditions for Application of Automated Control Systems for Surface Mining during Construction of In Pit Crushing and Conveying System using Simulation Modeling. Russian Mining Industry. 2021. N 4, p. 106-112 (in Russian). DOI: 10.30686/1609-9192-2021-4-106-112
- Teng Long, Zhangbing Zhou, Gerhard Hancke et al. A Review of Artificial Intelligence Technologies in Mineral Identification: Classification and Visualization. Journal of Sensor and Actuator Networks. 2022. Vol. 11. Iss. 3. N 50. DOI: 10.3390/jsan11030050
- Deryabin S.A., Temkin I.O., Zykov S.V. About some issues of developing Digital Twins for the intelligent process control in quarries. Procedia Computer Science. 2020. Vol. 176, p. 3210-3216. DOI: 10.1016/j.procs.2020.09.128
- Upadhyay S.P., Askari-Nasab H. Simulation and optimization approach for uncertainty-based short-term planning in open pit mines. International Journal of Mining Science and Technology. 2018. Vol. 28. Iss. 2, p. 153-166. DOI: 10.1016/j.ijmst.2017.12.003
- Wengang Zhang, Jianye Ching, Goh A.T.C., Leung A.Y.F. Big data and machine learning in geoscience and geoengineering: Introduction. Geoscience Frontiers. 2021. Vol. 12. Iss. 1, p. 327-329. DOI: 10.1016/j.gsf.2020.05.006
- Erkayaoglu M., Dessureault S. Improving mine-to-mill by data warehousing and data mining. International Journal of Mining, Reclamation and Environment. 2019. Vol. 33. Iss. 6, p. 409-424. DOI: 10.1080/17480930.2018.1496885
- Pavlishina D.N., Shumilov P.A., Tereshchenko S.V. Working out a tool for formation efficient technological processes of ore flow quality stabilization. Problems of Subsoil Use. 2017. N 1 (12), p. 48-54 (in Russian). DOI: 10.18454/2313-1586.2017.01.048
- Rylnikova M.V., Tsupkina M.V., Kirkov A.E. Technologies of big data collection and processing - the basis for increasing the reliability of primary information about rock massifs in the development of mineral deposits and technogenic formations. News of the Tula state university. Sciences of Earth. 2023. Iss. 1, p. 308-327 (in Russian). DOI: 10.46689/2218-5194-2023-1-1-308-327
- Chong-chong Qi. Big data management in the mining industry. International Journal of Minerals, Metallurgy and Materials. 2020. Vol. 27. Iss. 2, p. 131-139. DOI: 10.1007/s12613-019-1937-z
- Hui Yang, Yamei Luo, Xiaolei Ren et al. Risk Prediction of Diabetes: Big data mining with fusion of multifarious physical examination indicators. Information Fusion. 2021. Vol. 75, p. 140-149. DOI: 10.1016/j.inffus.2021.02.015
- Yijiu Zhao, Houjun Wang, Yanze Zheng et al. High sampling rate or high resolution in a sub-Nyquist sampling system. Measurement. 2020. Vol. 166. N 108175. DOI: 10.1016/j.measurement.2020.108175