
Forecast of radionuclide migration in groundwater of the zone affected by construction drainage at the Leningrad NPP-2
- 1 — Postgraduate Student Saint Petersburg Mining University ▪ Orcid
- 2 — Ph.D., Dr.Sci. Director Saint Petersburg Branch of the Institute of Geoecology named after E.M.Sergeev, RAS ▪ Orcid
- 3 — Ph.D. Leading Researcher Saint Petersburg Branch of the Institute of Geoecology named after E.M.Sergeev, RAS ▪ Orcid
- 4 — Junior Researcher Saint Petersburg Branch of the Institute of Geoecology named after E.M.Sergeev, RAS ▪ Orcid
- 5 — Ph.D., Dr.Sci. Professor Saint Petersburg Mining University ▪ Orcid
- 6 — Junior Researcher Saint Petersburg Branch of the Institute of Geoecology named after E.M.Sergeev, RAS ▪ Orcid

Abstract
The distribution of natural (at the level of global background) and technogenic radionuclides in groundwater of the industrial zone in Sosnovy Bor town, where several nuclear power facilities are operating, was analyzed. The main technogenic radionuclides recorded in groundwater samples are cesium (137Cs), strontium (90Sr), and tritium isotopes. The first two aquifers from the surface are subject to contamination: the Quaternary and the upper zone of the Lomonosov aquifer. Based on extensive material on the engineering and geological studies of the work area, a 3D geological model and hydrodynamic and geomigration models of the industrial zone were constructed. By means of modeling, the extent and nature of changes in hydrogeological conditions of area resulting from the construction and operational drainage of the new stage of the Leningrad Nuclear Power Plant (LNPP-2) were determined. The “historical” halo of radioactive contamination of groundwater forming (1970-1990) at the site adjacent to the NPP, where the storage facility of low- and medium-level radioactive waste is located, falls into the zone of influence. Interpretation of monitoring data allowed obtaining the migration parameters for predictive estimates. Modeling has shown that during the time of the LNPP-2 operation there was no intake of contaminated water by the drainage system of the new power plant.
None
Introduction
During the NPP construction and operation the geological environment and ecosystems of surface water bodies are subject to various impacts. Traditionally, the following sources of technogenic radionuclides at the NPP site are considered: storage facilities for the plant radioactive waste (RW); spent nuclear fuel storage pools; water leakages from the technological pipelines; reactor plants in emergency conditions (design basis and off-design accidents). Thus, according to the statistical data of the US Nuclear Regulatory Commission [1]), at many of the 55 commercial NPP sites groundwater shows elevated concentrations of tritium, in some cases, 14C carbon and fission products of nuclear materials are present. A characteristic example is tritium contamination of groundwater at the site of the Sequoyah NPP (Tennessee) caused by defects in the pipelines. Large-scale tritium contamination (the activity of tritium in water reaches 500 Bq/l) was recorded at the operating Paks NPP (Hungary) [2], and the zone of potential influence of the tritium halo is near the location site of the new NPP stage (Paks-II). A similar problem is faced during the construction of a new NPP in Lithuania within the industrial area (IA) of the Ignalina NPP decommissioned at the end of 2009 [3]. Many studies have shown that mathematical modeling of groundwater migration is the most reliable tool for predicting changes in its radiological state under conditions of a growing capacity of nuclear power facilities [3]. At the same time, the analysis of the published materials in many cases indicates an insufficient parametric validity of hydrogeological models, in particular, the information obtained in the course of a long-term monitoring of groundwater is not fully used. Monitoring can perform not only control, but also experimental functions helping to specify the filtration and migration parameters of aquifers [4-6].
In Russia, the construction of new power units, including replacement ones, is carried out near the sites of the operating plants or other nuclear facilities (NF), within which there are existing or potential sources of radioactive contamination of groundwater. Thus, the LNPP-2 is in close proximity to the decommissioned LNPP, a regional facility for the management of low and medium level waste (FGUP “FEO”, formerly LSK “Radon”) [7-9] and some other nuclear facilities (NF) in the industrial area (IA) of Sosnovy Bor town. In the immediate vicinity of the Novovoronezh NPP-2 there are also a number of radiation-hazardous facilities (filtration fields contaminated with radionuclides, RW storage facilities), territorially and historically associated with the Novovoronezh NPP first stage site [10]. Since the influence of the new power plants and stages of power units nearing completion extends to the areas with strongly altered (disturbed) natural conditions, the problem of predicting the chemical and radioactive contamination of drainage water extracted during the construction and operational drainage of the NPP, arises. This study focuses on the analysis of this problem in relation to the Sosnovy Bor facility.
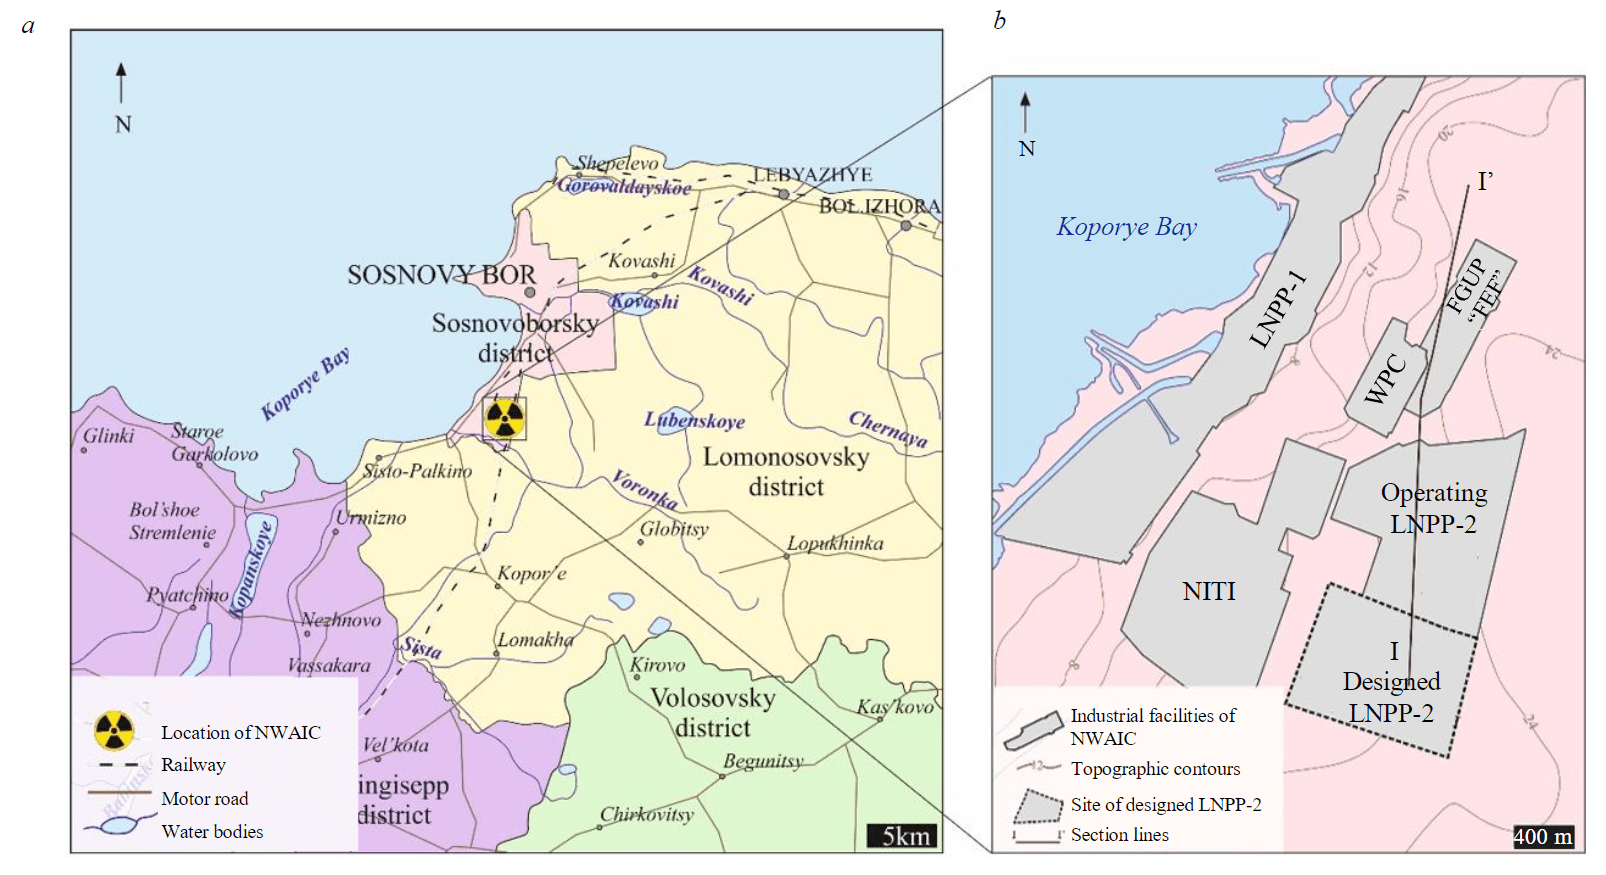
Fig.1. Study area: a – regional scheme; b – main NF in the industrial zon
Methodology
The analysis is based on the database of groundwater radiation monitoring in the IA (Fig.1) which combines the information collected from local (“departmental”) networks of observational hydrogeological wells at each of the operating NF. Total number of such wells in the industrial area is approaching 200. The collection and generalization of data from object monitoring of the subsoil state at the facilities of the “Rosatom” State Corporation is carried out in a centralized way across the country within the framework of the state program by the experts of the FGBU “Gidrospetsgeologiya”.
Starting in the 1980-1990s, the radiation monitoring services have been monitoring the radiological indicators, level, temperature, and chemical composition of groundwater in the Quaternary and upper parts of the Lomonosov aquifers. In accordance with the regulations of a particular facility, radiation monitoring includes the following indicators: total volume a- and b-activity, volume activity of tritium and, selectively, the activities of 90Sr, 137Cs, and actinides. A specific list of monitoring parameters, frequency of sampling and measurements in wells as well as the sampling and analysis methodology, provided there are the national guidance documents, is determined by the regulations of the facilities, often methodologically inconsistent with each other.
Total b-activity is the main indicator controlled by the radiation safety services at the agro-industrial complex (AIC) facilities. Its background values for the European part of the RF are 1-4 Bq/l (excluding tritium activity), of which 50-80 % are due to 40K isotope activity. Owing to the constancy of potassium isotopic composition in groundwater, 40K to stable K+ ratio is a constant value, and the value of b-activity caused by the presence of 40K isotope Bq/l can be approximately calculated by multiplying the concentration of K+ ion mg/l by a factor of 0.0276. For K+ concentration values not exceeding 10-12 mg/l in the Sosnovoborsky district, the calculated value of volume b-activity of groundwater due to the presence of 40K is less than tenths of Bq/l. At background activity of 90Sr not exceeding hundredths of Bq/l, and a priori assumption of an insignificant share of b-activity of 137Cs, total b-activity of groundwater exceeding the value of 0.5-1 Bq/l (taking into account measurement errors) indicates the presence of technogenic radionuclides in it, the main of which, according to the experience of radiation monitoring in the IA, is 90Sr. The same value (1 Bq/kg of specific total b-activity) is regulated by NRB-99/2009 as a criterion of the need for further research into the radionuclide composition of water.
In the first years of operation of local monitoring systems, the accuracy of determining the activity of radionuclides in groundwater in the radiation monitoring laboratories of the facilities was low. For example, at the RW disposal site (LSK “Radon”), the sensitivity threshold for measuring b-activity did not exceed 1 Bq/l; a-activity, 0.2 Bq/l. This made it possible to record the non-exceedance of the maximum permissible values by the radiation indicators.
Groundwater monitoring at the LSK “Radon” started in 1982-1983, when the first 13 wells were drilled into the Quaternary aquifer. Further, the stock of observation wells was increased by 35 wells in 1989-1993 and by 40 in 2007-2011. Many of the first stage wells have already been decommissioned due to poor technical condition. The observations involved 66 control and observation wells (COW) equipped for the Quaternary (depth 2.5-7 m) and Lomonosov (middle and lower zones, depth 7-14 m) aquifers. The measurement time interval is determined by the location of wells relative to the storage buildings and varies from once a week (tritium and b-activity) to single measurements on demand. The level and the number of indicators of the groundwater chemical composition are also selectively controlled.
At the site of NITI named after A.P.Aleksandrov, radiation monitoring of groundwater composition started in the late 1990s. The most complete series of data is available for eight observation wells equipped for the Quaternary and Lomonosov (middle and lower zones) aquifers. The activity of tritium, 90Sr and 137Cs is measured in wells of the operational network with determination accuracy of background values.
The radiation monitoring network of the new LNPP-2 was developed at the stage of its construction (since 2008) and comprises 13 observation wells equipped for the Quaternary and Lomonosov (upper, middle, and lower zones) aquifers. Testing of the COW was carried out as part of the survey work (2010-2015) and included measurements of the activities of tritium, 90Sr and 137Cs.
The first data on the radiological indicators of groundwater between the sites of the facilities were represented by the results of testing carried out by VNIPIET and the NPO “Radium Institute” in 1991 during the period of the maximum leakages of radionuclides at the RW disposal site. The results of analysis of tritium samples showed its irregular distribution across the sampling points, the maximum values ranging from 3,300 to 1,600 Bq/l [7].
In 2009, FGUP “Gidrospetsgeologiya” and SPbO IGE RAS restored and drilled new observation wells between the sites of the LSK “Radon” (FGUP “FEO”) and the WPC LNPP, and starting from 2010 to 2015 within the framework of the pre-operational monitoring at the LNPP-2 under construction, radiological monitoring of groundwater was carried out on a grid of 39 wells within the entire IA (Fig.2). Sampling was performed twice a year and included the measurement of a-, b-radioactivity, volume activity of technogenic radionuclides (tritium, 137Cs, 90Sr, 238/240Pu) and natural radioisotopes (222Rn, 224Ra, 226Ra, 228Ra, 210Pb, 210Po and others) [9].
Measurements of total a- and b-activities were carried out using an UFM-2000 radiometer (NPC “DOZA”, Zelenograd). The detection limits for total a- and b-activities are 0.02 and 0.1 Bq/l, respectively. Sample preparation (evaporation of a liquid sample and obtaining dry residue) implies that the measurement of a- and β-activities excludes the influence of tritium. Tritium content was measured with a Tri-Carb 2910TR spectrometric radiometer (Waltham, USA). The detection limit of tritium is 10 Bq/kg; the measurement error is 3-25 %. The activity of 90Sr in groundwater was determined by the daughter 90Y followed by precipitation radiometry using the UMF-2000 radiometer according to the procedure developed at NITI named after A.P.Aleksandrov (Sosnovy Bor) (detection limit 10 Bq/m3). 137Cs was determined using a DSPEC jr (ORTEC, USA) γ-ray spectrometer (detection limit 10 Bq/m3).

Fig.2. Distribution of activity in IA based on results of pre-operational monitoring at LNPP-2 (data averaged for 2009-2015): а – tritium, Bq/l; b – 90Sr, mBq/l Sampling aquifer: 1 – Quaternary; 2 – Lomonosov (upper zone); 3 – Lomonosov (middle zone); 4 – Lomonosov (lower zone)
Notions about the variability of the filtration properties of water-bearing strata within the IA were obtained by analyzing the materials of experimental filtration sampling conducted in 1998-2013. The enclosing medium was characterized by cluster and single pumpings, fillings, and express sampling. To construct a matrix of filtration heterogeneity, data from the database on 137 experimental samples were used: cluster and single pumping and express testing. During processing, the following main calculation schemes were used:
- aquifer complex with overflow from an aquifer with varying pressure (with variable and constant flow);
- pressure aquifer unconfined in plan (with variable and constant flow rate);
- linear source: an imperfect well in a pressure aquifer, confined in section and unconfined in plan (with variable flow rate).
As a result of processing, one or more parameters from the following set were determined:
- piezoconductivity (or water yield) of the main and adjacent aquifer beds (a, m2/day);
- conductivity of the main and adjacent aquifer beds (T, m2/day);
- overflow parameter (B, m);
- filtration coefficient (k, m/day).
In processing, basic analytical solutions of such authors as A.F.Moench [11], S.P.Neuman [12], M.S.Hantush [13], Javandel-Witherspoon [14], H.H.Cooper [15] and others were used. All field experiments were reinterpreted using the ANSDIMAT software package [16].
The intensity of radionuclide migration in groundwater is largely controlled by the ability of the porous medium to retain and accumulate radionuclides due to sorption processes. In laboratory experiments, the sorbability of 90Sr and 137Cs radionuclides on the Quaternary sandy-clayey rocks and Cambrian weakly cemented sandstones was studied. The experiments were carried out with artificial solutions imitating the characteristic composition of groundwater. Radioactive labels were introduced into natural water under strict control of the pH constancy inherent in natural waters.
The notion of sorbability of radionuclides is also given by the interpretation of data from long-term radiation monitoring of groundwater within the FGUP “FEO” site [9]. The analysis of the output curves can be performed using the method of statistical time moments [17-23]. For the convenience of calculation, the absolute statistical moments mj are normalized by the zero moment m0:
The first statistical moment (j = 1) is the center of gravity and allows calculating the average residence time of the component from the source to the measurement point. For subsequent moments, the central moments (or moments relative to the middle) are determined, which characterize the scatter of the points of output curve с = f (t) relative to its center of gravity. The second moment characterizes the hydrodynamic dispersion (scattering degree of a random value relative to the average residence time) and is determined by the dependence:
The formulas for determining the statistical moments in the case of one-dimensional convective-dispersive transfer of the sorbed components subject to decay, when setting the input step function (Heaviside), have the form [17, 19, 20, 24]:
where ts is the duration of contamination (in this case, continued leakage from storage facilities); DL pore dispersion coefficient, m2/day; R sorption delay factor, R = 1 + Kdrb/n; Kd sorption distribution coefficient; rb rock density; n porosity; λ radioactive decay constant, λ = 0.693/T1/2; T1/2 half-life of radionuclide; $a=\sqrt{u^2+4D_Lλ}$ u average pore filtration rate.
Equations (3) and (4) can be considered as a system of equations, the solution of which allows determining the velocity u, dispersion coefficient DL (using non-sorbable component, tritium), and the sorption delay factor R (using data on b-activity). Statistical moments μ′1 and μ2 are calculated after approximation of indicator graphs C(t) by step functions.
To predict the migration of radionuclides under changing hydrodynamic conditions of the area, the PMWIN software was used, which comprises the filtration (Modflow) and transport (Modpath) calculation modules [25]. Modflow is based on the differential equation of flow continuity, which is solved by numerical methods [26-28]. The migration problem was solved in a simplified formulation using streamlines on the Modpath module without regard for hydrodispersion [29, 30]. The choice of the Modpath module is due to the fact that at this work stage the following was investigated: movement direction of the contamination halo, its actual rates, and the arrival time of radionuclides to the discharge zones. Since radionuclide concentrations in groundwater were not the subject of consideration, the solution of the complete advective-dispersive problem is redundant and can only lead to additional uncertainties.
As a basis for constructing the surfaces of the top and the base of each model layer, a geological model created in the SGeMS software [31, 32] was used. The filling of the 3D geological model was based on the information on 1,504 wells from the database obtained in the course of engineering geological and hydrogeological surveys in the study area. The average depth of wells was 16 m, a total of about 24,000 m were drilled. In the course of the field and laboratory work, 14 basic engineering geological elements were identified. The interpolation of surfaces between individual wells was carried out using the kriging algorithm (Sequential Gaussian Simulation procedure).
After the filtration model had been produced, it was calibrated in a stationary environment. The data on the average long-term groundwater levels for 110 COW and the volume of actual water inflow into the construction pits at the LNPP-2 were involved. Calibration was carried out until the design and actual values of water levels and the volume of construction drainage began to coincide.
Characteristics of the object of research and modeling
In hydrogeological terms, the Quaternary, the Lower Cambrian aquifers and the Vendian aquifer complex are distinguished in the sedimentary strata (Fig.3). The two first aquifers from the surface, the Quaternary (QIV) and the Lower Cambrian (Є1), are subject to the greatest technogenic impact in the study area [9].
Water-bearing rocks of the Quaternary aquifer are supra-morainic sands of various genesis, their thickness over most of the area not exceeding 5 m [33, 34]. The aquifer is underlain by weakly permeable loam interbeds to 8 m thick, which are a local aquiclude [35]. Based on the geological section, the aquifer is not protected from surface contamination.
The Lower Cambrian aquifer Є1 underlying the Quaternary aquifer is composed of sands and weakly cemented sandstones which are divided by weakly permeable clay interbeds into separate zones. At the LNPP-2 site, there are three such aquifers in the section, and at the site of the FGUP “FEO” Branch there are only two, whereas beyond the WPC LNPP area, towards the bay, the aquifer completely wedges out. Water is fresh, bicarbonate, of mixed cationic composition.
A characteristic feature of the geological section of the area is the presence of buried riverbeds – paleovalleys filled with sands, sandy loams, loams. On the floors of ancient valleys, total thickness of the Quaternary deposits reaches 40 m; thus, they are cutting through the underlying Lower Cambrian strata. Therefore, paleovalleys create hydrogeological windows, due to which groundwater of the considered aquifers has a good hydraulic connection. Paleovalleys cross the LNPP-2 site and are recorded in the northern and southern parts of the FGUP “FEO” site (Fig.1, 3).
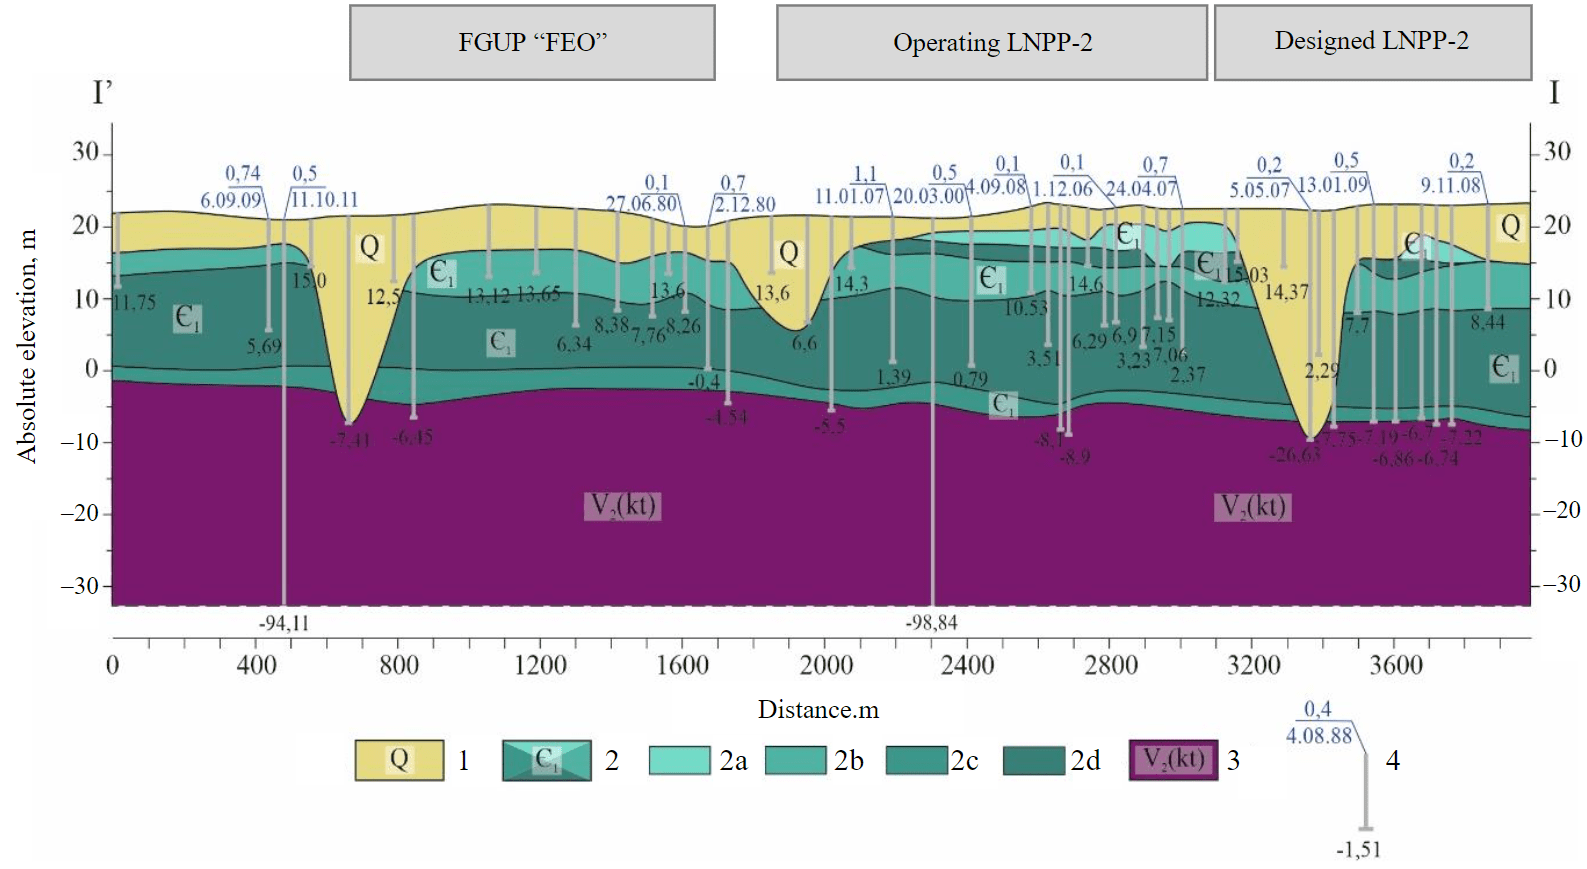
Fig.3. Hydrogeological section along I-I’ line (see Fig.1) 1 – Quaternary aquifer;2 – Lower Cambrian (Lomonosov) aquifer: 2a, 2b, 2c – water-bearing layers of the aquifer;2d – separating aquicludes; 3 – Upper Vendian (Kotlin) aquiclude; 4 – well: above – depth to the established groundwater level and measurement date; below – absolute elevation of well bottom
Radiation monitoring carried out during five years in connection with construction of the LNPP-2 allowed establishing the following distribution of radiation indicators in aquifers of the IA (Table 1). The site of the LNPP-2 under construction is completely free from the impact of radioactive contamination: tritium activity values do not exceed 10 Bq/l, and in most wells – 4 Bq/l (Fig.2, a). Based on the available data, it is possible to determine the background value of volume activity of tritium in groundwater – 1-4 Bq/l. The volume activity values of other technogenic radionuclides vary within the limits that can be considered as background: 90Sr – 0.004-0.030 Bq/l, 137Cs – 0.004-0.040 Bq/l (Fig.2, b). The values of integral radiation indicators are: b-activity – 0.1-1.0 Bq/l, a-activity – 0.01-0.2 Bq/l. The study area in the IA outside the sites of FGUP “FEO”, WPC LNPP and LNPP, according to the monitoring results, is characterized by virtually background values of the activity of cesium and strontium isotopes (less than 0.1 Bq/l) and an irregular distribution of tritium. The highest values of tritium are recorded in several wells in close proximity to the contamination sources – near the LNPP site, near the WPC LNPP, and also slightly north-west of the NITI site.
The contents of natural radioactive isotopes (222Rn, 228Ra, 210Pb, 232Th) range from n ·10–3 to n ·10–2 Bq/l and do not exceed the LIdw. These activities can be regarded as background for the study area. For their statistical confirmation, further monitoring of groundwater is required.
FGUP “FEO” is most important among the operating NF in terms of its impact on groundwater quality (Fig.2). The facility holds over 60,000 m3 RW with total activity 3.16·1016 Bq [3]. Radionuclides recorded in groundwater at the site are mainly represented by: tritium, 90Sr and 137Cs. 239Pu, 238Pu, 241Am, 210Pb, 210Po, 60Co, 226Ra were determined in water at the level of background activities. Monitoring data allow quantifying the migration process.
Table 1
Statistical data on the content of technogenic radionuclides in groundwater at NWAIC sites
|
Radionuclide |
Number of definitions |
Mean, Bq/l |
Minimum, Bq/l |
Maximum, Bq/l |
Level of intervention in drinking water (LIdw) after NRB-99/2009, Bq/l |
|
WPC NPP (2009) |
|||||
|
137Cs |
2 |
1.15 |
0.1 |
2.2 |
11 |
|
90Sr |
8 |
0.13 |
0.01 |
0.67 |
4.9 |
|
Tritium |
3 |
1.6∙105 |
2.5∙103 |
4.7∙105 |
7,600 |
|
LNPP-1 (2009) |
|||||
|
137Cs |
3 |
0.13 |
0.13 |
0.14 |
11 |
|
90Sr |
9 |
0.05 |
0.01 |
0.13 |
4.9 |
|
60Co |
3 |
0.12 |
0.1 |
0.13 |
40 |
|
Between WPC LNPP and LNPP-1 sites (2009-2015) |
|||||
|
137Cs |
29 |
0.17 |
0.002 |
4.7 |
11 |
|
90Sr |
28 |
0.02 |
0.003 |
0.1 |
4.9 |
|
Tritium |
93 |
59 |
0.02 |
1460 |
7,600 |
|
NITI (2009-2010) |
|||||
|
137Cs |
7 |
0.024 |
0.023 |
0.027 |
11 |
|
90Sr |
8 |
0.017 |
0.014 |
0.022 |
4.9 |
|
Tritium |
8 |
5 |
5 |
5 |
7,600 |
|
LNPP-2 (2010-2015) |
|||||
|
Quaternary aquifer |
|||||
|
∑α |
8 |
0.11 |
0.03 |
0.19 |
0.2 |
|
∑β |
8 |
0.21 |
0.1 |
0.45 |
1.0 |
|
137Cs |
8 |
0.01 |
0.002 |
0.037 |
11 |
|
90Sr |
7 |
0.02 |
0.003 |
0.11 |
4.9 |
|
Tritium |
21 |
8.74 |
1.02 |
56 |
7,600 |
|
Lomonosov aquifer |
|||||
|
∑α |
28 |
0.11 |
0.02 |
0.28 |
0.2 |
|
∑β |
28 |
0.22 |
0.03 |
0.67 |
1.0 |
|
137Cs |
26 |
0.01 |
0.002 |
0.03 |
11 |
|
90Sr |
29 |
0.01 |
0.001 |
0.03 |
4.9 |
|
Tritium |
39 |
6.14 |
0.18 |
99.7 |
7,600 |
In groundwater of the LSK “Radon” site in 1987-1991 there was a surge in the activity of technogenic radionuclides caused by the leakage of radioactive solutions from the storage facilities (Table 2). This was caused by an inadequate protection of buildings from atmospheric precipitation and flooding due to the rise in groundwater levels during floods. This led to the RW contact with surface- and groundwater and a subsequent flow of radioactive solutions into aquifers. To eliminate the leakages, the storage facilities were modernized, which reduced the content of technogenic radionuclides.
Table 2
Comparison of volume activity of leachates from storage facilities and groundwater selected from observation wells along the storage perimeter
|
Characteristic |
Tritium |
137Cs |
90Sr |
|
Leachate at storage bottom |
|||
|
Maximum values (1998-1999) |
3.7·1010 |
7.4·107 |
8.5·106 |
|
Mean values (1998-1999) |
8.1·109 |
1.1·107 |
2.2·106 |
|
Mean values (2009) |
4.9·108 |
3.2·105 |
6.7·104 |
|
Mean values (2014) |
3.5·108 |
2.3·105 |
9.4·104 |
|
Mean values (2017) |
7.6·108 |
3.6·105 |
3.6·105 |
|
Monitoring wells |
|||
|
Maximum values (1990-1991) |
3.7·1010 |
6.7·105 |
4.4·106 |
|
Maximum values (1998-1999) |
1.9·1010 |
8.9·104 |
9.3·105 |
|
Intervention level in drinking water (NRB-99/2009) |
7.7·106 |
11·103 |
5·103 |
Figure 4 shows that in 1991 the largest area of tritium contamination (activity over 1·104 Bq/l) was recorded in the Quaternary aquifer. The maximum activity was noted in the area of storages N 8 and 9 and in the eastern corner of storage N 4. Observations of groundwater level showed that near the storage, levels in the Quaternary aquifer are higher than in the Lomonosov aquifer. Groundwater level difference between the aquifers reaches about a meter, which can contribute to contamination of the lower aquifer through hydraulic windows (absence of a separating aquiclude, presence of paleovalleys). In 2017, there was a gradual decrease in the activity of groundwater contamination in the Quaternary aquifer and its growth in the Lomonosov aquifer due to the presence of a hydraulic connection between them.
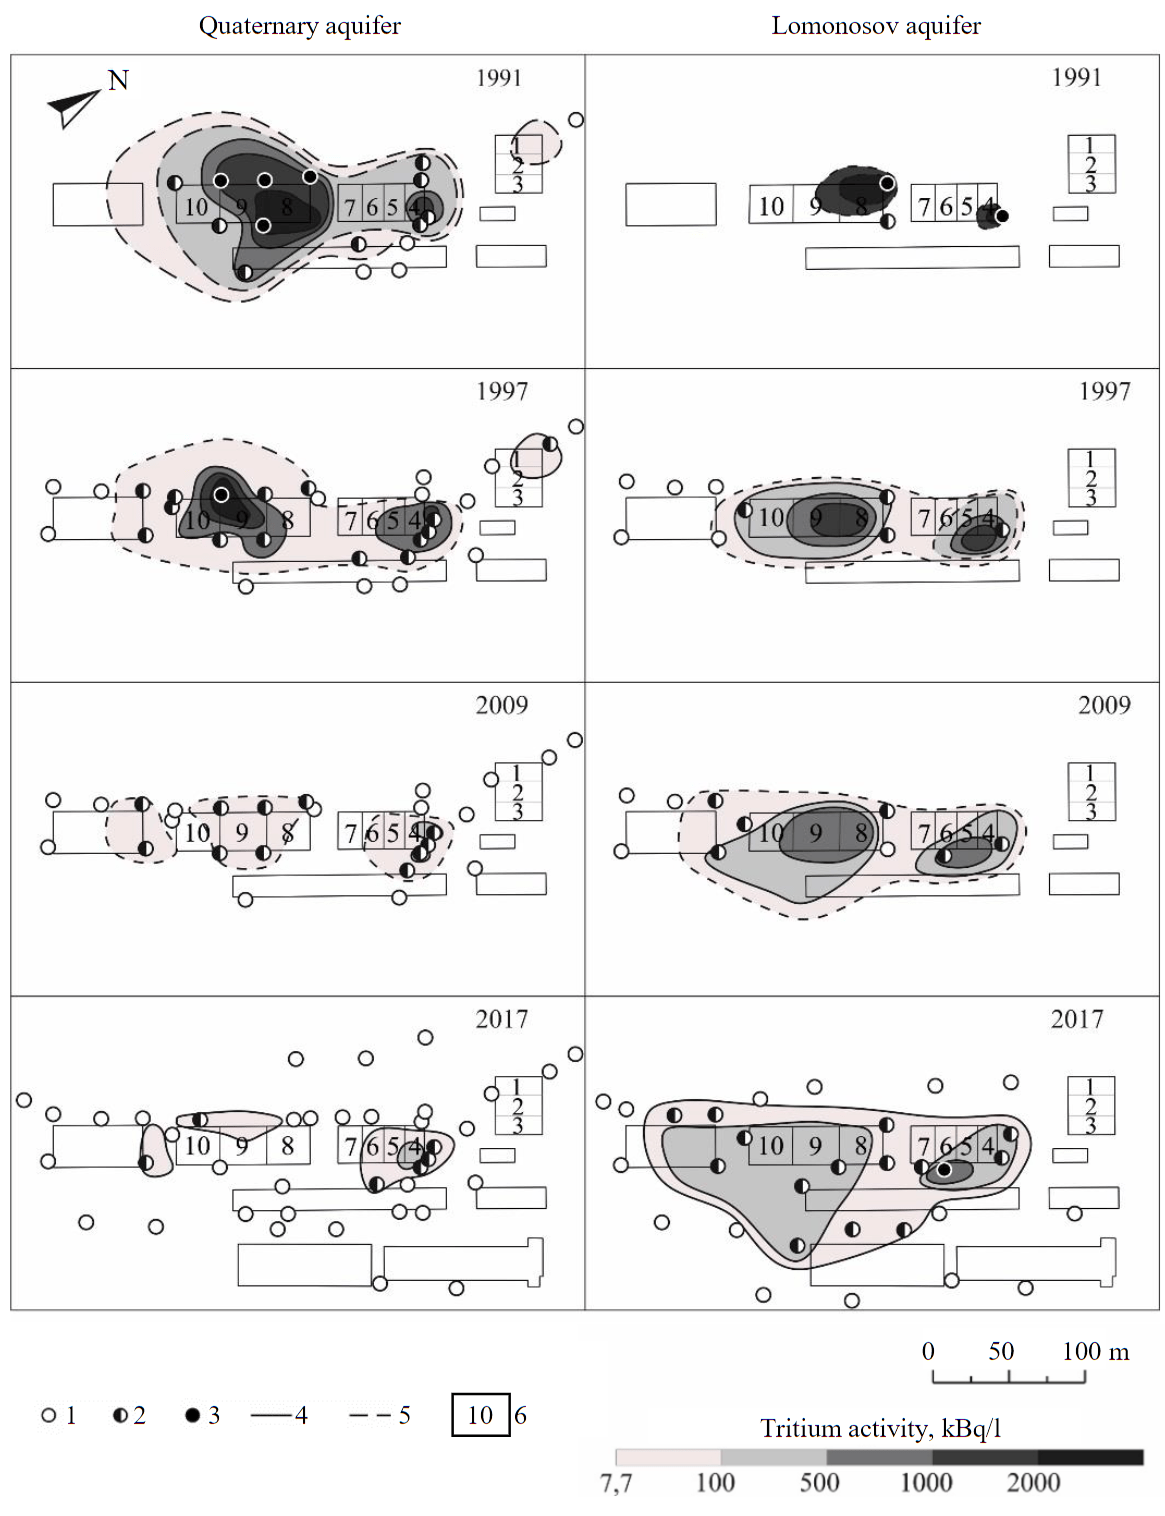
Fig.4. Tritium contamination halo of groundwater in Quaternary and Lomonosov aquifers 1-3 – observation wells (COW): 1 – tritium activity less than 7.7 kBq/l; 2 – tritium activity from 7.7 to 1·103 kBq/l; 3 – tritium activity over 1·103 kBq/l; 4 – confirmed halo contours; 5 – presumed halo contours; 6 – storage facility and its number
A change in b-activity in aquifers generally corresponds to the patterns revealed in the analysis of tritium contamination: the maximum activity was recorded in the late 1980s in the Quaternary aquifer in the area of storages N 4, 8, 9. Simultaneously with contamination in the upper aquifer, due to hydrogeological conditions of the area, the contamination flows into the lower aquifer. By 2017, the values of b-activity in the Quaternary aquifer decreased by several orders of magnitude due to dilution of the halo with clean groundwater and atmospheric precipitation as well as radioactive decay.
Concentration of isotopes of one of the most toxic radioactive components – plutonium (238Pu and 239,240Pu) in groundwater, as shown by the results of a-spectrometric measurements at five observation wells, in almost all samples is hundredths and tenths of a Bq/l. The maximum value 0.013 Bq/l was recorded at one of the COW nearest to the storage facility, which is one order of magnitude lower than the permissible norms after NRB-99/2009 (0.6 Bq/l). In the canyon of the RW storage facility, the content of plutonium isotopes is also approximately two times lower than the LIdw according to NRB-99/09.
Directly beyond the western boundary of the FGUP “FEO” there is another NF – the WPC LNPP site with temporary storage tanks for liquid radioactive waste (Fig.2). In the 1990s there were leakages from them into concrete pallets where the values of radionuclide activity in solutions in the late 1980s reached 2.3∙104 Bq/l (60Co) – 3∙104 Bq/l (137Cs) [36]. Due to the aging of pallets and pits, radionuclides got into groundwater. In some wells near the boundary of the WPC with the FGUP “FEO” site, volume b-activity during the measurement period repeatedly exceeded 3.7 Bq/l, which is higher than groundwater activity at the neighboring LNPP site (0.7-1.9 Bq /l). This approximately corresponds to the natural activity of 40K. In the north of the site, local tritium contamination to 170-180 Bq/l was recorded. Elevated levels of 90Sr 0.035-0.57 Bq/l were found along the Koporye Bay line in groundwater within the power plant. In subsequent years, according to the monitoring service of the facility, radiological indicators of groundwater a-, b-activity and tritium do not exceed 7,000 Bq/l [37].
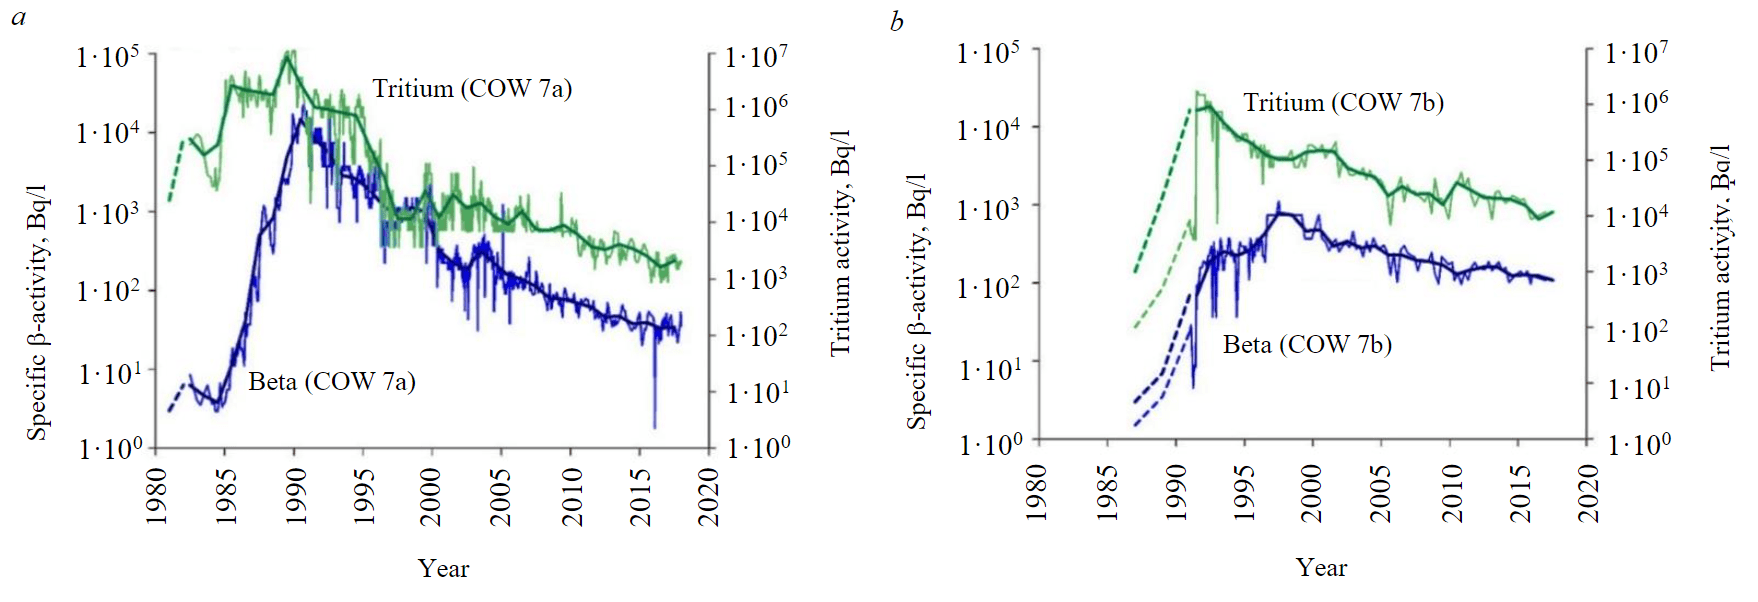
Fig.5. Output curves for tritium and β-activity after COW 7a (a) and 7b (b) (thin lines – quarterly measurements, thick ones – annual average)
Summing up the results of analyzing the radiation state of groundwater, it can be concluded that the most urgent problem is a possible contamination of underground drainage at the LNPP-2 site due to involvement of radionuclides in the water intake as part of the formed contamination halo in the Quaternary and Lomonosov aquifers. The reliability of prediction increases due to detailization of the contamination processes in close proximity of the contamination source for assessing the existing evolution trends of this process. The corresponding prediction estimates also require the use of mathematic modelling techniques.
Monitoring data on wells in the RW storage area (Fig.4) can be used to determine mass transfer parameters. Thus, Fig.5 shows the most typical indicator curves for tritium and b-activity for the COW closest to the storage facility – 7a (Quaternary aquifer) and 7b (Lomonosov aquifer). In the upper aquifer, higher levels of contamination were recorded in wells in 1989-1995; in the lower aquifer, in 1990-2005. In both aquifers, the peaks of b-activity lag behind the tritium peaks by several years, which can be accounted for by a slowdown of sorbing b-emitting radionuclides (primarily 90Sr) with respect to inert tritium.
The interpretation assumed that the leakage of radioactive solutions began in 1979, just a few years after their commissioning, and continued until the end of the 1980s, i.e., ts is about 10 years. The distance from the contamination source to COW 7a and 7b is 12 and 15 m.
Table 3 presents the calculation results of convective dispersion and sorption indicators. The interpretation of time lags of activity peaks measured at COW 7a and 7b (Fig.5) gave close values of the delay coefficient R, which were used in prediction estimates.
Table 3
Calculation results of transport characteristics of dissolved substances by the method of time moments
|
Well |
Indicator |
*, year |
μ′1, year |
μ2, year |
u, m/year |
DL, m2/year |
δL**, m |
R |
Kd***, ml/y |
|
|
7a |
Tritium |
̴ 1987 |
10.18 |
8.7 |
2.3 |
0.19 |
0.08 |
– |
– |
|
|
b-activity |
̴ 1990 |
13.64 |
14.9 |
1.66 |
0.09 |
|||||
|
7b |
Tritium |
̴ 1991 |
15.34 |
24.6 |
1.4 |
1.66 |
1.18 |
– |
– |
|
|
b-activity |
̴ 1999 |
22.34 |
35.2 |
1.58 |
0.08 |
|||||
* – approximate time of concentration peak; **δL = DL/u – microdispersion parameter; ***n = 0.3 and rb = 2.1 g/cm3 were used in calculation.
The hydrodynamic model comprises the industrial area (6.85×8.05 km). The coast of the Gulf of Finland (type I) served as the outer boundary in the west of the model area. The eastern boundary of the model area was set according to the remote hydroisobath with an absolute elevation of +26 m (type I). The Voronka River was taken as the southern boundary of the model (type III). The northern boundary of the model was set along the streamline of the ground aquifer drawn from the coast of the Gulf of Finland north of the LNPP-1 to the hydroisobath with an absolute elevation of +26 m (type I). The upper limiting surface of the model is the relief surface, and the top of the Kotlin clays, which acts as a regional aquiclude, was taken as the lower boundary. Internal boundaries of the model are channels, creeks, and a developed drainage network of the facilities (type III). In the model there is also the NITI discharge channel and the LNPP channels (Fig.6, a). The infiltration recharge was evenly distributed over the model area, with the exception of some local areas associated with location of drainage networks.
Hydrogeological section was approximated by eight model layers: 1 – corresponds to the Quaternary aquifer; 3, 5, 7 – three aquiferous zones of the Lomonosov aquifer; 2, 4, 6 – relative aquicludes separating them; 8 – Upper Vendian aquiclude (Fig.6, b).
Lithological structure of the Quaternary sequence in the study area is accompanied by a strong heterogeneity both in plan, and in depth. Lenses of sandy varieties alternate with sandy loams and loams; thickness of the Quaternary deposits is highly variable. In local areas, in places of paleovalleys, a significant increase in thickness to 35 m is recorded. Paleochannel can be filled with both highly permeable gravelly deposits, and low permeable sandy loams and loams. A strong lithological heterogeneity of the Quaternary rocks predetermined a wide range of values for the filtration coefficients of the studied strata (Table 4).
For the upper aquiferous zone of the Lomonosov aquifer, the determination accuracy of parameters is complicated by the limited area of its occurrence within the site as well as a hydraulic association with the Quaternary aquifer. In the middle aquiferous zone, values of the filtration coefficient are similar to those in the upper one. Filtration coefficients of the lower aquiferous zone have lower values than in the upper or middle zones (Table 4).
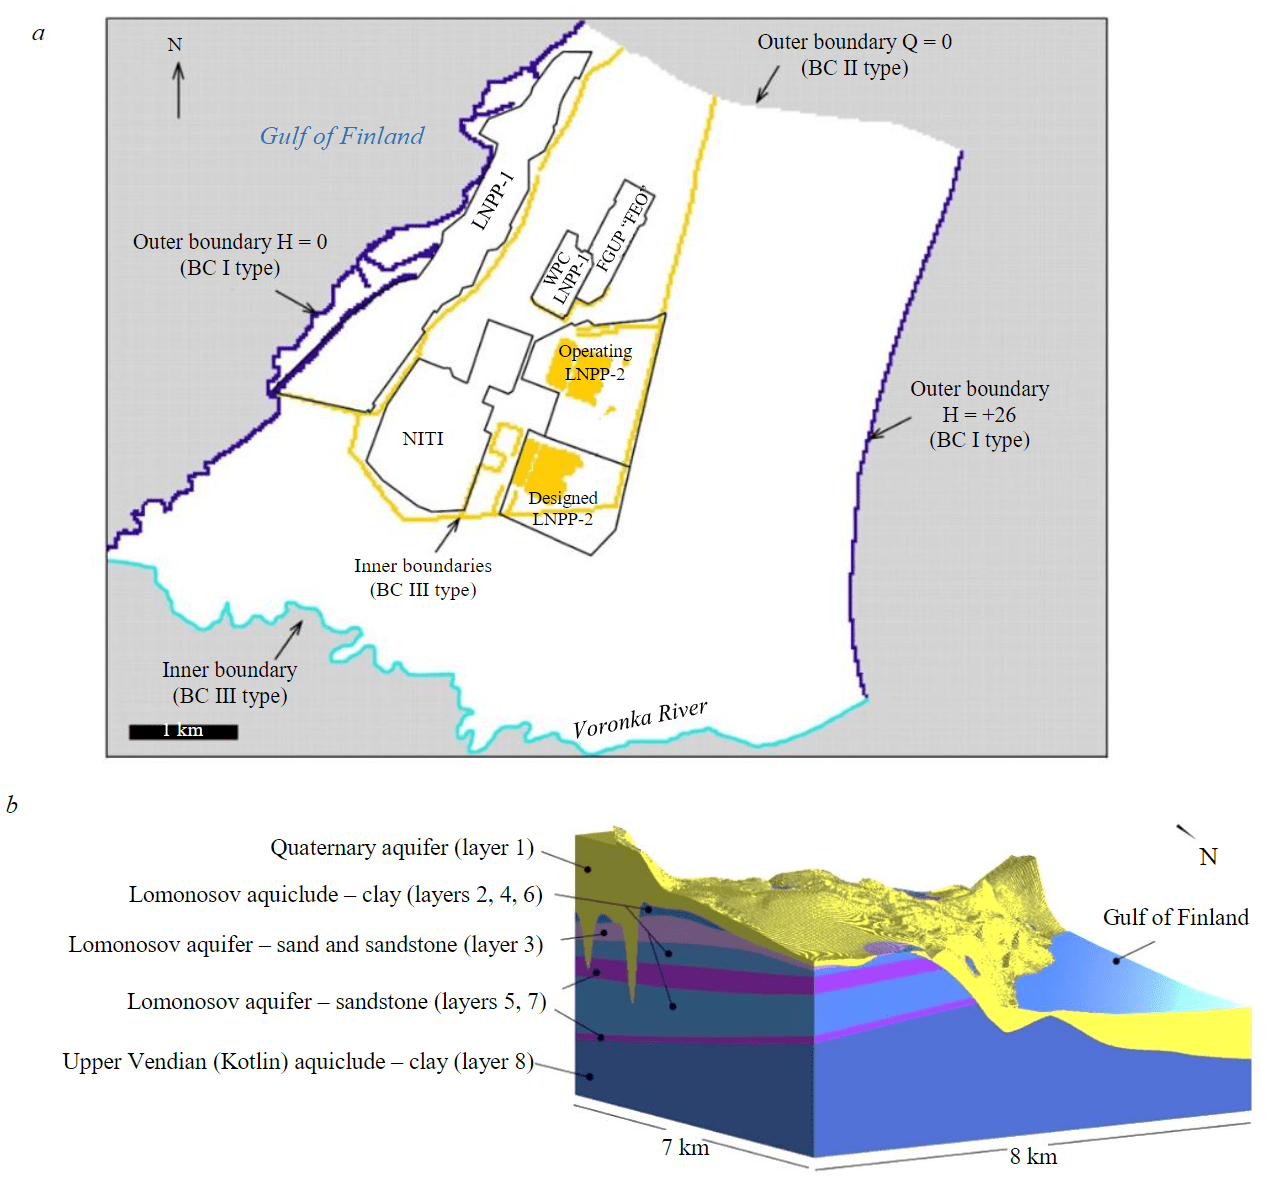
Fig.6. Hydrodynamic type of boundaries of groundwater filtration model (a) and its 3D view (b)
Table 4
Resulting table of filtration coefficients in the model
|
Rock type |
Filtration coefficient, m/day |
|
Quaternary deposits |
|
|
Gravelly sand, gravelly soil |
4.1 |
|
Medium- and coarse-grained sand Fine-grained and dust sand Sandy loam |
0.24 0.1 0.05 |
|
Cambrian deposits |
|
|
Upper aquiferous zone (sand, sandstone) |
0.94 |
|
Middle aquiferous zone (sandstone) |
0.88 |
|
Lower aquiferous zone (sandstone) |
0.28 |
|
Clays |
0.0001 |
The performed correlation between point values of filtration coefficients on individual wells and lithological columns of wells described according to a single lithological scale for the entire array of information, was used to form the matrix of filtration inhomogeneity of model layers. Since a whole number of aquifers wedge out as they approach the Gulf of Finland, a special gridding algorithm was used to imitate their geometry. The layers were wedging out by setting the planned inhomogeneity. Thus, several lithological varieties with markedly different filtration coefficients can be simultaneously present in one model layer. Final values of filtration coefficients were taken from the calibration results of the filtration model (Table 4).
To assess the degree of hydraulic association of the Quaternary aquifer and three zones of the Lomonosov aquifer, the amplitudes of groundwater level fluctuations before the construction of the first stage of the LNPP-2 were analyzed according to regime observation data (Table 5). At a qualitative level, it can be stated (data from wells 2n and 1n) that the hydraulic association of the middle zone of the Lomonosov aquifer and the upper aquifers is quite good. The association proceeds via the hydrogeological windows along the axes of paleovalleys, which are cutting the Cambrian deposits at the LNPP-2 site (Fig.2).
Table 5
Amplitudes of groundwater level fluctuations in aquifers (2007)
|
Date |
Quaternary (well 1n) |
Lomonosov |
||||||
|
Absolute elevation, m |
Amplitude, m |
Upper zone (well 2n) |
Middle zone (well 3n) |
Lower zone (well 4n) |
||||
|
Absolute elevation, m |
Amplitude, m |
Absolute elevation, m |
Amplitude, m |
Absolute elevation, m |
Amplitude, m |
|||
|
April |
22.98 |
0.07 |
20.93 |
0.15 |
20.58 |
0.14 |
20.89 |
0.08 |
|
22.92 |
0.01 |
20.93 |
0.15 |
20.52 |
0.08 |
20.92 |
0.11 |
|
|
May |
22.96 |
0.05 |
20.95 |
0.17 |
20.60 |
0.16 |
20.88 |
0.07 |
|
23.09 |
0.18 |
20.95 |
0.17 |
20.71 |
0.27 |
20.85 |
0.04 |
|
|
23.06 |
0.15 |
20.96 |
0.18 |
20.52 |
0.08 |
20.84 |
0.03 |
|
|
June |
22.94 |
0.03 |
20.66 |
–0.12 |
20.49 |
0.05 |
20.82 |
0.01 |
|
22.90 |
–0.01 |
20.73 |
–0.05 |
20.33 |
–0.11 |
20.73 |
–0.08 |
|
|
22.85 |
–0.06 |
20.68 |
–0.10 |
20.30 |
–0.14 |
20.75 |
–0.06 |
|
|
July |
22.79 |
–0.12 |
20.63 |
–0.15 |
20.26 |
–0.18 |
20.72 |
–0.09 |
|
22.85 |
–0.06 |
20.70 |
–0.08 |
20.27 |
–0.17 |
20.76 |
–0.05 |
|
|
22.82 |
–0.09 |
20.68 |
–0.10 |
20.27 |
–0.17 |
20.78 |
–0.03 |
|
|
August |
22.66 |
–0.25 |
20.54 |
–0.24 |
20.24 |
–0.20 |
20.75 |
–0.06 |
|
22.51 |
–0.40 |
20.40 |
–0.38 |
20.13 |
–0.31 |
20.72 |
–0.09 |
|
|
22.84 |
–0.07 |
20.74 |
–0.04 |
20.26 |
–0.18 |
20.78 |
–0.03 |
|
|
September |
22.92 |
0.01 |
20.79 |
0.01 |
20.48 |
0.04 |
20.81 |
0.00 |
|
23.02 |
0.11 |
20.86 |
0.08 |
20.51 |
0.07 |
20.81 |
0.00 |
|
|
October |
22.77 |
–0.14 |
20.81 |
0.03 |
20.54 |
0.10 |
20.81 |
0.00 |
|
23.08 |
0.17 |
20.91 |
0.13 |
20.60 |
0.16 |
20.83 |
0.02 |
|
|
23.10 |
0.19 |
20.95 |
0.17 |
20.63 |
0.19 |
20.88 |
0.07 |
|
|
23.07 |
0.16 |
20.89 |
0.11 |
20.61 |
0.17 |
20.87 |
0.06 |
|
|
Mean value |
22.91 |
– |
20.78 |
– |
20.44 |
– |
20.81 |
– |
The behaviour of groundwater levels in the lower zone of the Lomonosov aquifer differs significantly from other layers (well 4n). Annual amplitudes of water level fluctuations in the lower zone do not exceed 20 cm. Thus, we can state that the lower zone of the Lomonosov aquifer has a weak hydraulic association with the upper aquifers.
Hydraulic relationship of surface and groundwater in the numerical filtration model is controlledby the kinetic constant α, which is controlled by the filtration coefficient k′and thickness m' of the underlying aquiclude:
Kinetic constant α in the model determines the Qs flow through the aquiclude:
where w is river width inside the block, m; L river length inside the block, m; hs water level in river, m; h groundwater level, m; C = awL conductance, m2/day.
Conductance С was selected on the model in the process of calibration based on general geometry and structure of the groundwater flow as well as other indirect data: for the Voronka River C = 200 m2/day; for drainage ditches С = 1,000 m2/day.
Calibration of the model was carried out in a stationary setting for 2013 based on the observation data of groundwater levels in 26 wells and the measurement results of drainage water volume into the construction pit of the first stage of the LNPP-2 (Table 6). Based on the calibration results, each layer is assumed to be isotropic in terms of filtration properties.
Table 6
Results of model calibration
|
Well number |
Absolute elevation of groundwater level, m |
||
|
Actual value |
Design value |
Difference |
|
|
1 |
19.33 |
18.40 |
0.93 |
|
2 |
18.46 |
18.49 |
0.03 |
|
3 |
16.21 |
15.46 |
0.75 |
|
4 |
16.21 |
15.60 |
0.61 |
|
5 |
16.21 |
15.55 |
0.66 |
|
6 |
19.28 |
19.91 |
0.63 |
|
7 |
18.65 |
18.69 |
0.04 |
|
8 |
16.75 |
16.13 |
2.76 |
|
9 |
19.32 |
19.71 |
0.39 |
|
10 |
17.40 |
16.78 |
0.62 |
|
11 |
18.57 |
18.70 |
0.13 |
|
12 |
18.56 |
18.01 |
0.55 |
|
13 |
18.58 |
18.60 |
0.02 |
|
14 |
16.28 |
16.78 |
0.50 |
|
15 |
20.00 |
20.42 |
0.42 |
|
16 |
14.42 |
14.46 |
0.04 |
|
17 |
17.26 |
17.09 |
0.17 |
|
18 |
17.26 |
16.90 |
0.36 |
|
19 |
16.58 |
16.50 |
0.08 |
|
20 |
18.77 |
18.41 |
0.36 |
|
21 |
5.95 |
6.16 |
0.21 |
|
22 |
18.25 |
17.40 |
0.85 |
|
23 |
15.28 |
15.21 |
0.07 |
|
24 |
15.73 |
16.47 |
0.74 |
|
25 |
16.93 |
16.46 |
0.47 |
|
Drainage water discharge, m3/day |
|||
|
Long-run annual averages |
Design value |
||
|
Drain ditch |
600-650 |
577 |
|
Discussion of results
Before the start of construction work and commissioning of the first stage of the LNPP-2, piezometric surface of groundwater was characterized by a relatively smooth pressure drop in both aquifers from the recharge area in the east to the water discharge zone in the west into the Gulf of Finland (Fig.7, a). Average pressure gradient is about 0.01 m/m including that within the FGUP “FEO” site. Streamlines characterizing the migration trajectories of radionuclides in the area of the RW storage facilities, as follows from the modelling results, have the same prevailing direction – from east to west (Fig.7, a). Most of the flow is intercepted by a drainage ditch near the LNPP-1, the other part is intercepted by a ditch running along the perimeter of the FGUP “FEO” and WPC LNPP-1 sites.
Modeling showed that the commissioning of the drainage of the first stage of the LNPP-2 leads to formation of a depression surface in aquifers within the model area (Fig.7, b). The maximum decrease in the center of the depression funnel is 10-12 m. There is also a slight (tens of centimeters) decrease in groundwater levels at the southern boundary of the FGUP “FEO” site. Ongoing changes in underground hydrodynamics significantly affect the structure of the flow near the RW storage (Fig.7, b). However, there is still a watershed between the two sites, so the main flow direction of the contaminated groundwater remains the north-western one – towards the Gulf of Finland.
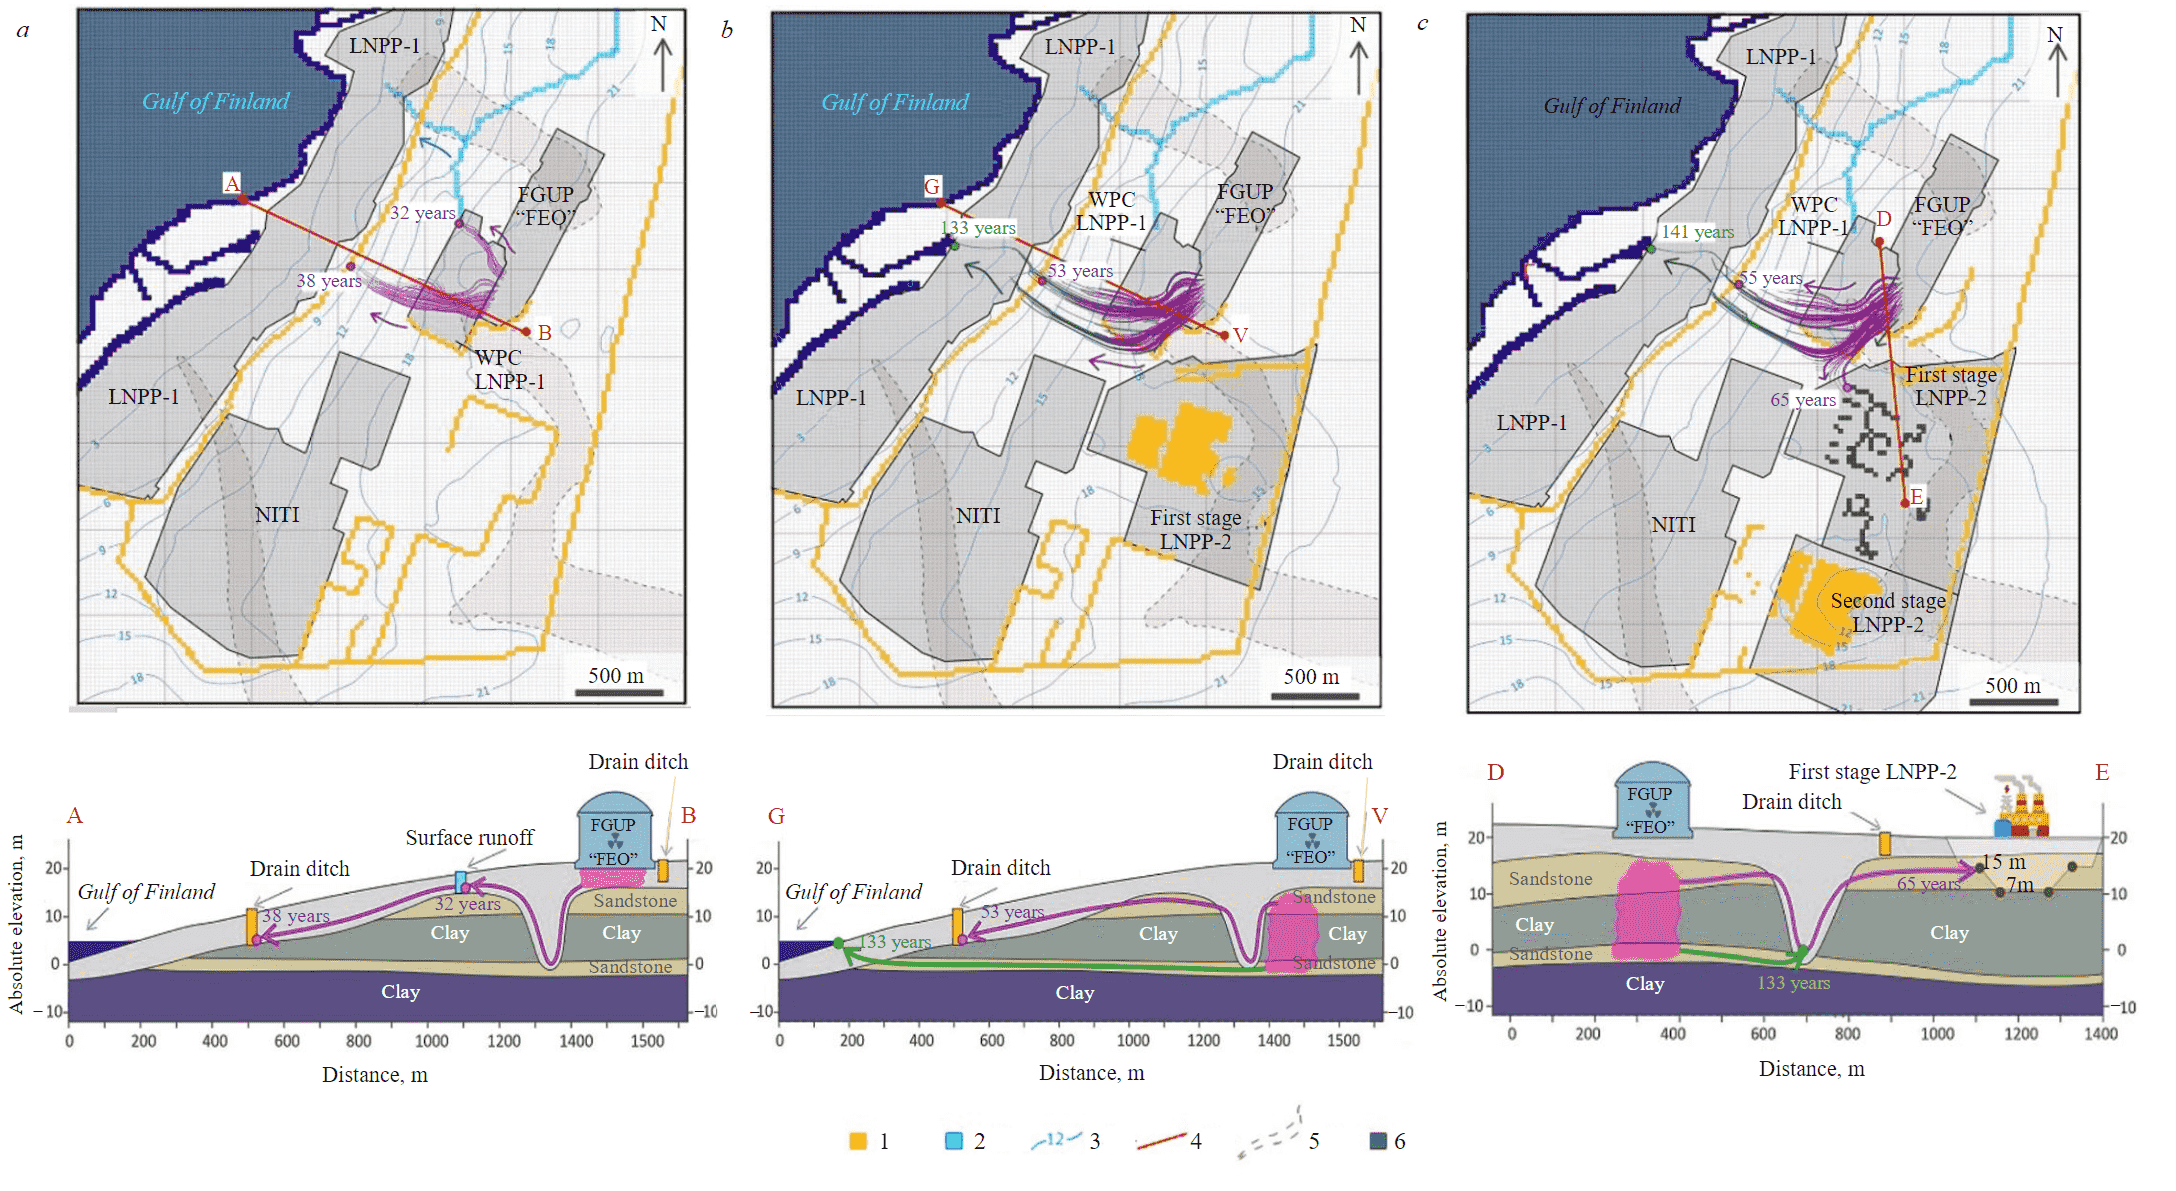
Fig.7. Structure of filtration flow with elements of groundwater flow network in plan and in section: a – natural regime (prior to the start of the LNPP-2 construction; b – after commissioning of the first stage; c – after commissioning of the second stage) 1 – drains; 2 – surface flow; 3 – hydroisobaths of the first aquifer from the surface; 4 – section line; 5 – projection of paleovalley on to the surface; 6 – drainage system of the first stage of the LNPP-2 Green colour shows migration routes in the lower Lomonosov aquifer, purple colour – in the middle Lomonosov and Quaternary aquifers
Drainage of the second stage of the LNPP-2 leads to additional “deformation” of the groundwater flow network: there is “branching” of a part of the model streamlines from the general north-western direction (Fig.7, c). Predictive calculations show that the conditionally neutral component in the contamination halo in this case will reach the LNPP-2 drainage system. This requires approximately 65 years, which is longer than the design working life of the NPP (60 years).
As can be seen in the sections (Fig.7), the structure of the groundwater flow is largely controlled by the presence of paleovalleys, which perform the function of “lithological windows” providing a connection between the aquifers. Radionuclides present in the Quaternary aquifer migrate through one of these “windows” deep into the water-bearing strata, so the Lomonosov aquifer becomes the main transporter of radioactive contamination (section E-F in Fig.7, c). Naturally, this effect increases the migration time of the components due to the growing migration path length.
Dissolved 90Sr and 137Cs, in contrast to an inert tracer, are sorbed and retained by soils. If the calculations take into account the sorption delay factor, which was determined from the monitoring data at the FGUP “FOE” site and amounted to R = 1.58-1.66, then it can be stated with confidence that these radionuclides should move one and a half times slower, i.e., for 90Sr and 137Cs, the characteristic residence time in the aquifers will be about 100 years.
Conclusion
To ensure the safe construction and operation of the NPP, it is necessary to assess the impact on the environment. An analysis of radionuclide composition of groundwater and their possible migration routes within the territory of operating and projected NF in the IA under changing hydrodynamic conditions was carried out.
Detailed radiochemical studies of groundwater composition within the existing sites of various NF and between these sites showed the absence of significant radioactive contamination of groundwater. The contents of controlled radionuclides (tritium, 90Sr, 137Cs) are at the level of background activities (with the exception of tritium) or exceed these values no more than 2-3-fold, which is insignificant from the viewpoint of the current quality standards (NRB-99/2009). An exception is the site of groundwater contamination associated with leakages of radioactive solutions from the RW storage facilities of the FGUP “FEO” (1970-1990). Also, the analysis of monitoring data on this site made it possible to estimate the approximate rates of tritium migration with groundwater flow under natural conditions (u = 1.4-2.3 m/year) and the parameters of sorption retention of fission products (R = 1.58-1.66 ).
To predict a possible impact of the forming contamination halo on the quality of groundwater withdrawn by the drainage system of the projected LNPP-2, a hydrogeological model of the industrial area was developed. Its validation required a generalization of the entire volume of engineering surveys at the facility for more than 50 years. The database underlying the model includes more than 1,500 geological columns of wells, dozens of experimental filtration tests of wells as well as long observation series of the radiation state of groundwater. The constructed model allowed a detailed analysis of the impact of the new facility (LNPP-2) on changes in the hydrogeological environment of the area. Evidence on the decisive role of rock lithology variability in the character of hydrodynamic association of aquifers in local areas has been obtained, which required the involvement of groundwater radiation monitoring data, which is a new element in the development of notions about the hydrogeological conditions of the study area.
Modelling results showed that the depression funnel forming during the operation of the LNPP-2 drainage system reaches the southern boundary of the FGUP “FEO” RW storage site, where a technogenic halo of groundwater contamination is recorded. Thus, the migration direction of dissolved radionuclides changes, which is confirmed by the deformation in the structure of the network of groundwater flow constructed according to the modelling results.
Predictive calculations within the concept of convective transport (taking into account the experimentally determined sorption delay factor) showed that the existing radioactive halo represented by relatively long-lived isotopes of strontium and cesium (90Sr and 137Cs) will migrate towards the LNPP-2 for about 100 years before the radioactively contaminated water becomes a part of water of the power plant drainage system. The risk of radionuclides release into the biosphere over the planned 60-year period of the NPP operation is insignificant.
References
- Groundwater contamination (tritium) at nuclear plants. Report Associated with Events. URL: https://www.nrc.gov/reactors/operating/ops-experience/grndwtr-contam-tritium.html (accessed 20.12.2021).
- Implementation of new nuclear power plant units, at the Paks site. URL: https://www.paks2.hu/documents/20124/60835/Chapter+1-8.pdf/24ebe701-777f-d79d-47d9-12cf2994a3d0 (accessed 20.12.2021).
- Jakimavičiūtė-Maselienė V., Cidzikienė V. Modelling of tritium transport in the underground water from hypothetical reactor at the new NPP site in Lithuania. Progress in Nuclear Energy. 2015. Vol. 80, p. 1-6. DOI: 10.1016/j.pnucene.2014.11.018
- Creation of a system for industrial environmental monitoring in hydrocarbon producing and transporting companies оf Western Siberia. Journal of Mining Institute. 2016. Vol. 221, p. 737-741. DOI: 10.18454/PMI.2016.5.737
- Golovina E.I., Grebneva A.V. Some Aspects of Groundwater Resources Management in Transboundary Areas. Journal of Ecological Engineering. 2021. Vol. 22. N 4, p. 106-118. DOI: 10.12911/22998993/134037
- Nureev R.R., Pashkevich M.A., Isakov A.E. Assessment of the technogenic impact of the korkinsky coal mine. Proceedings Of the International Forum-Contest of Young Researchers, 18-20 April 2018, St. Petersburg, Russia. Topical Issues of Rational Use of Natural Resources, 2019, p. 371-377.
- Erzova V.A., Rumynin V.G., Sudarikov S.M. et al. Influence of North-West Nuclear Complex Facilities on Groundwater Contamination (Leningrad Region). Bulletin of the Tomsk Polytechnic University. Geo Assets Engineering. Vol. 322. N 9, p. 30-42 (in Russian). DOI: 10.18799/24131830/2021/9/3351
- Kryshev I.I., Pahomov A.Y., Brykin S.N. et al. Assessment and Prognosis of Radioecological Impact of the Radioactive Wastes Storage Sites of the “North-West Territorial District” Leningrad Branch of Fgup “Rosrao”. Izvestiya vuzov. Yadernaya Energetika. 2012. N 3, p. 44-52 (in Russian).
- Rumynin V.G., Vladimirov K.V., Nikulenkov A.M. et al. The status and trends in radioactive contamination of groundwater at a LLW-ILW storage facility site near Sosnovy Bor (Leningrad region, Russia). Journal of Environmental Radioactivity. 2021. Vol. 237. N 106707. DOI: 10.1016/j.jenvrad.2021.106707
- Novovoronezh NPP: experience of using object monitoring data on subsoil condition and mathematical modelling for assessing the impact on ground and surface water. Atomic Energy. URL: http://www.atomic-energy.ru/articles/2014/09/29/51806 (accessed 20.12.2021).
- Moench A.F. Flow to a well of finite diameter in a homogeneous, anisotropic water table aquifer. Water Resources Research. 1997. Vol. 33. Iss. 6, p. 1397-1407. DOI: 10.1029/97WR00651
- Neuman S.P. Analysis of pumping test data from anisotropic unconfined aquifers considering delayed gravity response. Water Resources Research. 1975. Vol. 11. Iss. 2, p. 329-345. DOI: 10.1029/WR011I002P00329
- Hantush M.S. Flow to wells in aquifers separated by a semipervious layer. Journal of Geophysical Research. 1967. Vol. 72. Iss. 6, p. 1709-1720. DOI: 10.1029/JZ072i006p01709
- Javandel I., Witherspoon P.A. Analytical solution of a partially penetrating well in a two-layer aquifer. Water Resources Research. 1983. Vol. 19. Iss. 2, p. 567-578. DOI: 10.1029/WR019I002P00567
- Cooper H.H., Bredehoeft J.D., Papadopulos I.S. Response of a finite diameter well to an instantaneous charge of water. Water Resources Research. 1967. Vol. 3. Iss. 1, p. 263-269. DOI: 10.1029/WR003i001p00263
- ANSDIMAT – software for analytical modelling of groundwater wells. URL: http://ansdimat.com/ru/ (accessed 20.12.2021).
- Das B.S., Kluitenberg G.J. Moment analysis to estimate degradation rate constants from leaching experiments. Soil Science Society of America Journal. 1996. Vol. 60. Iss. 6, p. 1724-1731. DOI: 10.2136/SSSAJ1996.03615995006000060017X
- Espinoza C., Valocchi A.J. Temporal moments analysis of transport in chemically heterogeneous porous media. Journal of Hydrologic Engineering. 1998. Vol. 3. Iss. 4, p. 276-284. DOI: 10.1061/(ASCE)1084-0699(1998)3:4(276)
- Goltz M., Huang J. Analytical Modeling of Solute Transport in Groundwater. New Jersey: John Wiley & Sons, 2017, p. 272. DOI: 10.1002/9781119300281
- Goltz M.N., Roberts P.V. Using the method of moments to analyze three-dimensional diffusion-limited solute transport from temporal and spatial perspectives. Water Resources Research. 1987. Vol. 23. Iss. 8, p. 1575-1585. DOI: 10.1029/WR023i008p01575
- Valocchi A.J. Validity of the local equilibrium assumption for modeling sorbing solute transport through homogenous soils. Water Resources Research. 1985. Vol. 21. Iss. 6, p. 808-820. DOI: 10.1029/WR021I006P00808
- Young D.F., Ball W.P. Column experimental design requirements for estimating model parameters from temporal moments under nonequilibrium conditions. Advanced Water Resources. 2000. Vol. 23. Iss. 5, p. 449-460. DOI: 10.1016/S0309-1708(99)00047-0
- Yu C., Warrick A.W., Conklin M.H. A moment method for analyzing breakthrough curves of step inputs. Water Resources Research. 1999. Vol. 35. Iss. 11, p. 3567-3572. DOI: 10.1029/2000WR900322
- Pang L., Goltz M., Close M. Application of the method of temporal moments to interpret solute transport with sorption and degradation. Journal of Contaminant Hydrology. 2003. Vol. 60. Iss. 1-2, p. 123-134. DOI: 10.1016/S0169-7722(02)00061-X
- Fioreze M., Mancuso M.A. MODFLOW and MODPATH for hydrodynamic simulation of porous media in horizontal subsurface flow constructed wetlands: A tool for design criteria. Ecological Engineering. 2019. Vol. 130, p. 45-52. DOI: 10.1016/j.ecoleng.2019.01.012
- Antonov V.V., Ustyugov D.L. Problems of creating live simulation mathematical models of large regions. Journal of Mining Institute. 2003. Vol. 153, p. 115-116 (in Russian).
- Harbaugh A.W. MODFLOW-2005, the U.S. Geological Survey modular ground-water model – the Ground-Water Flow Process. Techniques and Methods. 2005, p. 253. DOI: 10.3133/tm6A16
- Hughes J.D., Russcher M.J., Langevin Ch.D. et al. The MODFLOW Application Programming Interface for simulation control and software interoperability. Environmental Modelling & Software. 2022. Vol. 148. N 105257. DOI: 10.1016/j.envsoft.2021.105257
- Pollock D.W. User guide for MODPATH version 7 – A particle-tracking model for MODFLOW. Open-File Report: U.S. Geological Survey. 2016, p. 35. DOI: 10.3133/ofr20161086
- Pietrzak D. Modeling migration of organic pollutants in groundwater – Review of available software. Environmental Modelling & Software. 2021. Vol. 144. N 105145. DOI: 10.1016/j.envsoft.2021.105145
- Li L., Boucher A., Caers J. SGEMS-UQ: An uncertainty quantification toolkit for SGEMS. Computers & Geosciences. 2014. Vol. 62, p. 12-24. DOI: 10.1016/j.cageo.2013.09.009
- Remy N., Boucher A., Wu J. Applied Geostatistics with SGeMS: A User's Guide. Cambridge: Cambridge University Press, 2009, p. 98. DOI: 10.1017/CBO9781139150019
- Dashko R.E., Lebedeva Y.A. Improving approaches to estimating hydrogeological investigations as a part of engineering survey in megacities: case study of St. Petersburg. Water Resources. 2017. Vol. 44. Iss. 7, p. 875-885. DOI: 10.1134/S009780781707003X
- Protosenya A.G., Lebedev M.O., Karasev M.A., Belyakov N.A. Geomechanics of low-subsidence construction during the development of underground space in large cities and megalopolises. Journal of Mechanical and Production Engineering Research and Development. 2019. Vol. 9. Iss. 5, p. 1005-1014. DOI: 10.24247/ijmperdoct201989
- Dashko R.E., Lokhmatikov G.A. Upper Kotlin clays of Saint Petersburg region as the base and environment of unique structures: engineering geological and geotechnical analysis. Journal of Mining Institute. 2022, p. 1-11. (Online first) DOI: 10.31897/PMI.2022.13
- Rumynin V.G., Pankina E.B., Yakushev M.F. et al. Assessment of nuclear industry complex impact on groundwater and adjacent natural objects (Sosnovy Bor town, Leningrad Region). St. Petersburg: izd-vo Sankt-Peterburgskogo universiteta, 2003, p. 248 (in Russian).
- ЕGАSМRО. URL: http://egasmro.ru/ru/data (accessed 20.12.2021).