
The use of unmanned aerial photography for interpreting the technogenic transformation of the natural environment during the oilfield operation
- 1 — Ph.D., Dr.Sci. Professor Perm State National Research University ▪ Orcid ▪ Elibrary ▪ Scopus ▪ ResearcherID
- 2 — Ph.D. Associate Professor Perm State National Research University ▪ Orcid
- 3 — Laboratory Assistant Perm State National Research University ▪ Orcid
- 4 — Postgraduate Student Perm State National Research University ▪ Orcid
- 5 — Laboratory Assistant Perm State National Research University ▪ Orcid

Abstract
The traditional approach to monitoring observations of the technogenic processes development in oilfields, which consists in determining the concentration of marker pollutants in various natural environments, does not provide the necessary completeness of information and the efficiency of its receipt. The paper considers an example of expanding the range of observations due to unmanned aerial photography and a number of other methods. Interpretation signs (for panchromatic survey) were determined that register such consequences of technogenic transformation of the natural environment as mechanogenesis, bitumization, and halogenesis. Technogenic mechanogenesis is understood as a physical violation of the integrity of ecosystems, the movement of soils and grounds. Bitumization is expressed in the migration of petroleum hydrocarbons through soils, ground, surface, subsurface, and underground waters, and their destruction. Salt migration in these media is defined as halogenesis. The most reliable indicators are linearly elongated areas of dead forests, dark red spots in drying microdepressions and reservoirs. It was found out that the oilfield impact on the raised bog leads to anthropogenic eutrophication, the introduction of plant species, uncharacteristic coenotic groups, the replacement of subshrubs with grasses, and morphometric changes in forest pine. In the peat deposits of the disturbed area, an unusual interlayer of whitish, undecomposed moss was recorded. The moment of the beginning of a pronounced technogenic transformation was registered in the course of work with the archive of multispectral space images. Continuous remote sensing with the help of unmanned aerial photography and interpretation by sedimentological, geobotanical methods significantly expand the possibilities of studying the technogenic transformation of the natural environment. To ensure environmental safety, it is advisable to develop remote methods and technologies to include them in the environmental monitoring system.
None
Introduction
The sustainable development of regions such as the Perm Territory is associated with the protection of the natural environment during the extraction of minerals. Ensuring environmental safety in oil production is largely determined by the level of environmental monitoring. Mechanical disturbances and pollution cause technogenic transformation of the natural environment during the construction and operation of oil production facilities. A pronounced effect occurs through thermal effects [1] and air pollution by ingredients [2] when associated gas is burned. Zonal features of local ecosystems (soil type, climate) significantly affect the nature of the transformation processes manifestation [3].
The generally accepted methods for observing the oilfield impact are based on sampling the main natural media (soil, water, air) [4] and identifying the concentration of marker pollutants: hydrocarbons, chlorides, phenols, trace elements and polycyclic aromatic hydrocarbons (PAHs) [5]. The resulting estimates are important, but do not enable to unambiguously interpret the direction of technogenic processes and determine their speed in space and time. The use of a set of remote (unmanned aerial photography), geoinformation, geochemical, geobotanical methods significantly improves the spatial and dynamic possibilities of studying technogenic processes [6].
Currently, it is possible to assess the environmental state using the unmanned aerial vehicles (UAVs) [7]. They enable to monitor areal, point, and linear sources of environmental pollution, which allows to determine the levels of pollution quickly and accurately [8]. The expediency and prospects of the development of metrological and methodological support for this type of observations are shown [9].
Space imaging with panchromatic and multispectral cameras makes it possible to identify oilfield infrastructure facilities [10], wood cutting areas [11], soil subsidence areas [12], relatively large oil spills [13-15], and to evaluate vegetation dynamics using the available long-term image archives [16]. Aerial photography in panchromatic mode also makes it possible to record facilities of the oilfield infrastructure, spills, cuttings [17], and monitor the integrity of pipelines [18]. In this case, the accuracy increases, and the areal detection threshold decreases. With the help of multispectral imaging, the dynamics of the restoration of disturbed lands [19] and oil spills [20] is monitored. Lidar (laser) survey is used to assess the state of the forest stand [21]. Thermal imaging aerial photography is widely used to identify oil spills [22, 23], including those on water bodies [24], to determine soil moisture parameters [25], and to identify oil and gas leaks from pipelines [26].
Significant experience in the sedimentological study of peat cores to identify oilfield technoge-nesis is known from publications based on material from Western Siberia [27, 28]. The most obvious direction is the analysis of microelements distribution along the profile [29-31], and their radial migration over time [32, 33]. The geochemical composition of the peat stratum is affected not only by oil hydrocarbons, but also by the accompanying mineral salt components contained in drilling fluids [34, 35]. This area of research is interested in the experience of using UAVs for environmental mo-nitoring of polymetallic sulphide ore deposits [36].
When studying vegetation in technogenic areas of oilfields, researchers pay attention to changes in the share of ecological groups in the composition of the phytocenosis structure, the introduction and increase in the abundance of individual groups of grasses [37], and morphological changes in tree stand [38]. There is experience in the use of UAVs for the restoration of the natural environment by bioremediation methods [39].
The purpose of the work is to test the use of unmanned aerial photography for interpreting the technogenic transformation of the natural environment during the oilfield operation.
The work was carried out on the example of an oilfield in the north of the Perm Territory in the bog complex of the middle taiga.
Methodology
The general pattern illustrating the stages of the natural environment study during the oilfield operation is shown in Fig.1.
Aerial photography in the optical part of the spectrum was carried out on 22 August 2021, together with employees of OOO Finko, Unmanned Systems Group of Companies (Izhevsk) at an altitude of 400 m above the Earth’s surface. The overlap of images is 55 %, the shooting was made every 70 m of the flight. A Russian-made Supercam S350F unmanned aerial vehicle was used. As a result of processing aerial photography materials, an orthophotomap was created, which for the convenience of work is divided into 71 tiles, with a total volume of 14.6 GB. The resolution of the resulting image is about 8.5 cm/pixel.
The orthophotomaps were interpreted in the ArcGIS (ESRI) software, based on visual features of targets that are univocally identified in images of a given resolution.
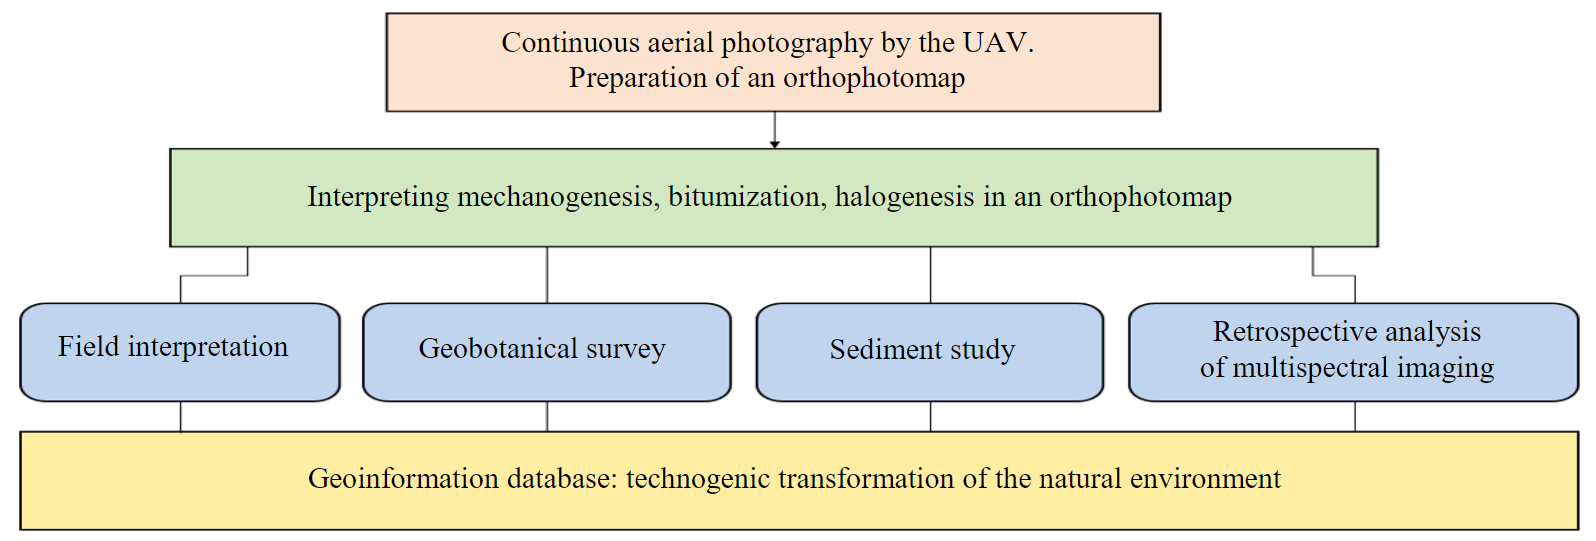
Fig.1. Research stages
Oilfield technogenesis is caused by arrangement, accidents, leaks, and process emissions during the development of oilfields. It is usually divided into three main types: mechanogenesis, bitumization, halogenesis. Mechanogenesis is the movement of grounds, the physical violation of the integrity of natural complexes, soil, and vegetation cover. The most active mechanogenesis is manifested at the stages of construction and arrangement of oilfield facilities. Bitumization is the pollution of the natural environment and its components by oil hydrocarbons. The technogenic halogenesis develops under the influence of highly mineralized flows with bottom waters, in which the most significant are water-soluble chlorides, as well as sulphates and carbonates. The main reasons for the occurrence of bitumization and halogenesis are violations of the tightness of equipment caused by imperfection of technology and violation of process regulations. Interpretation of each type of technogenesis has its own characteristics.
Interpreting the mechanogenesis consequences
Throughout the study area, 10 types of anthropogenic targets were identified, the appearance of which is directly or indirectly due to the development of an oilfield (Fig.2). Oilfield facilities: well sites, pipelines, power lines, roads, quarry, artificial water bodies, other technical facilities; targets of mixed origin: cutting areas, forest roads, and recrea-tion sites. Cutting areas may be caused either by the exploitation of forest resources or by the needs of oil production; forest roads spontaneously arise due to the maintenance of technical facilities; people working near water bodies tend to create recreation sites.
For the identification of mechanogenesis, direct interpretation signs were sufficient: target shape, colour, special signs of oilfield facilities (square outline of the embankment around the wells). Identification of some targets was more difficult. In this case, indirect signs were additionally used: a shadow of a characteristic shape cast by power transmission towers; long straight sections with destroyed forest vegetation were a sign of the right-of-way of oil, gas, water pipelines, power lines; cutting areas (in contrast to windblows and windbreaks) were marked by traces of the movement of heavy logging equipment. Data on annual forest losses [40] were used to refine the identified cuttings. Information about the location and names of individual pipeline strings was taken from the Internet resource “Public Cadastral Map” (Rosreestr).
Interpreting the bitumization consequences
The manifestations of bituminization were determined by the presence of contrasting dark (black) spots on the surface of the ground or water bodies (Fig.3, a), which presumably corresponded to oil spills in open areas. Dark red spots in drying microdepressions, presumably associated with the intensive development of certain groups of aquatic organisms, also indicated hydrocarbon pollution. Linearly elongated deadwood strips (dead stands) were considered as sites subjected to bitumization or halogenesis (Fig.3, b).
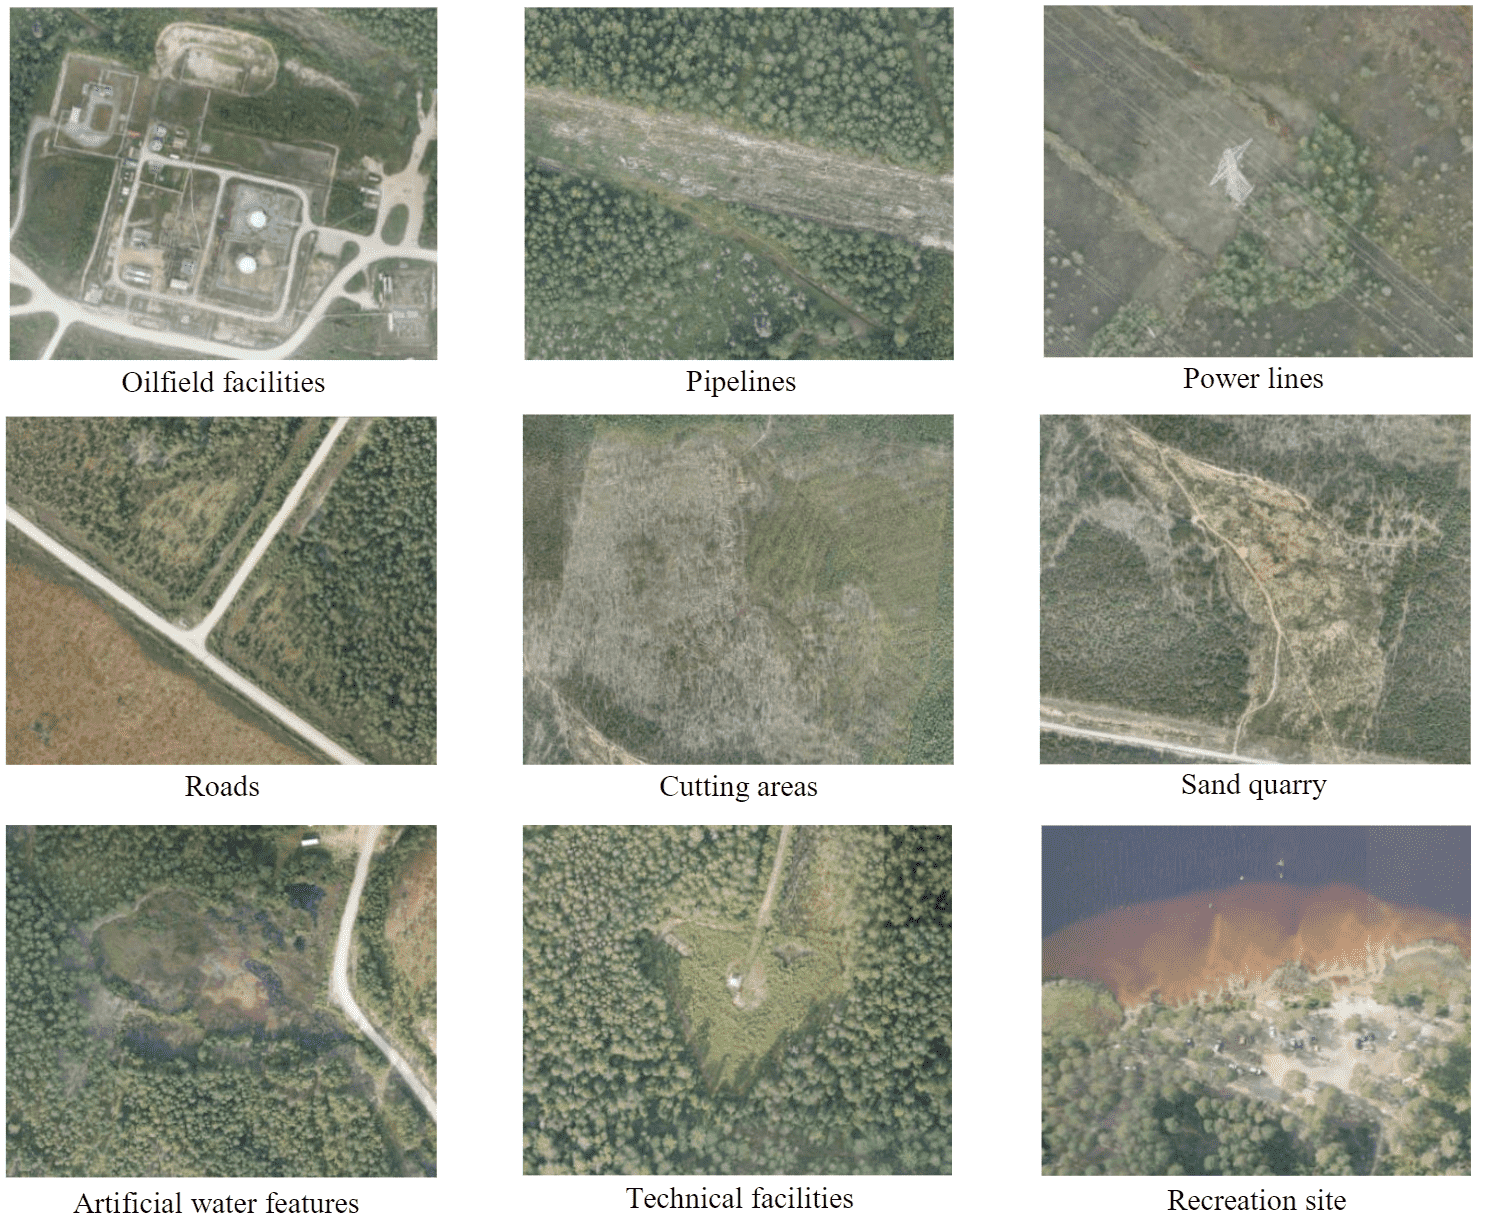
Fig.2. Fragments of an orthophotomap with examples of interpretable consequences of mechanogenesis
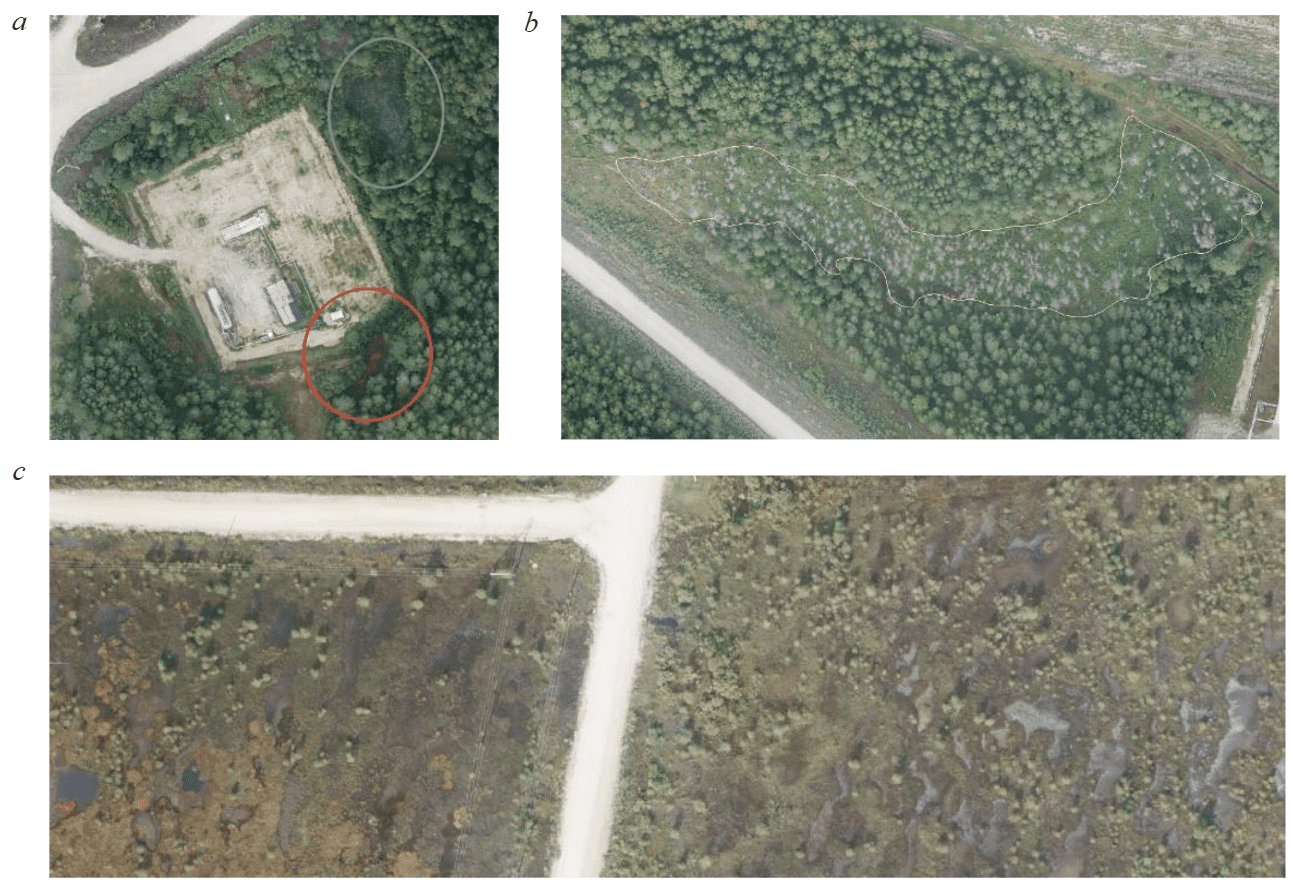
Fig.3. Fragments of the orthophotomap with areas showing signs of bitumization – black and dark red spots (a) and linearly elongated stripes of a drying up forest stand (b), halogenesis – a change in the reservoir colour to bluish-whitish in the right side of the picture (c)
Interpreting the halogenesis consequences
Based on the existing experience from a similar study [41], which the team of authors carried out in the southern part of the Perm Territory on a karst area, three types of interpretation signs were used to search for the sites with technogenic halogenesis manifestation:
- turbidity of the water and change of the reservoir colour to bluish-whitish (Fig.3, c), due to a large number of nanometre dispersed particles of hydrogenated sulphates (dissolution of gypsum) in water [42];
- change of the reservoir colour to green-yellow (presumably due to the intensive growth of halophilic aquatic vegetation, algae in saline reservoirs);
- accumulation of white manifestations (spots) on the ground surface.
Preparation of a geoinformation database for the study
To process information in the ArcGIS (ESRI) software, a geoinformation database was created. The oilfield area fully belongs to the drainage basin of the lake with an area of 3419.8 ha. In addition to the initial data (orthophotomaps, lake catchment boundaries, oilfield facilities), the database includes the interpretation results, two poly-gonal layers for mechanogenesis (117 sites), halogenesis and bitumization (35 sites) targets. Additionally, all sites with the consequences of mechanogenesis were divided into three categories in relation to oilfield activities: not related to oilfields; probably due to oil production; directly related to oil production and related processes.
Field interpretation
During the stage of direct field work (field interpretation), all selected sites were surveyed. In places where the fact of spills was confirmed, characteristic traces of technogenesis were photofixed, geobotanical descriptions were made. At one of the sites, two peat cores were taken to identify the features of petroleum hydrocarbons distribution in the peat profile. Work records were kept in the field observation log.
Study of peat deposits
Drilling of the peat bog and taking of the peat core were carried out using a peat (Russian) drill, according to GOST 17644-83. All extracted deposits were photographed. After the description, half-metre cores were packed in a polyethylene film and placed in PVC plastic pipes to prevent deformation during transportation and storage.
Geobotanical survey
To determine the nature of changes in the vegetation cover as a result of oil pollution, route studies were carried out, and three test sites (TS) were made for geobotanical descriptions: two in the key area and one in the undisturbed (background) area of the bog. Geobota-nical descriptions were made according to generally accepted methods. Coenotic analysis of the flora of communities formed on a peat bog was carried out according to the characteristics of the species presented in the database “Flora of vascular plants of Central Russia” of the Institute of Mathematical Problems of Biology of the Russian Academy of Sciences. Analysis of the composition of communities in terms of nutrition and moisture conditions was performed according to the species descriptions of the Plantarium project. To evaluate ecotopes by environmental scales, floristic lists were processed using the EcoScaleWin software. The phytoindication analysis of the communities was carried out according to the generally accepted scales of Ellenberg and Landolt.
Analysis of multispectral satellite imagery of past years
Satellite images were taken from the open USGS EarthExplorer archive. The analysis was performed using Landsat – 5, 7, 8 images for 1999-2022. A total of 27 images were analysed in two modes: in natural colours and by the NDVI index, which was calculated as an average value for the pixels corresponding to the studied areas.
Discussion of the results
Interpretation of aerial photography materials in the optical part of the spectrum
As a result of the orthophotomap interpretation, 117 sites subjected to mechanogenesis were identified in the study area (Fig.4), with a total area of 358 ha, which corresponds to 9.0 % of the catchment area.
Mechanogenesis, directly caused by oil production, is slightly more than half (51.3 %) of the area of all sites subjected to mechanical impact. Most of these sites are roads, commercial water and oil pipelines, oilfield facilities and a sand pit; 48 % of all sites of mechanogenesis are not associated with oil production, these are cutting areas, to a lesser extent forest roads and recreation sites.
The share of linear infrastructure facilities of the field was 81.1 %, and areal 18.9 %, which is comparable with the results obtained [43] for the Middle Ob region (corresponding to the subzones of the middle and northern taiga), where the average (for 25 deposits) share of linear targets was 84.97 %, and areal 15.11 %. Similar values were noted on the example of 17 fields in the Tyumen Region [44]: the share of linear targets is 18.9 %, areal 21.1 %.
In the surveyed area, the share of lands disturbed during the laying of roads was 1.7 %, 1/3 of which is a spontaneously developing network of forest roads. It was established [45] that for the southern steppe zone these indicators are 4.2 %, for the forest-steppe zone 2.5 %. The markedly lower proportion of areas occupied by road right-of-ways correlates well with the prevalence of natural geographic barriers. In this case, the main barrier to the wide development of the road network is the high swampiness of the area.
Orthophotomaps interpreting revealed 35 sites that had signs of bituminization and halogenesis. Their total area was 7.78 ha. Most of the sites (24) were identified by the presence of black contrasting spots, six sites were identified by the change in the colour of the reservoir to bluish-whitish, three linear sections of deadwood, two dark red depressions were noted. Such interpretation signs of halogenesis as a change in the colour of the reservoir to yellow-green and white salt manifestations on the soil surface were not identified.
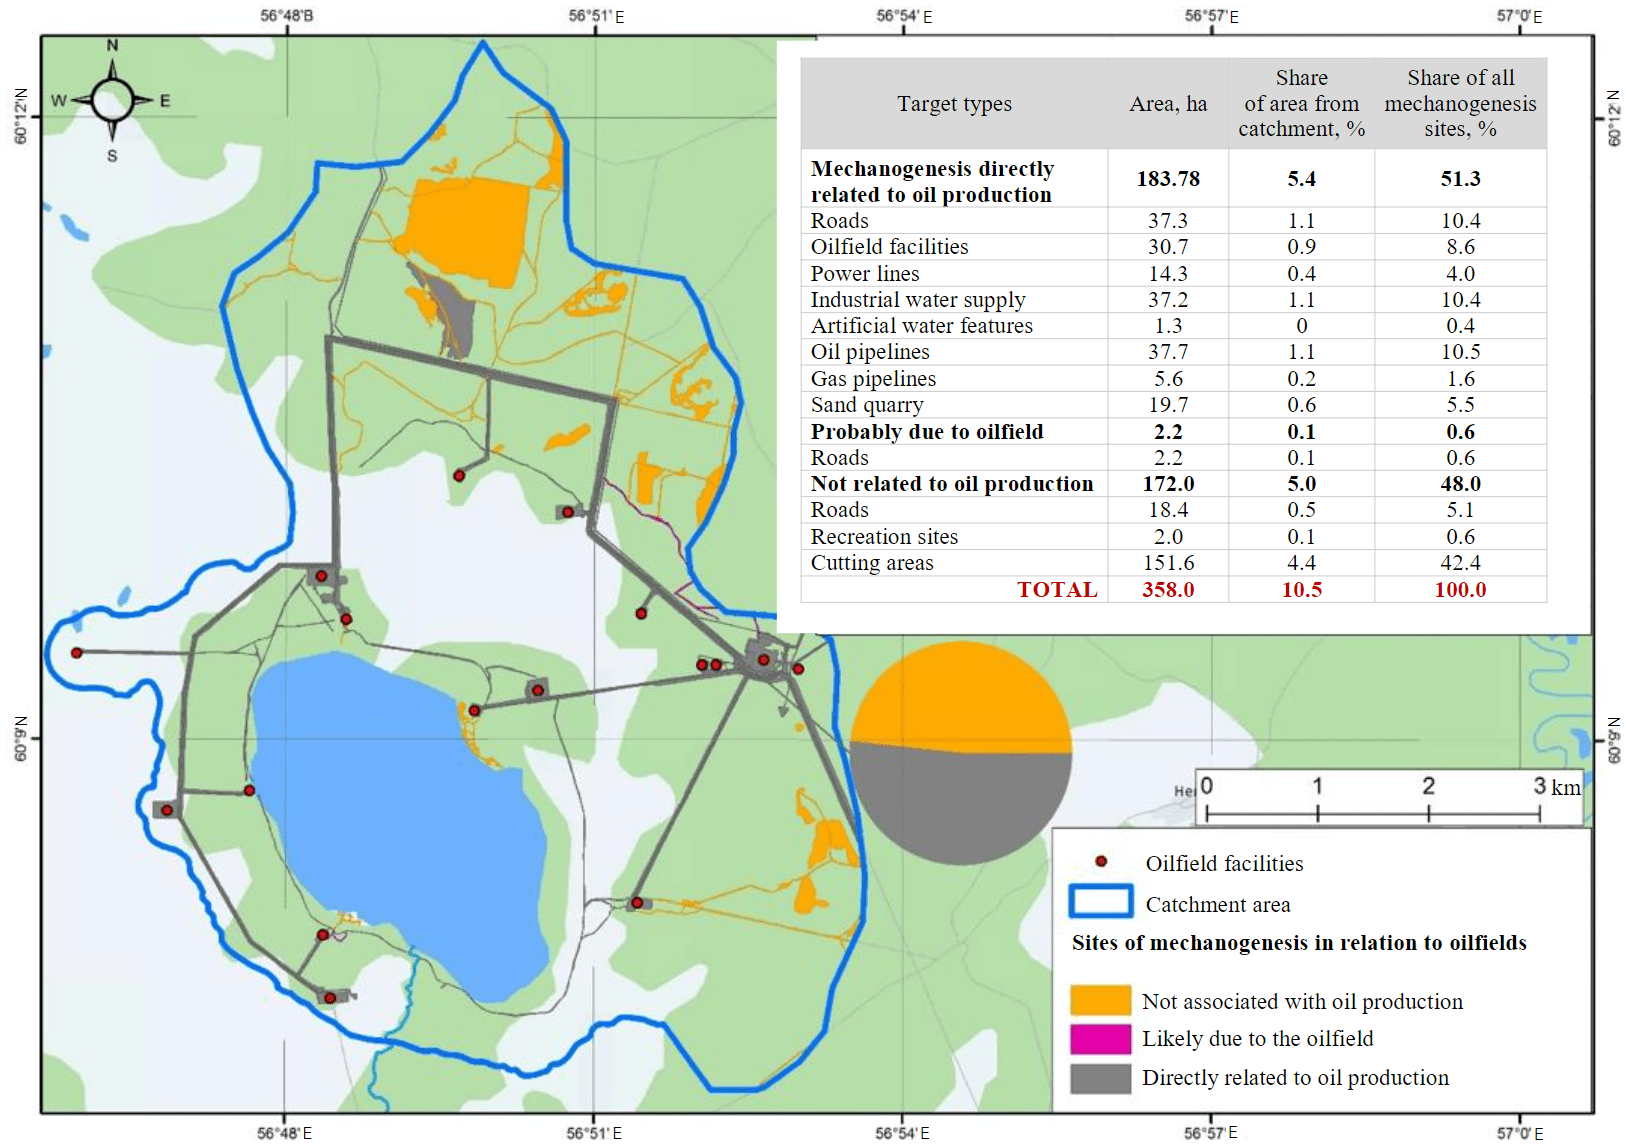
Fig.4. Consequences of mechanogenesis in the study area
Field interpretation
A direct field survey found clear signs of bituminization and halogenesis in 10 of the 35 previously interpreted sites. Of these, six sites identified by the bluish-whitish colour of the water surface (a sign of halogenesis), upon direct examination, turned out to be a series of bog microdepressions, on the surface of which a dense oily film was noted (a manifestation of bitumization). The presumable source of hydrocarbons is an infield oil pipeline running along the nearest road. Only two of the 24 sites previously marked by the presence of black spots showed clear signs of bituminization: oil films on the water surface, an intense smell of hydrocarbons, and extensive areas of destroyed or significantly suppressed vegetation.
In both sites noticed during the interpretation by the presence of dark red spots, during the field survey, signs of oilfield technogenesis were found: abundant red-brown sediment on the surface of the soil, ground vegetation, bottom of a drying reservoir, as well as intensive degradation of the grass-subshrub layer and damage to the needles of the lower tiers of the branches of young pines in the raised bog. The source of impact is probably the oilfield facilities adjacent to these areas. However, the processes that caused such changes are still unclear, which requires additional research.
In two sites of a linearly elongated deadwood strip, the results obtained do not yet allow us to draw an unambiguous conclusion. Their appearance may be associated both with a disturbance of the natural flow of groundwater due to the construction of a road or pipeline, and with an oil and/or bottom water spill (salt pollution).
In 23 sites, the field survey did not reveal any obvious signs of bituminization and halogenesis. In one case, such a site was a strip of dead wood, where the forest stand died as a result of flooding along the industrial site outline. The remaining 22 sites, where preliminary interpretation was not confirmed by field data, were distinguished in the orthophotomap by the presence of black spots on the surface of water or soil. The most typical example (17 sites) of this kind are depressions tens of metres long, formed along roads, pipelines, and well sites. Three more much longer (to 0.2-0.5 km) sites, distinguished by dark colour, were natural flow formations, slightly lowered relative to the ge-neral surface of the raised bog and distinguished from the neighbouring ones by a different composition of vegetation. In two small lake-like reservoirs, previously marked by dark colour, signs of bitumization and halogenesis were also not found. The pronounced dark colour of the reservoir is due to peat particles suspended in the water.
It was determined that in the conditions of high swampiness and the widespread distribution of peat soils, the dark colour of natural and technogenic waterlogged depressions is the norm. The efficiency of such a sign is extremely low, in this case it was only 8 %. Thus, for wetlands, a dark colour may not be a sufficient interpretation sign of bituminization. Such areas require additional verification. Promising directions for the research development should be considered the multispectral, thermal imaging, lidar surveys, and their further analysis.
On the contrary, other interpretation signs (dark red colour of water bodies and drying depressions, bluish-whitish colour of water bodies) turned out to be noticeably more effective. If for the karst area in the zone of mixed coniferous and broad-leaved forests, the bluish-whitish colour indicated the halogenesis [42], then in the studied wetland area of the middle taiga, this colour may indicate hydrocarbon pollution.
Studies using airborne spectral photography obtained from UAVs make it possible to calculate the depth and chemical composition of watercourses [46]. Multispectral aerial photography also enables to compile maps of vegetation and other indices (primarily NDVI). The indices show well the current functional state of vegetation and may indicate the restoration of disturbed areas [19]. Aerial photography with a thermal imager, especially in combination with other types of surveys, can provide additional useful information. Thus, oil pollution on the surface of water and soil is detected by a noticeable temperature difference between the contaminated and background areas [24].
In conditions of high swampiness and evenness of the topography, the difference in elevation marks, which determines the flow direction, can be minimal. Neither large-scale topographic maps nor global digital elevation models can provide the required accuracy of slope estimation. Aerial photography with a laser sensor enables to create a high-precision digital topography model. Such data make it possible to unambiguously determine the directions of substances migration and establish the source of pollution. In addition, lidar survey makes it possible to determine the thickness of the hydrocarbon film on the surface of water bodies [23].
Sedimentological study
In the area near the well cluster N 4, during the field survey, the most pronounced manifestations of oilfield technogenesis were found. The site is on a raised bog and has a tongue-like elongated shape with a total length of more than 300 m. Within its limits there are extensive areas of complete or partial degradation of vegetation, spots of open peat, a sharp smell of hydrocarbons, pronounced oil films, damage to the needles of the lower tiers of branches of young pines. The probable causes of the transformation are as follows: oil spill, drill cuttings spill, bottom water spill or mixtures of these substances.
Two peat cores were taken at the site: in the undisturbed background area and within the transformed area. During a visual inspection of the stratigraphic column from the disturbed area, an unusual layer (21-34 cm) of light, undecomposed sphagnum was found. There was no such layer in the background area.
We associate the presence of such an unusual interlayer with the effect of sphagnum “preservation” in anaerobic and highly humid conditions that form during an oil spill. Thus, during oil spills, the upper layers of oligotrophic soils adsorb high-molecular fractions: resins and asphaltenes [26], which have an enveloping effect that prevents aerobic conditions for the sphagnum cushion of the raised bog. As a result, oil hinders the oxidative destruction of organic matter, which is necessary for decomposition processes in the upper layer of the peat bog [31].
The further prospect of studying the obtained sediment is associated with the analysis of the concentration of a number of elements and compounds. The distribution of heavy metals in the peat core is different during bitumization and halogenesis. It was found out [29] that in case of oil pollution, the concentrations of marker elements and compounds along the peat bog profile are distributed as follows: pollutant metals (Ti, V, Cr, Ni, Zr, Ba, and lanthanides) accumulate in the upper layer, labile Cl, Ca, Mn, Zn, Cu, Sr with light fractions of hydrocarbons over time migrate from the upper layers into the depth of the profile.
The ratio of the total content of Ni:Br in the ash of contaminated peat serves as an indicator of the predominant nature of (oil or salt) pollution [32]. It was established that the ratio Ni:Br > 1.5 is a sign of oil pollution, the ratio Ni:Br < 0.7 is salt, and at 0.7 < Ni:Br < 1.4 it is mixed.
Comparative microbiological analysis also seems promising. Thus, it was determined that under the influence of oil technogenesis, transformations of microbiota and microbiological activity occur in peat soil. Under conditions of oil pollution, the number and ratio of trophic groups of soil microorganisms change [47].
Analysis of flora and vegetation
In the area near the well cluster N 4 with the most pronounced manifestations of oilfield technogenesis, three geobotanical test sites 20×20 m were made.
Test site N 1 was made at the base of the transformed area. A completely dead tree layer of 19 Pinus sylvestris L. is up to eight m high, the diameter of the trunks reaches 22 cm. Closer to the limits of the pollution spot, there is an undergrowth of Pinus sylvestris, Betula pendula Roth, Populus tre-mula L. about 10 years old. The vitality of young trees is good, the current year increment of pine trunks reaches 25 cm. There are no shrubs. Herbs and shrubs grow in patches, within which the total plant cover is 30 %. Such herbaceous-shrub spots cover about 40 % of the test site surface, the rest of the area is bare. The predominant species is Calamagrostis epigeios (L.) Roth, few specimens of Typha latifolia L. and Tussi-lago farfara L., small spots of Oxycoccus palustris Pers., Juncus alpinus Vill were also found. Eriophorum polystachyon L., Carex canescens L., Carex rostrata Stokes grow closer to the test site edges. There is no living moss cover.
Test site N 2 was made 150 m from the limit of the degraded area. Single trees of Pinus sylvestris grow only closer to the limits of the polluted spot and have a height of up to seven metres, a trunk diameter of up to 18 cm. Trees are very weakened, dying. Closer to the spot limits, undergrowth of Pinus sylvestris, Betula pendula, Populus tremula is also common. The undergrowth vita-lity is good. The current year increment of forest pine undergrowth reaches 30 cm, but the needles on the lower tiers of the branches in some young trees are reddish, but do not crumble. Probably necrosis occurred in the current or last year. Of the shrubs closer to the spot limits, there are single specimens of Betula nana L. Subshrubs are absent. Grasses in the central part of the TS grow less frequently (total plant cover 20 %) than on its outskirts (total plant cover 40 %). Juncus alpinus and Carex canescens predominate in the spot centre. They are mixed with Eleocharis palustris (L.) Roem. et Schult. and Carex limosa L. Farther from the spot centre, a ring of Calamagrostis epigeios, Eriophorum vaginatum L. appears. Here, there are more Carex canescens and Carex limosa. Carex rostrata and Carex juncella (Fries) Th. Fries grow on the western side of the spot. Closer to the edge there is Alopecurus aequalis Sobol. There is no living moss cover.
The background test site was made in a pine-cotton grass-subshrub-sphagnum bog. An extremely sparse stand of Pinus sylvestris is to 3 m high, the trunk diameter reaches 11 cm. Single trees above three metres are dry. The diameter of their trunks reaches 19 cm. The tallest tree is 5.5 m high. Two old dry aspens with traces of fire on the trunks are noted. The current year increment of young spe-cimens of forest pine does not exceed 10 cm, the plants are twisted, but are in satisfactory condition, there is no reddening of the needles. Betula nana forms an extremely sparse but evenly distributed shrub layer with an average height of 0.7 m. The grass-subshrub layer is formed by Eriophorum vaginatum and marsh subshrubs Chamaedaphne calyculata (L.) Moench, Ledum palustre L., Andromeda polifolia L., Oxycoccus palustris, with a total plant coverage of 50 %. A continuous moss cover is formed by sphagnum mosses.
On the sites made in the disturbed area, the diversity of plant species is higher than in the background one. A significantly greater current annual increment of forest pine and the appearance in the undergrowth of Betula pendula and Populus tremula, which are uncharacteristic for oligotrophic bogs, were noted. Tree undergrowth is formed closer to the spot periphery; it is absent in the axial part of the tongue-like spot. Shrubs are almost absent. The open surfaces of the peat bog are overgrown with herbs, sedges, cotton grasses, spike rushes, rushes, graminaceous plants. Moss cover is absent.
The obtained conclusions confirm the study of the anthropogenic dynamics of plant communities in oligotrophic bogs at oilfields in the forest zone of Western Siberia, where the following signs were also noted in the contaminated areas: the appearance in the tree-shrub layer of species atypical for raised bogs, rushes and young plants [37]; morphometric changes in young wood pine specimens [38]; the appearance of graminaceous plants in the herbaceous-shrub layer; active development of mesotrophic and eutrophic species, mainly from the Cyperaceae family [37], as well as suppression and decrease in the abundance of oligotrophic shrubs.
A comparative analysis of the represented flora groups identified according to various indicators, coenotic, attitude towards moisture, towards nutritional conditions (trophicity), demonstrated the complex composition of communities in the degraded area and the relatively simple one in the background area (Fig.5), which is due to a mosaic change in the trophicity and humidity of the habitat after the influx of oil organic matter. The former groupings of raised bog vegetation preserved, and pioneer species characteristic of disturbed, meadow, and zonal forest communities added.
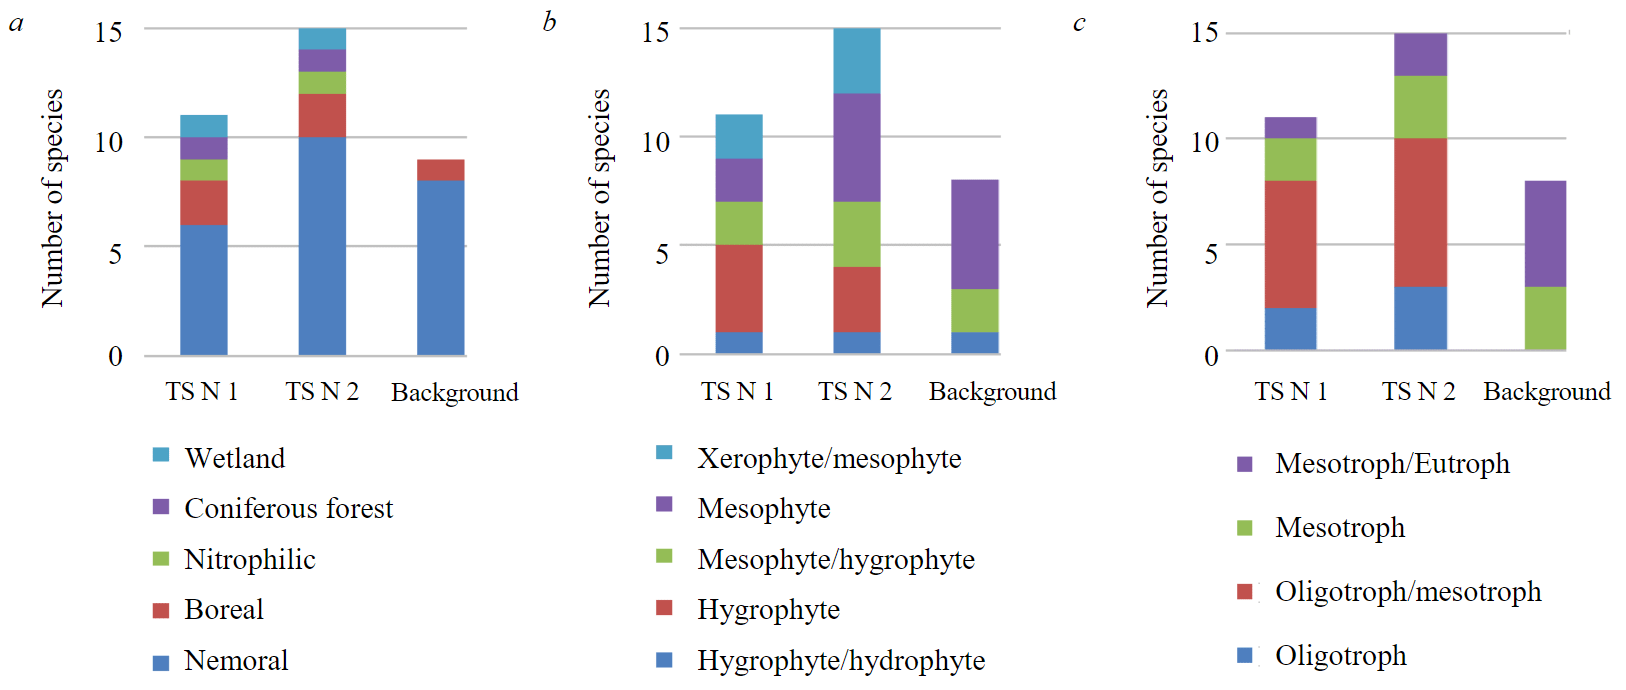
Fig.5. Comparative analysis of the represented flora groups (species) identified according to the following indicators: a – coenotic; b – attitude towards moisture; c – nutritional conditions (trophicity)
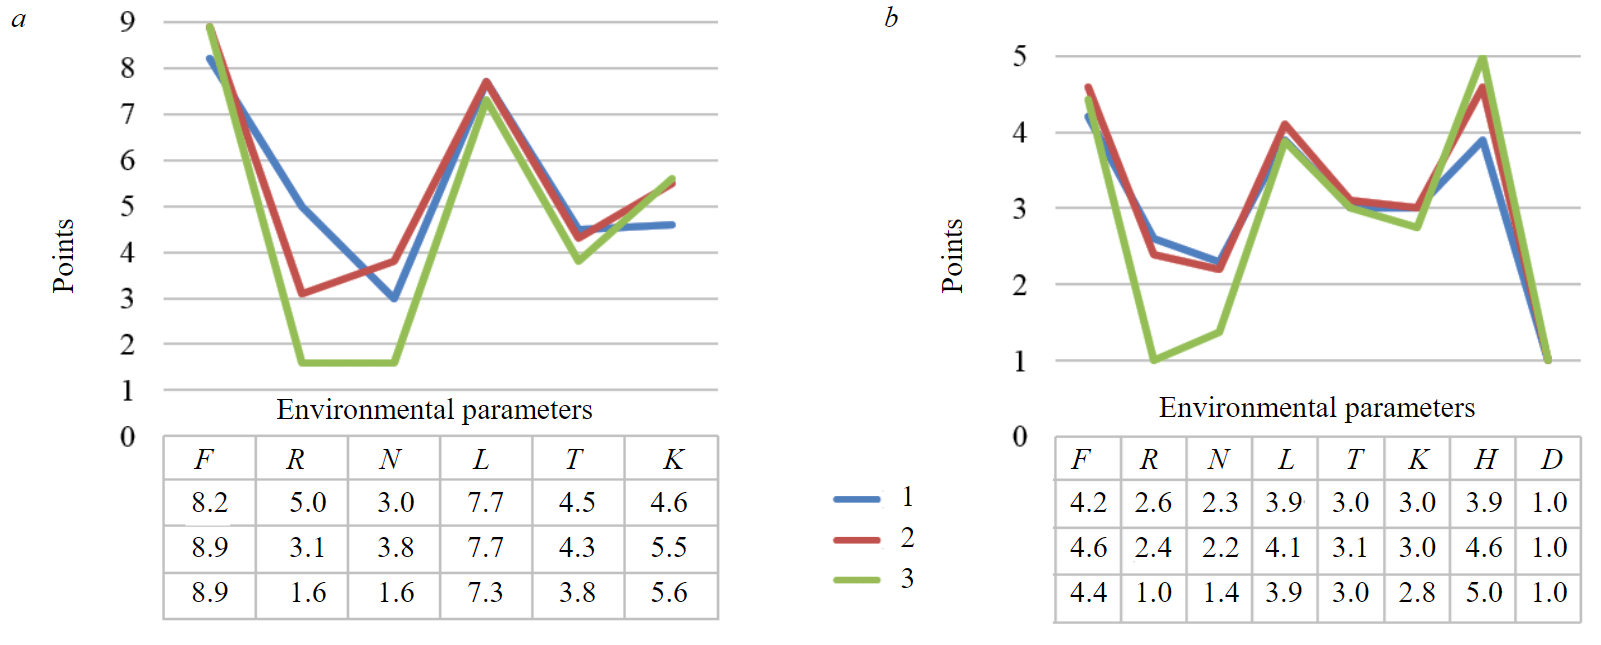
Fig.6. Environmental parameters of habitats according to the Ellenberg (a) and Landolt (b) scales F – soil moisture; R – soil acidity; N – soil richness with mineral nutrition elements; L – photophily; T – temperature; K – continentality; H – humus content in the soil; D – particle size distribution in the soil (aeration deficiency); 1 – TS N 1; 2 – TS N 2; 3 – background
Restorative succession after the influx of petroleum hydrocarbons occurs with the participation of species of various coenotic groups, while the undisturbed community consists only of species of the wetland group and Pinus sylvestris (coniferous forest group). Regarding the degree of moisture, the difference between the background and disturbed areas is the appearance of species that prefer both less (mesophytes) and more (hygrophytes/hydrophytes) humidified habitats. The analysis (Fig.5) also demonstrated an increase in the degree of trophicity in contaminated areas, which was previously recorded by studies conducted in Western Siberia [37, 38].
When assessing the environmental parameters of habitats on the Ellenberg scale (Fig.6, a), the test sites of the background and transformed areas clearly differ in soil acidity and richness in mi-neral nutrition elements. If the background area is characterized by plants that grow only on acidic soils, then for both sites in the disturbed area, plants are noted that can grow on both strongly acidic and neutral soils. Indicators of soil richness in mineral nutrition elements are much higher in the disturbed area.
The analysis of environmental parameters on the Landolt scale (Fig.6, b) demonstrates similar results: noticeable differences are observed in the degree of acidity and nutritional conditions. The disturbed area is characterized by secondary anthropogenic eutrophication, which is manifested by an increase in the role of mesotrophic and eutrophic species, a weakening of the positions of oligotrophs and oxylophytes, the appearance in the community of species with different requirements for moisture conditions and representatives of coenotic groups uncharacteristic of it, the replacement of subshrubs with herbs, changes in the morphometric characteristics of forest pine undergrowth.
Effective identification and monitoring of oilfield technogenesis are possible on the basis of phytoindication at various levels, organismal, population, coenotic. The prospect of geobotanical research lies in the determination of regional phytoindicators of various types of pollution (salt, oil, mixed) similarly to studies conducted in Western Siberia and the Kaliningrad Region [37] and determining the history of restorative succession in ecosystems of various types.
Reconstruction of the technogenic transformation history
For the site near well cluster N 4 with the most pronounced manifestations of oilfield technogenesis, the history of technogenic transformation was reconstructed using satellite imagery for 1999-2022.
An analysis of the dynamics of plants photosynthetic activity (Fig.7) in the disturbed and background areas showed that until 2010, the NDVI index values in both areas coincided or were very close, the average difference was about 0.006. Since 2010, there is a noticeable (relative to the background) decrease in NDVI in the disturbed area. In 2010-2016, the average difference in the indices is 0.1. In 2017-2022, the average difference between the NDVI of the background and the disturbed area increases to 0.2, and in some years reaches 0.3-0.4.
It is noteworthy that the analysis of the same images in natural colours gives different results. Thus, a noticeable difference between the background and disturbed areas begins to appear only from 2012, i.e., two years later than in plant photosynthetic activity (NDVI). Such a discrepancy indicates that the first reaction of vegetation to the oilfield impact is a drop in photosynthetic activity, and only then a change in the species composition and changes in the structure of the phytocenosis occur.
The main threshold parameter that determines the possibility of using satellite imagery should be considered the area and configuration of the site limits with signs of oilfield technogenesis. For reliable identification, it is necessary that the damaged area occupies at least five to six pixels. For sensors installed on Landsat vehicles, this corresponds to an area of at least 4,500 m2, and for Sentinel-2, at least 900 m2.
It may be more informative to use an improved version, the Enhanced Normalized Difference Vegetation Index (ENVI), which, in addition to the near infrared, also uses green and blue channels. This is evidenced by the experience of identifying sites subject to hydrocarbon pollution in Indonesia [13].
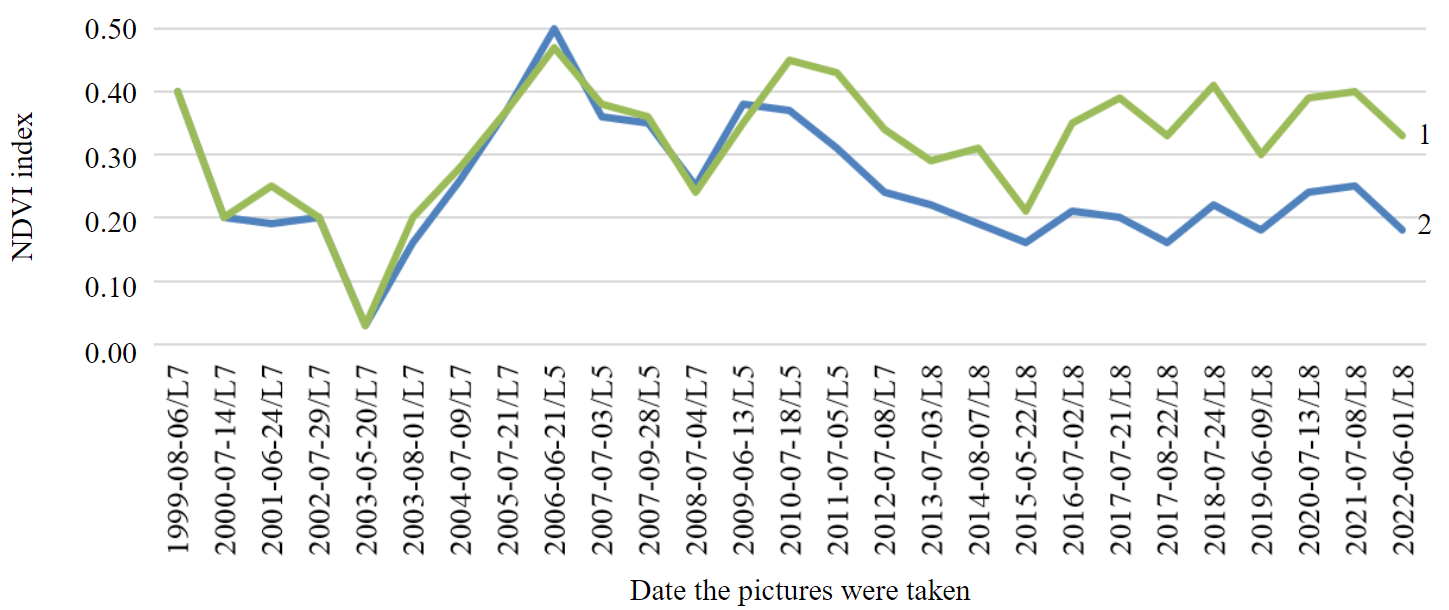
Fig.7. Dynamics of NDVI in the disturbed and background areas 1 – background; 2 – disturbed
Conclusion
A continuous survey of the study area of the operated oilfield using aerial photography by an unmanned aerial vehicle made it possible to identify such technogenic processes in the natural environment as mechanogenesis, bitumization, and halogenesis.
Interpreting aerial photography in the visible part of the spectrum makes it possible to unambiguously determine all the main manifestations of mechanogenesis. Directly caused by the oilfield
operations, mechanical disturbances of the natural environment amounted to no more than half (51.3 %) of the area of all such sites in the field. The second part of the changes is related to forest management, spontaneous network of forest roads, and recreation.
Sites subject to bitumization and halogenesis are interpreted less reliably. The least reliable interpretation sign was contrasting black spots on the surface of water or soil, which in most cases were due to a natural cause, the ubiquitous distribution of peat soils in the study area. More reliable signs of the oilfield technogenesis development were extensive continuous strips of deadwood, as well as red and dark red spots in drying microdepressions and reservoirs. A direct field examination is neces-sary for an unambiguous interpretation of the results. It will also be promising to identify regional phytoindicators for various types of technogenesis.
A retrospective analysis of the multispectral space imagery (NDVI dynamics) makes it possible to determine the moment of the technogenic impact beginning. Due to the influx of petroleum hydrocarbons into the natural complex, technogenic bitumization begins, the water and air conditions of peat soils for the background phytocenosis worsen, and plants reduce their photosynthetic activity, which reflects the NDVI index. To apply this method, only relatively large disturbed areas are suitable, at least 0.45 ha (when using Landsat – 5, 7, 8). To identify smaller ones, it is promising to use specially equipped unmanned aerial vehicles.
A comparative analysis of the stratigraphy of peat cores in the background area of the raised bog and the area transformed during bitumization revealed a layer (more than 10 cm) of light undecomposed sphagnum in the transformed area. Presumably, this is due to the effect of sphagnum “preservation” in anaerobic and highly humid conditions, which are formed when oil inflows.
Changes in the vegetation of the raised bog under the influence of oilfield technogenesis are caused by a change in the air-water regime of peat, which leads to a decrease in the role of oligotrophs and increases the importance of mesotrophs and eutrophs in the plant communities structure. The disturbed habitats partially preserved the former groups of raised bog vegetation and pioneer species, characteristic of disturbed meadow and zonal forest communities, added. The changes in the vegetation cover of the raised bog recorded in the region of the middle taiga fir-spruce forests are similar to the data on the raised bogs of Western Siberia.
Thermal imaging, multispectral and lidar surveys in key areas and their analysis, as well as geochemical and microbiological studies of peat in various layers of collected peat cores should be considered promising areas of research.
The use of continuous remote sensing based on unmanned aerial photography and interpretation using sedimentological, geobotanical methods significantly expand the possibilities for studying the technogenic transformation of the natural environment. To ensure environmental safety, it is advisable to develop remote methods and technologies in order to include them in the environmental monitoring system.
References
- Porozova A., Sannikov P. Assessment of the impact of associated gas flaring on the radial growth of Pinus Sylvestris (Ozernoe oil field, Perm region, Russia). Anthropogenic Transformation of Nature. 2021. Vol. 7. N 2, p. 58-74 (in Russian). DOI: 10.17072/2410-8553-2021-2-58-74
- Baktybaeva Z.B., Suleymanov R.A., Valeev T.K. et al. Environmental and Hygienic Assessment of Ambient Air Pollution in Oil-Producing and Oil-Refining Areas of the Republic of Bashkortostan and Population Health Status. Public Health and Life Environment. 2020. N 2, p. 26-32 (in Russian). DOI: 10.35627/2219-5238/2020-323-2-26-32
- Bykova M.V., Pashkevich M.A. Assessment of oil pollution of soils of production facilities of different soil and climatic zones of the Russian Federation. Izvestiya Tula State University. Sciences of Earth. 2020. N 1, p. 46-59 (in Russian).
- Chizhova M.A., Khairullina L.I., Tuchkova O.A. Development principles and structure of environmental monitoring at oil production facilities. Vestnik Kazanskogo tekhnologicheskogo universiteta. 2015. Vol. 18. N 16, p. 290-292 (in Russian).
- Bachurin B.A. Ecology-geochemical estimation of oil degradation products under the hypergenesis condition. Anthropogenic Transformation of Nature. 2019. N 5, p. 8-14 (in Russian).
- Buzmakov S., Sannikov P., Sivkov D. et al. Development of geoinformation systems for environmental management and environmental safety in the areas of exploited oil deposits. Anthropogenic Transformation of Nature. 2021. Vol. 7. N 1, p. 102-127 (in Russian). DOI: 10.17072/2410-8553-2021-1-102-127
- Pashkevich M.A., Smirnov Y.D., Danilov A.S. Estimation of quality of environment with the use of small pilotless aircrafts. Journal of Mining Institute. 2013. Vol. 204, p. 269-271 (in Russian).
- Danilov A.S., Smirnov U.D., Pashkevich M.A. The system of the ecological monitoring of environment which is based on the usage of UAV. Russian Journal of Ecology. 2015. Vol. 46. N 1, p. 14-19. DOI: 10.1134/S1067413615010038
- Kremcheev E.A., Danilov A.S., Smirnov Yu.D. Metrological Support of Monitoring Systems Based on Unmanned Aerial Vehicles. Journal of Mining Institute. 2019. Vol. 235, p. 96-105 (in Russian). DOI:10.31897/PMI.2019.1.96
- Ferrarese F., Pappalardo S., Codato D. et al. High resolution satellite images for environmental monitoring of oil production in Western Amazon: the case of Yasuní National Park. AGILE 2017, 9-12 May 2017, Wageningen.
- Singh A., Kushwaha S.K.P. Forest Degradation Assessment Using UAV Optical Photogrammetry and SAR Data. Journal of the Indian Society of Remote Sensing. 2020. Vol. 49. N 3, p. 559-567. DOI: 10.1007/s12524-020-01232-2
- Mirzaii Z., Hasanlou M., Samieie-Esfahany S., Ajourlou P. Land Subsidence Monitoring in Azar Oil Field Based on Time Series Analysis. Proceedings of the 3rd International Electronic Conference on Remote Sensing, 22 May – 5 June 2019, Basel, Switzerland. MDPI, 2019. DOI: 10.3390/ECRS-3-06190
- Susantoro M.T., Wikantika K., Saepuloh A., Harsolumakso A. Utilization of Vegetation Indices to Interpret the Possibility of Oil and Gas Microseepages at Ground Surface. IOP Conference Series: Earth and Environmental Science. The 1st UPI International Geography Seminar 2017, 8 August 2017, Indonesia. 2018. Vol. 145. N 012012. DOI: 10.1088/1755-1315/145/1/012012
- Novokhatin V.V., Osipova N.G. Space monitoring of emergency oil spills within license areas in Western Siberia. Moscow Economic Journal. 2021. N 3, p. 57-63 (in Russian). DOI: 10.24412/2413-046Х-2021-10167
- Löw F., Stieglitz K., Diemar O. Terrestrial oil spill mapping using satellite earth observation and machine learning: A case study in South Sudan. Journal of Environmental Management. 2021. Vol. 298. N 113424. DOI: 10.1016/j.jenvman.2021.113424
- Soromotin A.V., Brodt L.V. Monitoring of Vegetation Cover during the Development of Oil and Gas Fields According to the Landsat Multispectral Survey Data. Tyumen State University Herald. Natural Resource Use and Ecology. 2018. Vol. 4. N 1, p. 37-49 (in Russian). DOI: 10.21684/2411-7927-2018-4-1-37-49
- Wanasinghe T., Gosine R.G., De Silva O. et al. Unmanned Aerial Systems for the Oil and Gas Industry: Overview, Applications, and Challenges. IEEE Access. 2020. Vol. 8, p. 166980-166997. DOI: 10.1109/ACCESS.2020.3020593
- Grib N., Melnikov A., Grib G., Kachaev A. Use of unmanned aerial systems for assessing the dynamics of hazardous engineering and geocryological processes on linear facilities. E3S Web of Conferences. 2020. Vol. 192. N 04006. DOI: 10.1051/e3sconf/202019204006
- Negara T., Jaya I.N.S., Kusmana C. et al. Drone image-based parameters for assessing the vegetation condition the reclamation success in post-mining oil exploration. Telkomnika (Telecommunication Computing Electronics and Control). 2021. Vol. 19. N 1, p. 105-114. DOI: 10.12928/TELKOMNIKA.V19I1.16663
- Hassani B., Sahebi M.R., Asiyabi R.M. Oil Spill Four-Class Classification Using UAVSAR Polarimetric Data. Ocean Science Journal. 2020. Vol. 55 (3), p. 433-443. DOI: 10.1007/s12601-020-0023-9
- Vepakomma U., Cormier D. Valuing forest stand at a glance with UAV based LIDAR. ISPRS – International Archives of the Photogrammetry, Remote Sensing and Spatial Information Sciences. 2019. Vol. XLII-2/W13, p. 643-647. DOI: 10.5194/isprs-archives-XLII-2-W13-643-2019
- Katkovsky L.V. Calculation of objects thermal imaging parameters from unmanned aerial vehicles. Doklady BGUIR. 2020. Vol. 18. N 2, p. 53-61 (in Russian). DOI: 10.35596/1729-7648-2020-18-2-53-61
- Al-Shammari A., Levin E., Shults R. Oil spills detection by means of UAS and low-cost airborne thermal sensors. ISPRS Annals of Photogrammetry, Remote Sensing and Spatial Information Sciences. 2018. Vol. IV-5, p. 293-301. DOI: 10.5194/isprs-annals-IV-5-293-2018
- De Kerf T., Gladines J., Sels S., Vanlanduit S. Oil Spill Detection Using Machine Learning and Infrared Images. Remote Sensing. 2020. Vol. 12 (24). N 4090. DOI: 10.3390/rs12244090
- Yurong Gao, Xugang Lian, Linlin Ge. Inversion model of surface bare soil temperature and water content based on UAV thermal infrared remote sensing. Infrared Physics & Technology. 2022. Vol. 125. N 104289. DOI: 10.1016/j.infrared.2022.104289
- Nooralishahi P., López F., Maldague X. A Drone-Enabled Approach for Gas Leak Detection Using Optical Flow Analysis. Applied Sciences. 2020. Vol. 11. N 1412. DOI: 10.3390/app11041412
- Vodyanitskii Yu.N., Avetov N.A., Savichev A.T. et al. Contents of chemical elements in peat soils salted with drill sewage waters at the oil production site in the Central Ob region. Agricultural Chemistry. 2013. N 1, p. 75-84 (in Russian).
- Kul’kov M.G., Vorob’ev D.S. identification of traces of oil contamination of biogenic sediments by solid-phase extraction combined with thin layer chromatography. Journal of Analytical Chemistry. 2017. Vol. 72. N 2, p. 217-225 (in Russian).DOI: 10.7868/S0044450217020074
- Vodianitsky Yu., Savichev A., Trofimov S., Shishkonakova E. Metals in oiled peat (Western Siberia). Dokuchaev Soil Bulletin. 2011. Vol. 67, p. 67-79 (in Russian). DOI: 10.19047/0136-1694-2011-67-67-79
- Trofimov S.Y., Arzamazova A.V., Kinzhaev R.R. et al. Mineralization of Organic Matter in the Oil-Polluted and Background Soils of the Middle Ob Region under Laboratory Conditions. Eurasian Soil Science. 2022. Vol. 55. N 4, p. 533-540. DOI: 10.1134/S1064229322040147
- Lednev A.V., Skvortsova I.A. Effects of oil pollution and meliorative additives on agrochemical properties of alluvial peat soils. Agrochemical Herald. 2017. N 3, p. 49-54(in Russian).
- Ditts L.Yu., Dudina T.N., Tsuskman E.I., Katunkina E.V. Geoenvironmental issues of oil production areas. Uspekhi sovremennogo estestvoznaniya. 2020. N 3, p. 72-77. DOI: 10.17513/use.37348
- Vodyanitskii Y.N., Avetov N.A., Trofimov S.Y. et al. Influence of oil and stratal water contamination on the ash composition of oligotrophic peat soils in the oil-production area (the Ob region). Eurasian Soil Science. 2013. Vol. 46. N 10, p. 1032-1041 (in Russian).
- Vodyanitskii Yu.N., Avetov N.A., Savichev A.T. et al. Laboratory determination of the solid phase composition of technogenic salted peat bog: possibilities and limitations. Moscow University Soil Science Bulletin. 2020. N 3, p. 39-46 (in Russian).
- Kozlov S.A., Avetov N.A., Savichev A.T. Geochemical features of ombrotrophic bogs and transitional mires under influence of drilling waste pits. Moscow University Soil Science Bulletin. 2017. N 4, p. 26-34 (in Russian).
- Danilov A., Smirnov Y., Petrova T., Pashkevich M. Using drones of preconstruction monitoring conducting in mining enterprise. International Journal of Ecology & Development. 2015. Vol. 30. Iss. 1, p. 36-42.
- Tyurin V.N. Changes in vegetation in contaminated areas of raised bogs (oilfields in Western Siberia). Zapadno-Sibirskie torfyaniki i tsikl ugleroda: proshloe i nastoyashchee: Materialy Pyatogo mezhdunarodnogo polevogo simpoziuma, 19-29 iyunya 2017, Khanty-Mansiisk. Khanty-Mansiisk: Natsionalnyi issledovatelskii Tomskii gosudarstvennyi universitet, 2017, p. 124-126 (in Russian).
- Avetov N.A., Shishkonakova E.A. A concept of trophy status in connection with anthropogenic eutrophication of raised bogs in the Khanty-Mansy Pre-Ob region. Dokuchaev Soil Bulletin. 2013. N 71, p. 36-51 (in Russian).
- Danilov A.S., Smirnov Yu.D., Pashkevich M.A. Use of biological adhesive for effective dust suppression in mining operations. Journal of Ecological Engineering. 2015. Vol. 16 (5), p. 9-14. DOI: 10.12911/22998993/60448
- Hansen M., Potapov P., Moore R. et al. High-Resolution Global Maps of 21st-Century Forest Cover Change. Science. 2013. Vol. 342. Iss. 6160, p. 850-853. DOI: 10.1126/science.1244693
- Khotyanovskaya Y., Buzmakov S., Sannikov P. Identification of oil mining technogenesis based on aerial photography data. Journal of Soils and Sediments. 2022. Vol. 23, p. 973-988. DOI: 10.1007/s11368-022-03357-y
- Plotnikova M.D., Medvedeva N.A., Bortnik A.A G. About the causes of water turbidity in the river Yasyl. Anthropogenic Transformation of Nature. 2019. N 5, p. 45-50 (in Russian).
- Moskovchenko D.V., Babushkina A.G., Idrisov I.R. Assessment of the technogenic disturbance of oil fields within the Middle Ob river region, Russia, by the use of satellite imagery. Geoekologiya. Inzhenernaya geologiya, gidrogeologiya, geokriologiya. 2020. N 5, p. 53-61 (in Russian). DOI: 10.31857/S0869780920050069
- Soromotin A.V. Ecological Consequences of Different Stages of the Development of Oil and Gas Deposits in the Taiga Zone of the Tyumen Region. Contemporary Problems of Ecology. 2011. Vol. 18. N 6, p. 813-822 (in Russian).
- Myachina K.V. Features of impact of oil-and-gas production objects on subzonal landscapes of the Volga-Ural steppe region. Byulleten Orenburgskogo nauchnogo tsentra UrO RAN. 2019. N 4, p. 21-29 (in Russian). DOI: 10.24411/2304-9081-2019-15021
- Pervukhin D.А., Ilyushin Yu.V. A parallel analysis of hydrolithospheric beds geodata of Narzan mineral water Kislovodsk deposit. Journal of Mining Institute. 2016. Vol. 221, p. 706-711. DOI: 10.18454/PMI.2016.5.706
- Egorova D., Buzmakov S. Bioremediation of Oil-contaminated Dark Gray Soils Using Bacterial and Plant Agents. Ecology and Industry of Russia. 2022. Vol. 26. N 3, p. 17-21 (in Russian). DOI: 10.18412/1816-0395-2022-3-17-21