
Mathematical model of linear and non-linear proppant concentration increase during hydraulic fracturing – a solution for sequential injection of a number of proppant types
- 1 — Lecturer Branch of Ufa State Oil Technical University in Oktyabrskiy ▪ Orcid
- 2 — Ph.D., Dr.Sci. Head of Department Branch of Ufa State Oil Technical University in Oktyabrskiy ▪ Orcid ▪ Elibrary ▪ Scopus
- 3 — Ph.D., Dr.Sci. Professor Ufa State Oil Technical University ▪ Orcid ▪ Elibrary ▪ Scopus ▪ ResearcherID
- 4 — Ph.D. Associate Professor Branch of Ufa State Oil Technical University in Oktyabrskiy ▪ Orcid ▪ Elibrary ▪ Scopus ▪ ResearcherID
- 5 — Ph.D., Dr.Sci. Professor Branch of Ufa State Oil Technical University in Oktyabrskiy ▪ Orcid ▪ Elibrary ▪ Scopus

Abstract
It is known that much of the technology aimed at intensifying fluid inflow by means of hydraulic fracturing involves the use of proppant. In order to transport and position grains in the fracture, a uniform supply of proppant with a given concentration into the fracturing fluid is ensured. The aim of the operation is to eliminate the occurrence of distortions in the injection program of proppant HF. A mathematically accurate linear increase of concentration under given conditions is possible only if the transient concentration is correctly defined. The proposed approach allows to correctly form a proppant HF work program for both linear and non-linear increase in proppant concentration. The scientific novelty of the work lies in application of a new mathematical model for direct calculation of injection program parameters, previously determined by trial and error method. A mathematical model of linear and non-linear increase of proppant concentration during HF was developed. For the first time, an analytical solution is presented that allows direct calculation of parameters of the main HF stages, including transient concentrations for given masses of the various types of proppant. The application of the mathematical model in formation of a treatment plan allows maintaining correct proppant mass distribution by fractions, which facilitates implementation of information and analytical systems, data transfer directly from a work program into databases. It is suggested to improve spreadsheet forms used in production, which would allow applying mathematical model of work program formation at each HF process without additional labour costs. The obtained mathematical model can be used to improve the software applied in the design, modelling and engineering support of HF processes.
None
Introduction
The main purpose of enhanced recovery and increase in a degree of hydrocarbon raw materials extraction is improving the efficiency of oil deposits development [1-3]. Correct selection of technological parameters for impact methods on the near-bottomhole zone and formation is of great importance [4-6]. With the shift of oil production towards the deposits with hard-to-recover reserves (HRR), substantiation of control solutions becomes especially urgent due to a considerable increase in the cost of errors [7-9]. Hydraulic fracturing plays a special role in the development of deposits with HRR, which rather often ensures cost-effective development of deposits [10-12].
A significant part of stimulation techniques involving hydraulic fracturing implies the use of proppant. To position the grains in the fracture, a uniform supply of proppant of a given concentration in the fracturing fluid is ensured [13-15].
The target proppant concentration in a HF design is always higher than the concentration used at the initial stages [16, 17]. This is technologically necessary, since an instantaneous increase in concentration from zero to the maximum value will lead to complications during HF [18, 19]. At the initial stages, the proppant plays a role of abrasive material, perforation interval and bottomhole section of the fracture are prepared for proppant injection with the target concentration. In order to enhance abrasive effect, reduce risks of technological complications and even the fracturing fluid filtration profile during injection, proppant with smaller average particle diameter and higher dispersion of diameter is used at the initial stages. In practice, this is achieved by using proppant of two fractions – a small amount of the first and then the bulk of the larger fraction [20-22].
Materials and methods
Technological control during HF includes verification of actually injected volumes of fluids and corresponding values of proppant concentration [23-25]. Transparency of technological control requires dividing total proppant mass into stages, as a rule, with a uniform increment of proppant concentration. The increment of proppant concentration remains constant at the main proppant fraction stages, but when transitioning from abrasive proppant to the main one, subject to the planned linear concentration increase, a problem with three interdependent variables appears: mass of abrasive proppant fraction, concentration increase rate during injection and transitional proppant concentration – maximum for abrasive fraction and minimum for the main one. Among these three variables, the mass is given directly by the design value, while the concentration increase rate is determined by the total mass of proppant and the final concentration, which is also given by the design.
If a strictly uniform increment of concentration from stage to stage is applied to the case where two proppant fractions are injected, it will lead to one of two errors, depending on the initial data. If the correct mass per stage is retained, the linear character of the concentration increase will be violated (Fig.1, a). In the opposite case, while maintaining the linear character of the concentration increase, an incorrect distribution of proppant mass in the stages will be obtained (Fig.1, b).
Thus, a mathematically accurate linear concentration increase, assuming correct mass accounting by fraction, is only possible if the transitional concentration is calculated for the given conditions. This would accordingly violate the multiplicity of concentration increase by stages, but would ensure that the mass of each proppant fraction is correctly represented while maintaining the overall linear increase of concentration. The deviation given in Fig.1, b allows conducting technically correct HF process, but for simulation and automated accounting systems, this approach will lead to errors. The proposed approach allows correct representation of the transition moment for proppant type in the work program and thus both mass and concentration increase will correspond to the given technology.
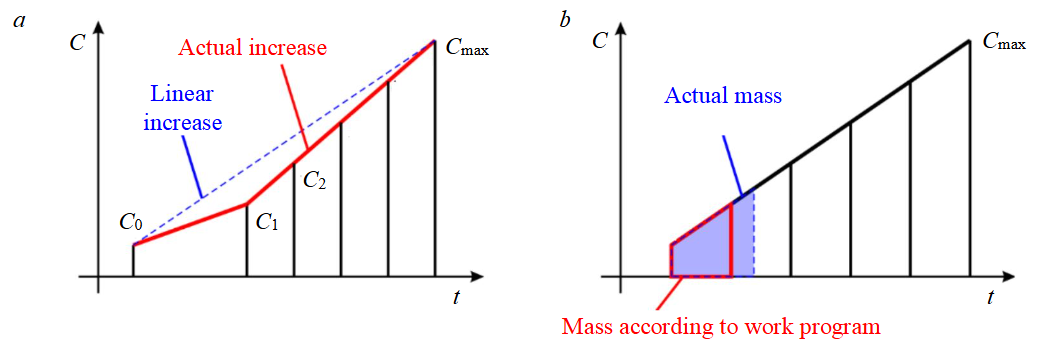
Fig.1. Distortions arising from maintaining a concentration increment during transitions between fractions: а – deviation from the linear concentration increase; b – deviation by mass
Results and discussion
A mathematical model of proppant concentration change during HF was built to solve the problem. The mathematical model revealed that in order to ensure linear nature of proppant concentration increase it is necessary to observe the following condition for the stages with increasing proppant concentration:
where С1, С2 – initial and final concentration of the considered process design section; Vs – the volume of the fracturing fluid mixture with the proppant; K – the slope coefficient of the concentration increase line.
In order to maintain a linear increase during the transition between proppant fractions in the work program based on the mathematical model, it is necessary to calculate the transition concentration Ca, at which the stage with fraction N 1 ends and fraction N 2 begins, for a given proppant mass by fractions and maximum concentration Cmax
Figure 2 shows the linear concentration increase. If the proppant concentration C is represented as a function of the fracturing fluid volume V, the condition of linear concentration increase will be maintained if the slope angle φ for the straight lines C0Ca and CaCmax is equal, as in the standard graphs with time axis t at a constant injection flow rate r. The proppant mass can be represented as the area of a trapezium bounded by the concentration line, the projection on the V-axis and the perpendiculars of the initial and final concentration to the projection,
where V – volume of clean liquid.
Thus, knowing the proppant mass by fraction, the planned minimum and maximum concentration, and the absolute density of the proppant, it is possible to calculate the required volume of fracturing fluid for a linear concentration increase:
where M – total mass of proppant of all fractions; C0, Cmax – initial and maximum concentration.
To calculate the volume of the fracturing fluid mixture, it is necessary to add the volume occupied by the proppant particles to the volume of the fracturing fluid (3), taking into account the presence of the fracturing fluid in the space between the particles:
where ρ – absolute proppant concentration.
Taking into account the constancy of the coefficient K in formula (1) and applying formula (4) for proppant fraction N 1, a system of equations is obtained:
where ma – mass of the first (smaller) proppant fraction.
There are two unknowns in equation (5): Ca and Vsa. The most interest for practical purposes is the transient concentration Ca. By solving the system of equations an analytical solution is obtained:
Thus, the minimum number of stages required to describe the injection of two types of proppant is reduced to two, with a transitional stage Ca. Table 1 shows the principle of forming the work program according to the presented mathematical model [26-28]. Further division into stages is possible by the same principle. In this case, there is no need to calculate transitional concentrations, they can be set equal for the main proppant fraction [29-31].
Table 1
Principle of forming the work program
|
Proppant type |
Mass |
Flow rate |
Fluid volume |
Mixture volume |
Time |
Concentration from |
Concentration to |
|
N 1 |
ma |
r |
C0 |
Ca |
|||
|
N 2 |
mb |
r |
Ca |
Cmax |
Note. mb – mass of the second (main) proppant fraction.
If the above mentioned distortions occur, the proppant masses by fractions are distorted and engineers need to manually adjust the figures to control material consumption and store the data in the database. In contrast to the standard approach, the obtained work program based on the mathematical model can be directly loaded into information systems and databases, as it will correspond to the actual injection during standard completion of the process [32-34].
The model is applied in practice. An example of calculation for injection of 9 t of proppant, of which 1 t is 30/60 fraction and 8 t is 16/20 fraction, with a linear concentration increase is presented in Table 2.
Table 2
HF parameters
|
Flow rate, m3/min |
Gel |
Time, мин |
Stage type |
Concentration from, kg/m3 |
Concentration to, kg/m3 |
Mass by stages, kg |
Total mass, kg |
Mixture |
|
2.8 |
10 |
3.57 |
Buffer |
0 |
0 |
0 |
0 |
10 |
|
2.8 |
2.58 |
0.95 |
Proppant 30/60 |
120 |
200 |
415 |
415 |
2.72 |
|
2.8 |
2.51 |
0.90 |
Proppant 30/60 |
200 |
280 |
585 |
1000 |
2.72 |
|
2.8 |
3.65 |
1.31 |
Proppant 16/20 |
280 |
400 |
1242 |
2242 |
4.08 |
|
2.8 |
2.95 |
1.05 |
Proppant 16/20 |
400 |
500 |
1326 |
3568 |
3.40 |
|
2.8 |
2.86 |
1.02 |
Proppant 16/20 |
500 |
600 |
1574 |
5142 |
3.40 |
|
2.8 |
2.78 |
0.99 |
Proppant 16/20 |
600 |
700 |
1808 |
6950 |
3.40 |
|
2.8 |
2.71 |
0.97 |
Proppant 16/20 |
700 |
800 |
2050 |
9000 |
3.40 |
|
2.8 |
7.2 |
2.57 |
Flushing |
0 |
0 |
0 |
9000 |
7.2 |
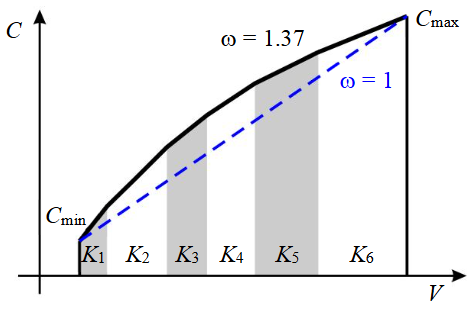
Fig.3. Non-linear increase of proppant concentration
A transitional concentration of 280 kg/m3 was calculated, at which the correct proppant mass and linear concentration increase is maintained.
Part of the HF technologies involves a non-linear increase in proppant concentration during the injection process. The required gel volume is reduced while maintaining proppant mass and proppant concentration. To ensure non-linearity and gradual transition between proppant stages, the treatment design is modified [9, 35].
The coefficient K in formula (1) for non-linear concentration increase is not constant for the whole injection, but varies from stage to stage. In order to specify the degree of curvature, a coefficient ω is introduced, taking values between 1 and 1.5. When ω = 1, a linear increase in concentration will be obtained, while a larger coefficient corresponds to a greater degree of non-linearity for the curve of proppant concentration increase. The coefficient ω is set during HF planning as the degree of injection aggressiveness. In the absence of risks and during HF of traditional reservoirs, a value within the range of 1.35-1.5 is recommended. If there are risks associated with friction pressure loss in the NBHZ, a value can be reduced and selected between 1.1 and 1.35. If there are significant risks, or when treating low-permeability reservoirs, a linear increase of proppant concentrations is recommended. In the future, the boundary values of ω can be refined when the data for statistical analysis is developed.
If the stage volume is expressed by the K coefficient in formula (1), then, given a known K and a set initial and final concentration, the volume of the mixture can be determined as
For the non-linear case K = Kn for each stage n, starting from stage N 2, is determined by means of an arithmetic progression. Intermediate multiplier K', also determined by the progression, is introduced beforehand
where N – number of stages, then
Accordingly, the volumes of the stages can be determined by progression:
Figure 3 shows the non-linear concentration increase at ω = 1.37.
Formula for transient concentration calculation (6) can be implemented into spreadsheet forms used by HF engineers, which will allow applying the presented approach to all HF processes without the need for manual calculations. During development and introduction of the new specialized information and analytical systems, the presented mathematical model can be built in the corresponding modules for simplification of work with the system. Introduction of non-linearity through coefficient ω not only simplifies preparation of the work program on corresponding technologies, but will also allow designating “aggressiveness” of injection in the digital equivalent for the account in a DB and the analysis in corporate IAS.
The model is applied in practice. An example of calculation for injection of 7 t of proppant, of which 1 t is 30/60 fraction and 6 t is 12/18 fraction, with a non-linear concentration increase and aggressiveness coefficient of ω = 1.2 is presented in Table 3.
Table 3
HF parameters
|
Flow rate, m3/min |
Gel |
Time, мин |
Stage type |
Concentration from, kg/m3 |
Concentration to, kg/m3 |
Mass by stages, kg |
Total mass, kg |
Mixture |
|
3.2 |
12 |
3.75 |
Buffer |
0 |
0 |
0 |
0 |
12 |
|
3.2 |
1.00 |
0.31 |
Proppant 30/60 |
120 |
200 |
161 |
161 |
1.05 |
|
3.2 |
1.29 |
0.40 |
Proppant 30/60 |
200 |
300 |
325 |
486 |
1.4 |
|
3.2 |
1.40 |
0.44 |
Proppant 12/18 |
300 |
400 |
514 |
1000 |
1.57 |
|
3.2 |
1.61 |
0.50 |
Proppant 12/18 |
400 |
500 |
737 |
1737 |
1.86 |
|
3.2 |
1.95 |
0.61 |
Proppant 12/18 |
500 |
600 |
1093 |
2830 |
2.32 |
|
3.2 |
2.47 |
0.77 |
Proppant 12/18 |
600 |
700 |
1647 |
4477 |
3.04 |
|
3.2 |
3.29 |
1.03 |
Proppant 12/18 |
700 |
800 |
2523 |
7000 |
4.16 |
|
3.2 |
9.4 |
2.57 |
Flushing |
0 |
0 |
0 |
7000 |
9.4 |
Application of the model allowed calculation of the mixture volumes by stages, taking into account the numerically given aggressiveness characteristic.
Conclusions
- A mathematical model of linear and non-linear proppant concentration increase during HF is obtained. For the first time, an analytical solution is presented that allows direct calculation to determine parameters of the main HF stages, including transient concentrations for given masses of proppant of various types.
- The application of the mathematical model in the formation of the treatment plan allows maintaining a correct distribution of the proppant mass by fractions, which facilitates the introduction of information and analytical systems, transferring data directly from the work program to databases.
- The improvement of the spreadsheet forms used in production will allow, without additional labour costs, to apply a mathematical model of the work program for each HF process.
- The obtained mathematical model can be used to improve the software used in the design, modelling and engineering support of HF processes.
References
- Dmitrievsky A.N. Resource-Innovative Strategy for the Development of the Russian Economy. Oil Industry. 2017. N 5, p. 6-7 (in Russian).
- Yakupov R.F., Mukhametshin V.Sh., Khakimzyanov I.N., Trofimov V.E. Optimization of reserve production from water oil zones of D3ps horizon of Shkapovsky oil field by means of horizontal wells. Georesources. 2019. Vol. 21. N 3, p. 55-61 (in Russian). DOI: 10.18599/grs.2019.3.55-61
- Sergeev V.V., Belenkova N.G., Zeigman Yu.V., Mukhametshin V.Sh. Physical Properties of Emulsion Systems with SiO2 Nanoparticles. Nanobuild. 2017. Vol. 9. N 6, p. 37-64 (in Russian). DOI: 10.15828/2075-8545-2017-9-6-37-64
- Galkin V.I., Koltyrin A.N. Research and Analysis of Methods for Determining the Efficiency of Application of the Proppant Hydraulic Fracturing. Bulletin of the Tomsk Polytechnic University. Geo Assets Engineering. 2019. Vol. 330. N 11, p. 50-58 (in Russian). DOI: 10.18799/24131830/2019/11/2347
- Chizhov A.P., Andreev V.E., Chibisov A.V. et al. Hydraulically perfect modes of injection of grouting mixtures when isolating absorbing formations. International Conference on Extraction, Transport, Storage and Processing of Hydrocarbons & Materials (ETSaP), 24-25 August 2020, Tyumen, Russian Federation. IOP Conference Series: Materials Science and Engineering, 2020. Vol. 952. N 012040, p. 1-7. DOI: 10.1088/1757-899X/952/1/012040
- Mukhametshin V.V., Kuleshova L.S. Using the method of canonical discriminant functions for a qualitative assessment of the response degree of producing wells to water injection during the development of carbonate deposits. MEACS 2020 – International Conference on Mechanical Engineering, Automation and Control Systems, 17th September 2020, Novosibirsk, Russian Federation. IOP Conference Series: Materials Science and Engineering, 2021. Vol. 1064. N 012069, p. 1-9. DOI: 10.1088/1757-899X/1064/1/012069
- Mukhametshin V.G., Dubinskiy G.S., Andreev V.E. et al. Geological, technological and technical justification for choosing a design solution for drilling wells under different geological conditions. MEACS 2020 – International Conference on Mechanical Engineering, Automation and Control Systems, 17th September 2020, Novosibirsk, Russian Federation. IOP Conference Series: Materials Science and Engineering, 2021. Vol. 1064. N 012061, p. 1-9. DOI: 10.1088/1757-899X/1064/1/012061
- Tyncherov K.T., Mukhametshin V.Sh., Khuzina L.B. Method to control and correct telemtry well information in the basis of residue number system. Journal of Fundamental and Applied Sciences. 2017. Vol. 9. N 2S, p. 1370-1374. DOI: 10.4314/jfas.v9i2s.848
- Zeigman Yu.V., Mukhametshin V.V., Kuleshova L.S. Differential impact on wellbore zone based on hydrochloric-acid simulation. International Conference on Extraction, Transport, Storage and Processing of Hydrocarbons & Materials (ETSaP), 24-25 August 2020, Tyumen, Russian Federation. IOP Conference Series: Materials Science and Engineering. 2020. Vol. 952. N 012069. DOI: 10.1088/1757-899X/952/1/012069
- Mukhametshin V.Sh., Zeigman Yu.V., Andreev A.V. Rapid assessment of deposit production capacity for determination of nanotechnologies application efficiency and necessity to stimulate their development. Nanotechnologies in Construction. 2017. Vol. 9. N 3, p. 20-34 (in Russian). DOI: 10.15828/2075-8545-2017-9-3-20-34
- Nur Wijaya, Sheng J.J. Comparative study of well soaking timing (pre vs. post flowback) for water blockage removal from matrix-fracture interface. Petroleum. 2020. Vol. 6. Iss. 3, p. 286-292. DOI: 10.1016/j.petlm.2019.11.001
- Ruimin Feng, Shengnan Chen, Steven Bryant, Jun Liu. Stress-dependent permeability measurement techniques for unconventional gas reservoirs: Review, evaluation, and application. Fuel. 2019. Vol. 256. N 115987. DOI: 10.1016/j.fuel.2019.115987
- Muslimov R.Kh. A new strategy for oil fields development in modern Russia – optimising production and maximizing oil recovery factor. Neft. Gaz. Novatsii. 2016. N 4, p. 8-17 (in Russian).
- Cheng Jing, Xiaowei Dong, Wenhao Cuid et al. Artificial neural network–based time-domain interwell tracer testing for ultralow-permeability fractured reservoirs. Journal of Petroleum Science and Engineering. 2020. Vol. 195. N 107558. DOI: 10.1016/j.petrol.2020.107558
- Economides J.M., Nolte K.I. Reservoir stimulation. Chichester: John Wiley and Sons, 2000, p. 856.
- Galkin V.I., Koltyrin A.N. Investigation of probabilistic models for forecasting the efficiency of proppant hydraulic fracturing technology. Journal of Mining Institute. 2020. Vol. 246, p. 650-659. DOI: 10.31897/PMI.2020.6.7
- Prashanth Siddhamshetty, Shaowen Mao, Kan Wu, Joseph Sang-Il Kwon. Multi-Size Proppant Pumping Schedule of Hydraulic Fracturing: Application to a MP-PIC Model of Unconventional Reservoir for Enhanced Gas Production. Processes. 2020. Vol. 8. Iss. 5. N 570. DOI: 10.3390/pr8050570
- Nurgaliev R.Z., Kozikhin R.A., Fattakhov I.G. et al. Prospects for the use of new technologies in assessing the impact of geological and technological risks. IPDME 2019 – International Workshop on Innovations and Prospects of Development of Mining Machinery and Electrical Engineering, 24-27 April 2019, Saint-Petersburg Mining University, Saint-Petersburg, Russian Federation. IOP Conference Series: Earth and Environmental Science, 2019. Vol. 378. N 012117. DOI: 10.1088/1755-1315/378/1/012117
- Shlyapkin A.S., Tatosov A.V. Formation of a Hydraulic Fracture by a High-Viscous Gel. Geology, Geophysics and Development of Oil and Gas Fields. 2020. N 9 (345), p. 109-112 (in Russian). DOI: 10.30713/2413-5011-2020-9(345)-109-112
- Nolte K.G. Determination of proppant and fluid schedules from fracturing-pressure decline. SPE Prod. Eng. 1986. Vol. 1. Iss. 4, p. 255-265. DOI: 10.2118/13278-PA
- Seeyub Yang, Prashanth Siddhamshetty, Joseph Sang-Il Kwon. Optimal pumping schedule design to achieve a uniform proppant concentration level in hydraulic fracturing. Computers & Chemical Engineering. 2017. Vol. 101, p. 138-147. DOI: 10.1016/j.compchemeng.2017.02.035
- Yakupov R.F., Mukhametshin V.Sh., Tyncherov K.T. Filtration model of oil coning in a bottom water-drive reservoir. Periodico Tche Quimica. 2018. Vol. 15. Iss. 30, p. 725-733.
- Galkin V.I., Ponomareva I.N., Cherepanov S.S. et al. New Approach to the Study of the Results of Hydraulic Fracturing (on the Example of Bobrikovsky Deposits of the Shershnevsky Field). Bulletin of the Tomsk Polytechnic University. Geo Assets Engineering. 2020. Vol. 331. N 4, p. 107-114 (in Russian). DOI: 10.18799/24131830/2020/4/2598
- Fokker P.A, Borello E.S., Verga F., Viberti D. Harmonic pulse testing for well performance monitoring. Journal of Petroleum Science and Engineering. 2018. Vol. 162, p. 446-459. DOI: 10.1016/j.petrol.2017.12.053
- Humoodi A., Hamoudi M., Sarbast R. Implementation of Hydraulic Fracturing Operation for a Reservoir in KRG. UKH Journal of Science and Engineering. 2019. Vol. 3. N 2, p. 10-21. DOI: 10.25079/ukhjse.v3n2y2019
- Bulgakova G.T., Sharifullin A.R., Sitdikov M.R. Mathematical Modeling Heat and Mass Transfer in a Vertical Hydraulic Fracture Crack during Inflation and Cleaning. Tyumen state university herald. Physical and mathematical modeling. Oil, gas, energy. 2020. Vol. 6, N 2 (22), p. 41-62 (in Russian). DOI: 10.21684/2411-7978-2020-6-2-41-62
- Nurgaliev R.Z., Kozikhin R.A., Fattakhov I.G., Kuleshova L.S. Application prospects for new technologies in geological and technological risk assessment. Gornyi zhurnal. 2019. N 4 (2261), p. 36-40 (in Russian). DOI: 10.17580/gzh.2019.04.08
- Siddhamshetty P., Yang S., Kwon J.S. Modeling of hydraulic fracturing and designing of online pumping schedules to achieve uniform proppant concentration in conventional oil reservoirs. Computers & Chemical Engineering. 2018. Vol. 114, p. 306-317. DOI: 10.1016/j.compchemeng.2017.10.032
- Masoomi R., Dolgow S.V. Comparing Different Scenarios for Water and Foam base Fracturing Fluids Using Numerical Simulation. Readings Name of A.I.Bulatov. 2017. Vol. 2, p. 150-155.
- Geertsma J., Haafkens R. Comparison of the theories for predicting width and extent of vertical hydraulically induced fractures. Journal of Energy Resource Technology. 1979. Vol. 101. Iss. 1, p. 8-19. DOI: 10.1115/1.3446866
- Keshavarz A., Yang Y., Badalyan A. et al. Laboratory-based Mathematical Modelling of Graded Proppant Injection in CBM Reservoirs. International Journal of Coal Geology. 2014. Vol. 136, p. 1-16. DOI: 10.1016/j.coal.2014.10.005
- Jiaxiang Xu, Yunhong Ding, Lifeng Yang et al. Effect of proppant deformation and embedment on fracture conductivity after fracturing fluid loss. Journal of Natural Gas Science and Engineering. 2019. Vol. 71. N 102986. DOI: 10.1016/j.jngse.2019.102986
- Bahtizin R.N., Nurgaliev R.Z., Fattakhov I.G. et al. On the question of the efficiency analysis of the bottom-hole area stimulation method. International Journal of Mechanical Engineering and Technology. 2018. Vol. 9. Iss. 6, p. 1035-1044.
- Dali Guo, Yunxiang Zhao, Zixi Guo, Xianhui Cui, Bo Huang. Theoretical and Experimental Determination of Proppant Crushing Rate and Fracture Conductivity. Journal of Energy Resources Technology. 2020. Vol. 142. Iss. 10. N 103005. DOI: 10.1115/1.4047079
- Nurgaliev O.T., Volchenko Yu. Al. Radioisotope Technique and Rikp-01 Measuring Facility for Express Estimation of Proppant Concentration in Mixtures Used in Hydraulic Fracturing of Oil and Gas-Bearing Formations. Automation, Telemechanization and Communication in Oil Industry. 2016. N 8, p. 24-28.