


Radon monitoring possibilities in short-term earthquake prediction
- 1 — Ph.D. Director Institute of Geophysics, Ural Branch of the RAS ▪ Orcid
- 2 — Ph.D. Senior Researcher Institute of Geophysics, Ural Branch of the RAS ▪ Orcid
- 3 — Ph.D. Leading Researcher Institute of Geophysics, Ural Branch of the RAS ▪ Orcid
Abstract
Analysis of the results of thirteen-year radon studies in the Southern Kuril Islands allowed us to establish a reliable relationship between tectonic events and anomalous concentrations of observed radon (VRA) extracted from the near-surface layer. Radon anomalies were compared with earthquakes of magnitude higher than 4 from the United States Geological Survey (USGS) catalog, which occurred within a radius of 500 km from the observation point. It was possible to divide the epicenters of tectonic events into groups that differ in distance relative to the monitoring point. Earthquakes always occur after the maximum of the preceding radon anomaly. Events of the first group belong to the near zone and are located within a radius of less than 130 km from the radon monitoring point. Events of the second group belong to the far zone and are located at a distance of more than 180 km from the radon monitoring point. The proposed method for determining the time and place of a tectonic event is the result of research. The proposed method is based on measuring the concentration of soil radon at four spatially separated points in the corners of a square with a distance between neighboring points of 180 km, which corresponds to the distance of the far zone. If an abnormal concentration of volume radon activity is detected at one of the observation stations, the presence of radon anomalies at other points is checked. If a radon anomaly is detected at least at one of the other observation points, a tectonic event is expected within six days from the moment of the maximum radon anomaly in the spatial boundaries limited to 130 km relative to the observation point where the first VRA anomaly was recorded. The proposed method is applicable for protecting specific objects in conditions of increased seismic activity. The effectiveness of the method is determined by the fulfillment of the provisions of the developed measurement methodology.
The work was carried out according to the State assignment of IGF UB RAS № 125032604464-7.
Introduction
Currently, there is a tendency to abandon the prediction of earthquakes, since only the exact location (meters), time (minutes), and magnitude (points) can be considered a prediction. In some cases, the researchers did not completely abandon the prediction, but displaced their focus to estimating the probability of an event [1, 2]. In Russia, there is a trend in the development of seismic safety, including seismic zoning, the introduction of innovative technologies for earthquake-resistant construction and early warning systems.
Nevertheless, scientific interest in predicting and searching for earthquake precursors remains relevant [3-5]. Today, a particularly important task is the short-term prediction [6-8], which allows us to take prompt response measures to reduce human and economic losses.
Changes in the stress-strain state of rocks during earthquake preparation are among the most realistic physical mechanisms that can be used for short-term prediction [9-11]. The underground atmosphere and hydrosphere are subject to changes in the stress-strain state of the geological environment.
The state of the underground atmosphere in a rock mass can be controlled by radon isotopes. They have a continuous source of generation, are fairly easy to register, and do not have a cumulative effect, which increases the sensitivity of measurements. It is preferable to use the isotope Rn-222, because it has a source of generation contained in almost all rocks.
Many researchers point to possible important relationships between changes in radon concentrations in soil, groundwater, atmosphere and earthquakes [12-14]. Many studies have been conducted on measuring radon before earthquakes in soil [15-17], air [18-20], and water [21-23].
S.Okabe conducted the first studies of radon gas and seismic activity in 1956 [24]. He found a positive relationship between changes in atmospheric radon concentrations near the Earth's surface and regional seismic activity in Japan. Thus, he pointed to radon as a new indicator of earthquakes.
In the work performed by V.I.Ulomov [25], significant changes in the radon concentration in borehole water were noted before the Tashkent earthquake of April 26, 1966. This is the first time that radon anomalies in borehole waters can serve as an indicator of earthquakes.
A number of studies have shown that the concentration of radon in soil, water, and atmosphere varies depending on movements in the Earth's crust. For example, in the Gulf of Corinth (Greece), the level of radon in the atmosphere sharply decreased before the earthquake [26]. In the case of the Izu-Oshima-Kinkai earthquake (January 14, 1978), the concentration of radon in groundwater began to decline three months before the event and plummeted five days before it. On the contrary, before the Kobe earthquake (1995), the concentration of radon in underground waters increased and peaked nine days before the disaster [27].
Scientists from Irkutsk analyzed the observed variations in subsurface radon and time variations in atmospheric pressure. Measurements were carried out in loose sediments at three stations in the Baikal Region [28]. During the observation period, three significant earthquakes were recorded. The conducted emanation monitoring made it possible to determine the effect of changes in atmospheric pressure on the release of subsurface radon [28].
From 1997 to 2016, subsurface radon measurements were performed on the Kamchatka Peninsula and its probable relationships with tectonic events were identified [29]. Researchers have identified medium-term signs of preparation for a strong earthquake in the Kamchatka seismogenic zone [30].
Monitoring measurements in the underground atmosphere and hydrosphere, in particular soil radon, make a significant contribution to understanding the physical processes associated with earthquake preparation.
The aim of the study is to develop a new method for determining the time and location of an earthquake based on tracking changes in the stress-strain state of rocks based on measurements of soil radon in the underground atmosphere. To achieve this goal, the following tasks were performed: development of a measurement methodology; development of a method for detecting anomalies of volume radon activity (VRA); comparison of VRA anomalies with subsequent earthquakes; study of the behavior of VRA at various epicentral distances from the monitoring station.
Methods
In 2011-2024, radon monitoring was carried out on Kunashir Island in the mode of forced delivery (forced convection [31]) of soil air to the detector. Geodynamically, the selected area for research belongs to the subduction zone. From the point of view of plate tectonics, it is located in the junction zone of the Pacific plate and Okhotsk Sea plate. The rate of subduction of the Pacific plate under the Okhotsk Sea plate is about 8 cm per year. The monitoring station is located 150-200 km west of the ocean trough. This circumstance limits the registration of weak earthquakes in variations in the volume radon activity, which simplifies the identification of anomalies and events. Geologically, the station is located on an ancient lava flow of andesite-basalt composition, formed after one of the eruptions of the Mendeleev volcano. Rocks of this composition have elastic properties, which is a condition for obtaining informative data on variations in the volume radon activity. Measurements at this station are optimal based on the number of observed earthquakes. If a small number of earthquakes occur in the observation region, it is impossible to obtain statistically reliable patterns. Too many numbers make it difficult to compare anomalies and events. The measured velocities of satellite positioning reference points changed after the Simushir earthquakes of 2006-2007. The middle islands of the Kuril Ridge move at a rate of 1.4 cm per year, the southern ones up to 3.3 cm. This situation may indicate that there is no plate engagement in the middle part of the ridge, and stresses are accumulating in the southern part, which may lead to earthquakes. Moreover, there have been no events with a magnitude greater than 8 in the Southern Kuril Islands region for more than 30 years, and the average interval between earthquakes with a magnitude greater than 8 is about 10 years [32].
In Fig.1 presents a multi-year series of volume radon activity and seismic events from from the United States Geological Survey (USGS) catalog. As can be seen from Fig.1, the data is not suitable for processing, analysis and interpretation according to the method developed by the authors. At this scale, it is impossible to identify anomalies and compare them with subsequent earthquakes. The authors developed a method for identifying anomalies of radon volume activity and comparing them with earthquake-causing ones [31].
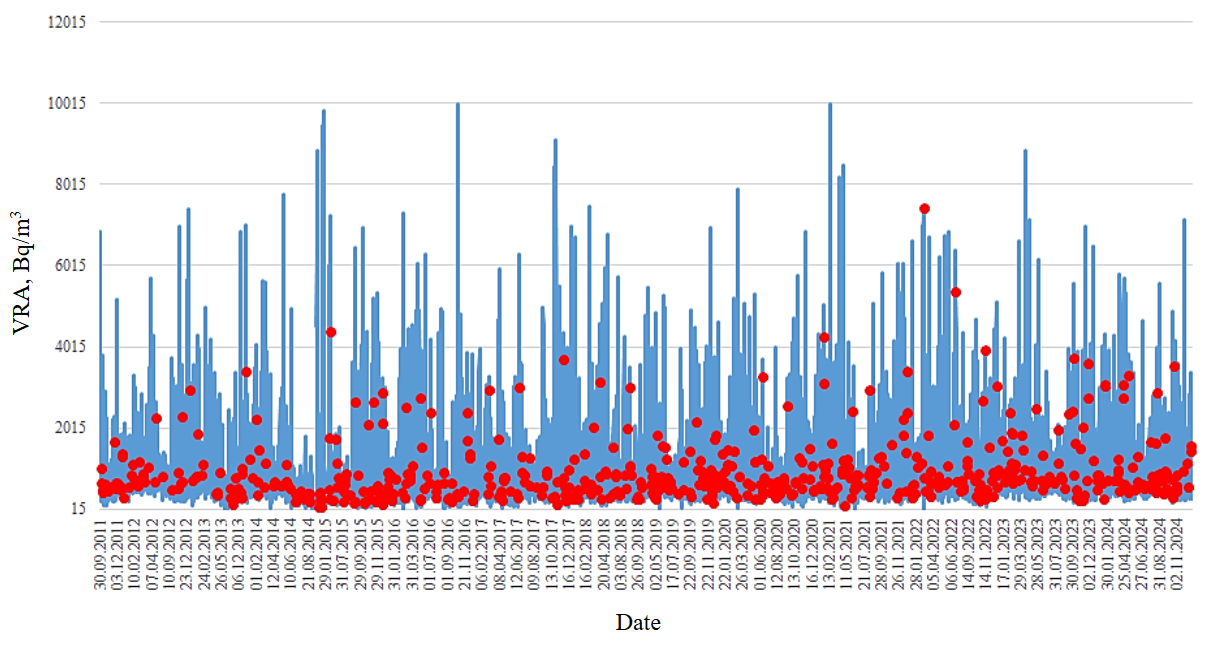
Fig.1. Variations in volume radon activity and seismic events for 2011-2024
I.P.Dobrovolsky proposed a deformation model for the manifestation of tectonic earthquake precursors [33]. This model is used to estimate the precursors occurrence zone for the Southern Kuril Islands. The ratio of the earthquake magnitude M to the logarithm of the distance from the monitoring station to the epicenter of the tectonic event R ≥ 2,5 was used. The ratio is applicable to the assessment of the manifestation zone of precursor effects associated with variations in porosity and permeability of the geological environment. The ratio of the earthquake magnitude to the logarithm of the distance from the monitoring station to the event is conventionally called a geodynamic criterion. During the observation period, the maximum magnitude was 7. This value was used to calculate the radius of occurrence of precursor effects, which was 500 km (the distance from the monitoring point on Kunashir Island to the epicenters of tectonic events) [31]. Retrospective analysis of earthquakes with a magnitude greater than 4 with a geodynamic criterion K higher than 2,5 was conducted (Fig.2, 3).
A large number of earthquakes did not correspond to K ≥ 2.5, but were reflected in the in the field of volume radon activity. To take into account all anomalies of soil radon and considered tectonic events, it was decided to apply a geodynamic criterion higher than 2 for the geological and tectonic conditions of the Southern Kuril Islands. A total of 344 earthquakes with a magnitude higher than 4 occurred during this period, and 319 of them were reflected in the VRA curves (Fig.2, 3).
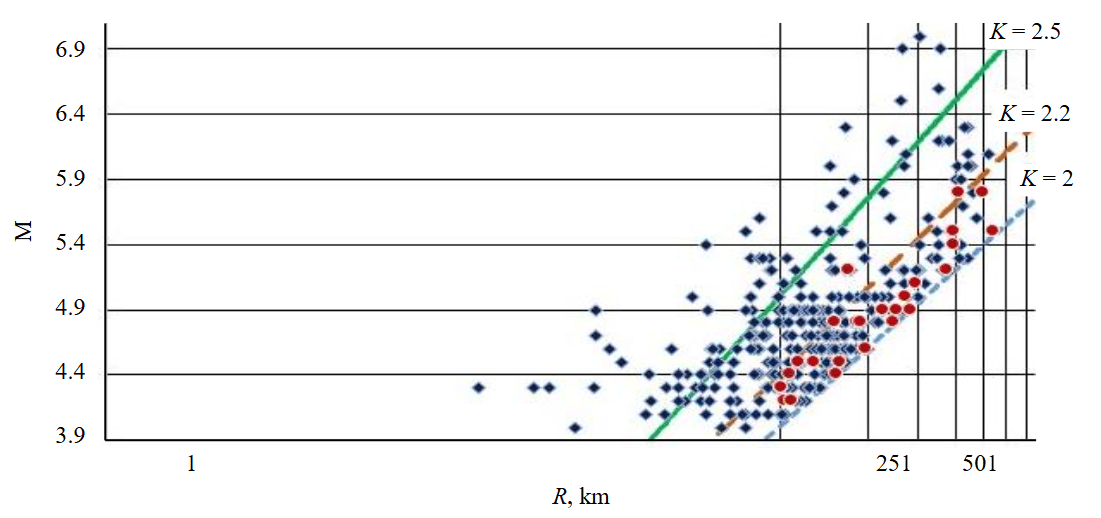
Fig.2. Earthquakes in the VRA field from 2011 to 2024. Rhombuses indicate events that were preceded by an VRA anomaly, circles indicate events that were not reflected in the VRA anomaly curves.
The lines correspond to different M/logR ratios
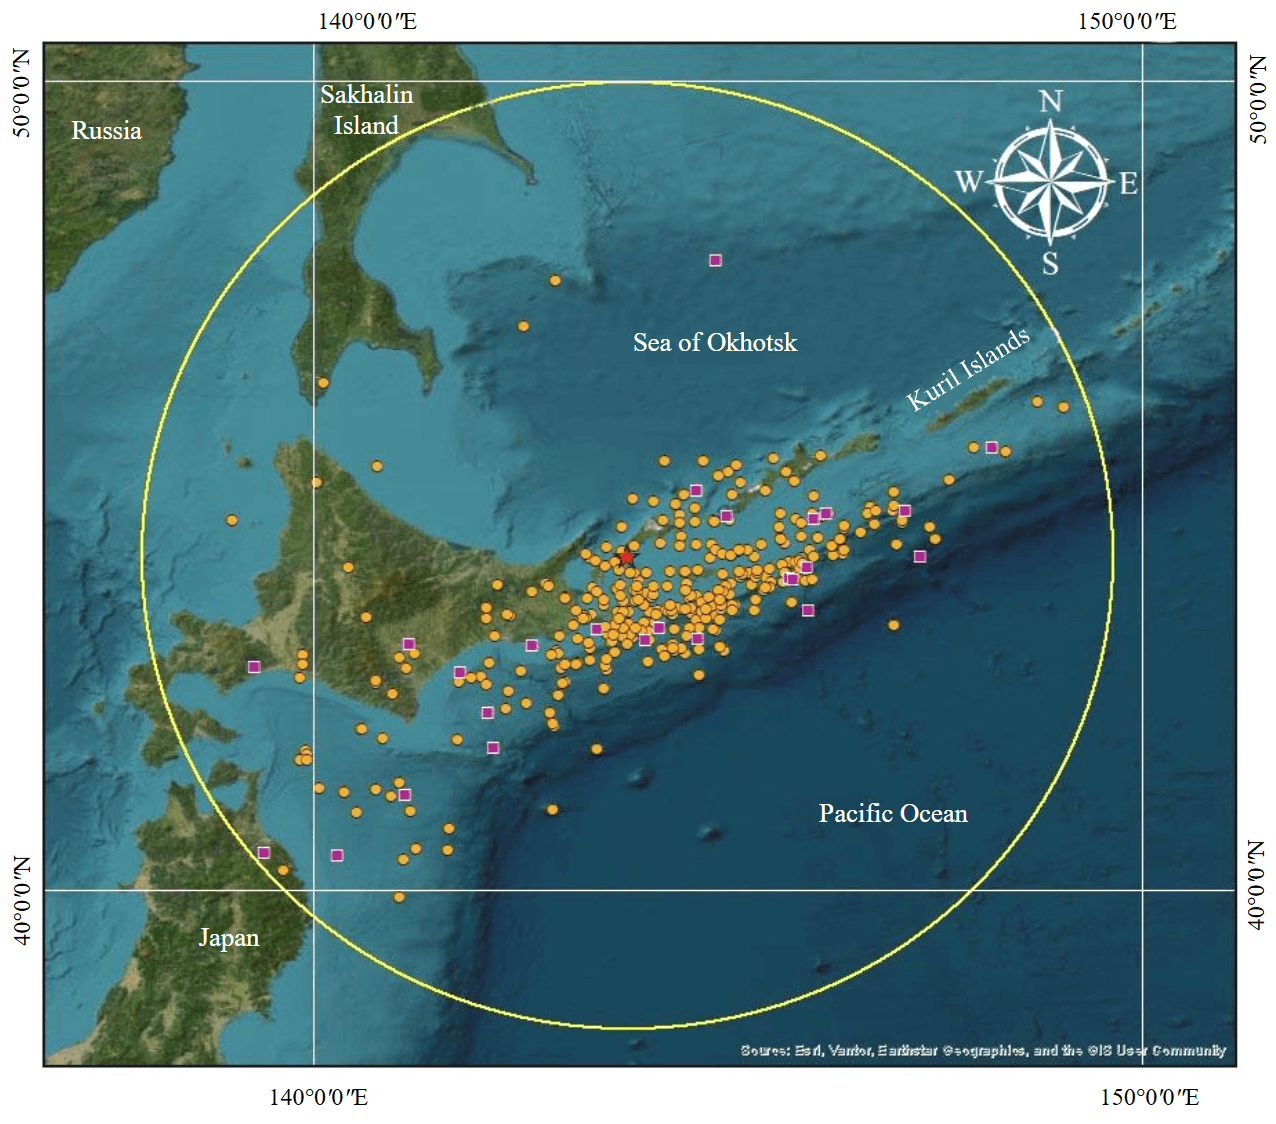
Fig.3. Map of earthquakes in the VRA field for the observation period from 2011 to 2024. The star indicates the observation station.
Orange circles indicate events that were preceded by an VRA anomaly; purple squares indicate events that were not reflected in the VRA anomaly curves. The circle corresponds to a radius of 500 km from the monitoring station
An important issue is to check whether there is a causal relationship between the precursor and the earthquake. For this purpose, statistical processing of the selected VRA anomalies and subsequent earthquakes was performed.
Random sequences of earthquakes were generated over a nine-year period, corresponding to the Poisson distribution law. The real parameters of successive earthquakes (mathematical expectation) from the catalog for the same period are taken as a basis. All generated seismic events were located within a radius of 500 km from the monitoring station and their magnitude was assumed to be greater than or equal to 4. Earthquake sequences with K ≥ 2 and K ≥ 2.2 were considered.
Random sequences of anomalies are also generated according to the Poisson distribution law. The mathematical expectation of the intervals between the selected VRA anomalies over a nine-year period is taken as a basis. The anomaly window is taken as the average value among all selected values between the anomaly maximum and its end – 7 days (Fig.4). Sequences of anomalies identified before earthquakes with criteria K ≥ 2 and K ≥ 2.2 were considered.
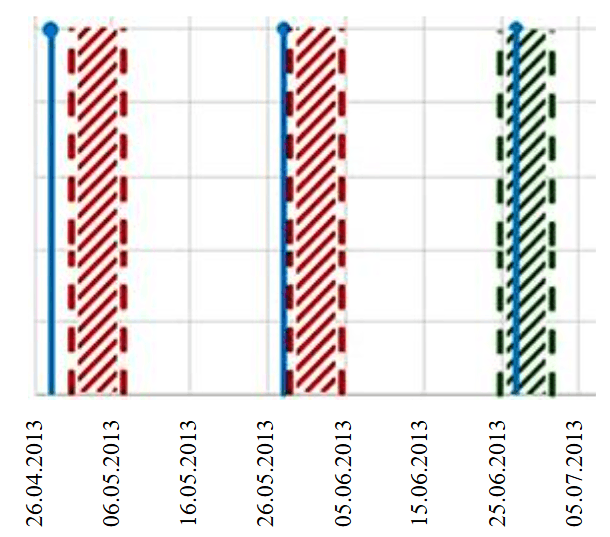
Fig.4. Example of a comparison of randomly generated earthquakes and seven-day windows of soil radon anomalies. A line with a dot at the top shows the generated moment of the earthquake, a shaded column shows the generated time interval during which the anomaly lasted
The generated random sequences of earthquakes and anomalies were compared. If the earthquake fell within the seven-day anomaly window, it was assumed that it was preceded by an anomaly of soil radon.
As a result of calculations, the experimental probability for earthquakes with K ≥ 2 is 0.89, while the theoretical probability is 0.35. For earthquakes with K ≥ 2.2, the experimental probability is 0.98, while the theoretical probability is 0.20. For both K ≥ 2 and K ≥ 2.2, the theoretical probability does not correspond to the experimentally obtained values. For earthquakes with K ≥ 2 and K ≥ 2.2 and radon anomalies, the theoretical probability is 3 and 5 times less than the experimental probability, respectively. This may indicate a causal relationship between anomalies in radon volume activity and earthquakes.
Results and discussion
It is established that seismic events occur after the maximum anomaly of the volume radon activity, and near and far earthquakes (relative to the observation point) are reflected in different parts of the VRA curve. In the time interval from the radon anomaly maximum to six days, tectonic earthquakes of the far zone are manifested. For the geological and tectonic conditions of the South Kuril geodynamic polygon, the radius of the far zone (extension zone) was more than 180 km. In the time interval from the radon anomaly end to 28 days near zone events appear. Near zone events are reflected in the VRA curve after the anomaly reaches the background level in the time interval up to 28 days. For the conditions of the South Kuril geodynamic polygon (subduction zone), the radius of the near zone (compression zone) was less than 130 km [34].
The behavior of the crack-pore space when the stress state of the massif changes directly at the monitoring point is the physical basis for reflecting the earthquake preparation process in the behavior of soil radon, taking into account that the observed radon anomalies are short and high-amplitude [35]. In the near zone, radon anomalies are formed due to compression, in which, due to a decrease in the volume of free space, radon is squeezed out until cracks and pores are completely closed, up to the occurrence of a main break. A different mechanism of formation is proposed for far zone anomalies. The geological environment returns to its original state after the beginning of destruction at the epicenter of the event, cracks and pores narrow, as a result of which radon is partially released.
In Fig.5 shows the average anomalies of volume radon activity for the measurement period 2011-2024. When studying the decay of Rn, a regularity is observed between the initial and final amounts of the initial substance, which is approximated by the exponential law. Proportional coupling is the basis of the law of radioactive decay. The average maximum of the radon anomaly for each zone is taken as the starting point. For each measurement point, the average value for all anomalies was calculated separately for anomalies preceding near zone earthquakes (line 1, Fig.5) and far zone earthquakes (line 2, Fig.5). The average anomalies of volume soil radon activity for the near and far zones are plotted with radon decay curves (curves 3, 4, Fig.5). Curves 5 and 6 in Fig.5 is an approximation of the VRA curves after the end of the radon decay curve anomaly.
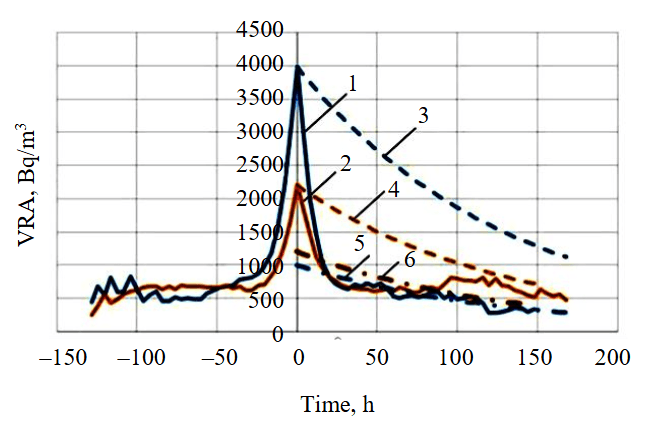
Fig.5. Averaged VRA anomalies in the compression and extension zones and radon decay curves. Solid lines – averaged values of VRA anomalies before the events of the near (1) and far (2) zones; dashed lines – radon decay curves for the maximum of the near (3) and far (4) zones; dash-dotted lines – approximation of VRA values after the completion of the anomaly, radon decay curve for the near (5) and far (6) zones
Reduction of the anomalous value of volume radon activity as for the near zone (line 1, Fig.5), and for the far zone (line 2, Fig.5) occurs not only due to the decay of radon, which was released. The flow of soil radon from the pore space is stopped. In both the first and second cases, the radon curve (lines 1, 2, Fig.5) does not agree with the law of radioactive decay, starting from the maximum value of radon concentration (curves 3, 4, Fig.5). In the case of the near zone, the VRA curve is approximated by the radon decay curve (curve 5, Fig.5) after the end of the radon anomaly at the output to the background values. In the case of the far zone, the VRA curve after the end of the anomaly returns to the initial values before the increase and is not approximated by the decay curve (curve 6, Fig.5). This is due to the fact that radon continues to be squeezed out of the pores and cracks. Thus, the described mechanism of formation of radon anomalies is justified.
Based on the described mechanism of radon anomalies formation, a method for short-term prediction of the earthquakes time and location is formulated. The key component of the proposed method is the change in the porosity and permeability of rocks under the influence of tensile and compressive stresses. Stretching in one area leads to compression in another. Accordingly, the removal of compressive stresses during destructive processes in the source at the time of an earthquake or shortly before it will cause the removal (for some time) of tensile stresses outside the source (in the far zone). This will lead to the restoration of permeability to the previous level, i.e. the pore volume will decrease and radon will be displaced to the adjacent areas of the pore space. When monitoring in the far zone (extension zone), a tectonic event is reflected on the VRA curve in the time interval after the anomaly maximum of up to six days. The radon anomaly that occurred in the far zone is caused by the process of destruction in the earthquake source. Monitoring of radon variations in the far zone, taking into account that the destructive process in the focus of a tectonic event leads to the appearance of an anomaly, will allow predicting an earthquake after the maximum of the radon anomaly [36].
The proposed method consists in monitoring the volume soil radon activity in the mode of forced delivery of soil air to the detector, at least in four monitoring points in the vicinity of the controlled object, with a distance between neighboring points equal to the radius of the far zone R1 (Fig.6). If an anomaly is detected at one of the observation points, anomalies are monitored at the other stations. If a radon anomaly is detected at least at one of the other observation points, a tectonic event is expected within six days from the moment of the radon anomaly maximum in the spatial borders limited by the radius of the near zone R2 relative to the observation point where the first VRA anomaly was recorded [36].
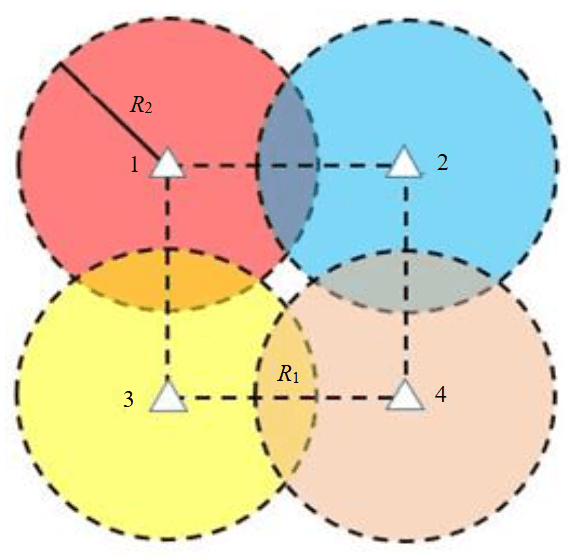
Fig.6. Layout of volume radon activity observation points
For the practical implementation of the proposed method, it is necessary to create a network of observation points for monitoring soil radon in seismically active areas, for example, in the North Caucasus and in the Crimea. These regions are of great economic importance and have a high population density. Currently, radon monitoring sites are located in different regions with different geodynamic activity – the Kuril Islands, Sakhalin Island, Eastern Sayan (Republic of Tyva), the Urals, the Republic of Kazakhstan, and the Kyrgyz Republic. The monitoring results confirm the patterns of earthquake reflection in the radon field obtained for the subduction zone. The conducted studies show that in order to obtain standard data, it is necessary to strictly observe the mode of measuring soil radon, taking into account geological and tectonic conditions.
Conclusion
Despite the skeptical attitude towards predicting tectonic events, each new catastrophic earthquake again makes the problem relevant. To study the process of earthquake preparation, new approaches are needed based on methods that have a real physical justification. Monitoring of soil radon meets this condition and makes it possible to obtain statistically significant observation series. The proposed method for determining the time and location of an earthquake allows us to estimate the quantitative characteristics of the expected earthquake time relative to the characteristic zones of manifestation on the radon curve and determine the position of the tectonic event epicenter in space. After successful application in real conditions, the proposed method is highly likely to prevent tectonic events at controlled objects in regions with increased seismic hazard.
References
- Neely J.S., Salditch L., Spencer B.D., Stein S. A More Realistic Earthquake Probability Model Using Long-Term Fault Memory. Bulletin of the Seismological Society of America. 2023. Vol. 113. N 2, p. 843-855. DOI: 10.1785/0120220083
- Zhonghu Jiao, Xinjian Shan. A Bayesian Approach for Forecasting the Probability of Large Earthquakes Using Thermal Anomalies from Satellite Observations. Remote Sensing. 2024. Vol. 16. Iss. 9. N 1542. DOI: 10.3390/rs16091542
- Szakács A. Precursor-Based Earthquake Prediction Research: Proposal for a Paradigm-Shifting Strategy. Frontiers in Earth Science. 2021. Vol. 8. N 548398. DOI: 10.3389/feart.2020.548398
- Smits G. Review of Predicting Disasters: Earthquakes, Scientists, and Uncertainty in Modern Japan, by Kerry Smith. Monumenta Nipponica. 2024. Vol. 79. N 2, p. 310-315. DOI: 10.1353/mni.2024.a952790
- Singh R., Roy B. Scalable earthquake magnitude prediction using spatio-temporal data and model versioning. Scientific Reports. 2025. Vol. 15. N 19265. DOI: 10.1038/s41598-025-00804-x
- Nandan S., Kamer Y., Ouillon G. et al. Global models for short-term earthquake forecasting and predictive skill assessment. The European Physical Journal Special Topics. 2021. Vol. 230. Iss. 1, p. 425-449. DOI: 10.1140/epjst/e2020-000259-3
- Fujinawa Y., Noda Y., Miyagawa M. et al. A Practical Method for Short-term Earthquake Prediction Using Multiple High-frequency Tremor Events. Asian Journal of Physical and Chemical Sciences. 2022. Vol. 10. Iss. 3, p. 15-24. DOI: 10.9734/ajopacs/2022/v10i3182
- Huaizhong Yu, Rui Yan, Shiguang Deng et al. Improved medium-to-short-term earthquake predictions in China in 2022. Geomatics, Natural Hazards and Risk. 2024. Vol. 15. Iss. 1. N 2350482. DOI: 10.1080/19475705.2024.2350482
- Verma U.P., Sinha M.N., Dutta P.K., Mullick S. Stress-Strain Relationship: Postulated Concept to Understand Genetic Mechanism Associated with a Seismic Event. Computational Optimization Techniques and Applications. IntechOpen, 2021. DOI: 10.5772/intechopen.97377
- Guofu Luo, Fenghe Ding, Yingcai Xu et al. Strain fields of Ms > 6.0 earthquakes in Menyuan, Qinghai, China. Frontiers in Earth Science. 2023. Vol. 11. N 1152348. DOI: 10.3389/feart.2023.1152348
- Orlecka-Sikora B., Ciechowska H., Zhenyu Zhang, Zhiming Liang. Seismic Strain Metrics for Tracking Fault Damage Evolution and Rupture Potential in Anthropogenic Seismicity. Rock Mechanics and Rock Engineering. 2025. Vol. 58. Iss. 9, p. 11061-11082. DOI: 10.1007/s00603-025-04688-1
- Tarakçi M., Harmanşah C., Saç M.M., İçhedef M. Investigation of the relationships between seismic activities and radon level in Western Turkey. Applied Radiation and Isotopes. 2014. Vol. 83. Part A, p. 12-17. DOI: 10.1016/j.apradiso.2013.10.008
- Petraki E., Nikolopoulos D., Panagiotaras D. et al. Radon-222: A Potential Short-Term Earthquake Precursor. Journal of Earth Science & Climatic Change. 2015. Vol. 6. Iss. 6. N 282. DOI: 10.4172/2157-7617.1000282
- Khan M.A., Khattak N.U., Hanif M. Radon emission along faults: a case study from district Karak, Sub-Himalayas, Pakistan. Journal of Radioanalytical and Nuclear Chemistry. 2022. Vol. 331. Iss. 5, p. 1995-2003. DOI: 10.1007/s10967-022-08283-4
- Ghosh D., Deb A., Sengupta R. Anomalous radon emission as precursor of earthquake. Journal of Applied Geophysics. 2009. Vol. 69. Iss. 2, p. 67-81. DOI: 10.1016/j.jappgeo.2009.06.001
- Stoulos S., Papadimitriou E., Karakostas V. et al. Radon signals in soil gas associated with earthquake occurrence in Greece: review and perspective. Journal of Radioanalytical and Nuclear Chemistry. 2024. Vol. 333. Iss. 12, p. 6107-6120. DOI: 10.1007/s10967-024-09710-4
- İçhedef M., Günay O., Yalçın C. et al. Assessment of soil gas radon variations in terms of seismicity in Yalova, Türkiye. Journal of Radioanalytical and Nuclear Chemistry. 2025. Vol. 334. Iss. 9, p. 6829-6836. DOI: 10.1007/s10967-025-10169-0
- Kim J.W., Joo H.Y., Kim R., Moon J.H. Investigation of the relationship between earthquakes and indoor radon concentrations at a building in Gyeongju, Korea. Nuclear Engineering and Technology. 2018. Vol. 50. Iss. 3, p. 512-518. DOI: 10.1016/j.net.2017.12.010
- Tsuchiya M., Nagahama H., Muto J. et al. Detection of atmospheric radon concentration anomalies and their potential for earthquake prediction using Random Forest analysis. Scientific Reports. 2024. Vol. 14. N 11626. DOI: 10.1038/s41598-024-61887-6
- Sahoo B.K., Sapra B.K., Khan A. et al. A persistent radon anomaly signal preceding the destructive 7.7 Mw earthquake in Myanmar on March 28, 2025. Scientific Reports. 2025. Vol. 15. N 25447. DOI: 10.1038/s41598-025-10632-8
- Tsunomori F., Tanaka H. Anomalous change of groundwater radon concentration monitored at Nakaizu well in 2011. Radiation Measurements. 2014. Vol. 60, p. 35-41. DOI: 10.1016/j.radmeas.2013.11.006
- Abbas S.Q., Khan J., Riaz M.T. et al. Radon concentration in spring water as an indicator of seismic activity: a case study of the Muzaffarabad Fault in Pakistan. Environmental Monitoring and Assessment. 2024. Vol. 196. Iss. 1. N 41. DOI: 10.1007/s10661-023-12235-0
- Kim J., Kim H., Kaown D, Lee K.-K. Thoron, radon and microbial community as supportive indicators of seismic activity in groundwater. Scientific Reports. 2024. Vol. 14. N 25955. DOI: 10.1038/s41598-024-77011-7
- Okabe S. Time variation of the atmospheric Radon-content near the ground surface with relation to some geophysical phenomena. Memoirs of the College of Science, University of Kyoto, Series A. 1956. Vol. 28. N 2, p. 99-115.
- Ulomov V.I. On the way to earthquakes prediction. Zemlya i Vselennaya. 1968. N 3, p. 23-30 (in Russian).
- Karastathis V.K., Eleftheriou G., Kafatos M. et al. Observations on the stress related variations of soil radon concentration in the Gulf of Corinth, Greece. Scientific Reports. 2022. Vol. 12. N 5442. DOI: 10.1038/s41598-022-09441-0
- Wakita H., Nakamura Y., Notsu K. et al. Radon Anomaly: A Possible Precursor of the 1978 Izu-Oshima-kinkai Earthquake. Science. 1980. Vol. 207. Iss. 4433, p. 882-883. DOI: 10.1126/science.207.4433.882
- Seminsky K.Z., Bobrov A.A. Irregularities in the Relationship of Variations in the Radon Volume Activity and Atmospheric Pressure during Seismic Activation (by the Example of the Baikal Region). Doklady Earth Sciences. 2023. Vol. 510. N 1, p. 312-316. DOI: 10.1134/S1028334X23600160
- Firstov P.P., Makarov E.O., Glukhova I.P. et al. Search for predictive anomalies of strong earthquakes according to monitoring of subsoil gases at Petropavlovsk-Kamchatsky geodynamic test site. Geosystems of Transition Zones. 2018. Vol. 2. N 1, p. 16-32 (in Russian). DOI: 10.30730/2541-8912.2018.2.1.016-032
- Firstov P.P., Kopylova G.N., Solomatin A.Yu., Serafimova Yu.K. Strong earthquake forecast near the Kamchatka peninsula. Bulletin of Kamchatka Regional Association “Educational-Scientific Center”. Earth Sciences. 2016. Iss. 32. N 4, p. 106-114 (in Russian).
- Kozlova I.A., Biryulin S.V., Yurkov A.K. Occurrence of anomalies in soil radon volume activity before tectonic earthquakes. Lithosphere. 2021. Vol. 21. N 5, p. 724-733 (in Russian). DOI: 10.24930/1681-9004-2021-21-5-724-733
- Prytkov A.S., Vasilenko N.F., Frolov D.I. Recent Geodynamics of the Kuril Subduction Zone. Russian Journal of Pacific Geology. 2017. Vol. 11, N 1, p. 19-24. DOI: 10.1134/S1819714017010067
- Dobrovolskii I.P. Mathematical theory of preparation and prediction of tectonic earthquakes. Мoscow: Fizmatlit, 2009, p. 240 (in Russian).
- Kozlova I.A., Yurkov A.K., Biryulin S.V. Feasibility of application of soil radon activity concentration variations in studying geodynamic processes. Russian Geology and Geophysics. 2025. Vol. 66. N 6, p. 703-711. DOI: 10.2113/RGG20244805
- Outkin V.I. Radon and the problem of tectonic earthquakes. Soros Educational Journal. 2000. Vol. 6. N 12, p. 64-70 (in Russian).
- Kozlova I.A., Biryulin S.V., Yurkov A.K. Patent N 2839307 RF. Method of determining time and place of earthquake. Publ. 26.05.2025. Bul. N 15 (in Russian).