The polyphase Belokurikhinsky granite massif, Gorny Altai: isotope-geochemical study of zircon
- 1 — Ph.D., Dr.Sci. Chief Researcher Institute of Precambrian Geology and Geochronology RAS ▪ Orcid ▪ Scopus
- 2 — Ph.D. Researcher Institute of Precambrian Geology and Geochronology RAS ▪ Orcid
- 3 — Postgraduate Student Empress Catherine II Saint Petersburg Mining University ▪ Orcid
- 4 — Head of the Department Karpinsky Russian Geological Research Institute ▪ Orcid
- 5 — Ph.D., Dr.Sci. Professor Shukshin Altai State University for Humanities and Pedagogy ▪ Orcid
Abstract
Based on the isotopic-geochemical analyses of zircons from granites of the Belokurikhinsky massif in the Gorny Altai using the U-Pb method, the ages of three intrusion phases have been determined for the first time: the age of the first phase refers to the time interval of 255-250 Ma, the second and the third phases have similar ages of about 250 Ma. The formation time of the Belokurikhinsky massif is estimated as not exceeding 5-8 Ma. The δ18O values for zircons from granites of the second and the third intrusion phases average around 11.5-12.0 ‰, indicating a significant contribution of a crustal component in the formation of the parent melts for granites of these phases. The crystallization temperature values of the zircons by the Ti-in-zircon thermometer for three phases range from 820 to 800 °C. The P-T crystallization parameters of titanite from the first phase, determined using a titanite thermobarometer, average around 770 °C and 2.7 kbar. The zircons from the first phase mostly exhibits geochemical characteristics of typical magmatic zircons. The zircons from the second and the third intrusion phases either may be unaltered magmatic zircons or enriched in incompatible elements (LREE, Th, U, Ti, Ca, etc.) due to fluid influence, resembling hydrothermal-metasomatic type zircons in terms of their geochemical characteristics. A number of zircon grains from the second and the third phases of granites demonstrate anomalous geochemical characteristics – the REE distribution spectra atypical for zircons (including “bird's wing” type spectra with oppositely tilted of light and heavy REE distribution profiles), as well as significantly higher contents of certain trace elements compared to other varieties. Such an enriched zircon composition and wide variations in the incompatible element content are due to non-equilibrium conditions of zircon crystallization and evolution of the fluid-saturated melt composition during the final stages of the massif formation.
The research was funded by the Russian Science Foundation, Grant N 23-77-01014.
Introduction
The study of granitoid magmatism allows to address many questions related to the petrogenesis and evolution of the continental crust, as well as associated ore-forming processes [1, 2]. Important genetic information about these processes can be obtained through the study of indicator minerals with a detailed study of mineral structure and composition [3-6]. Among these, zircon, a leading mineral geochronometer, occupies a special position, providing information on the crystallization conditions and subsequent rock transformations [7-10].
Of particular interest are the Permo-Triassic granites of the Altai collisional system [reviewed in 11]. This area belongs to the western sector of the Central Asian fold belt. Significant geological, geochemical, and isotopic data have been obtained, allowing for the identification of the specific nature of individual magmatic associations and suggesting the significant role of crust-mantle interaction in the formation of granitoids [12]. The polyphase Belokurikhinsky granite massif is one of the typical representatives of the Permo-Triassic anorogenic granites of the Gorny Altai. In recent years, new data on its age and formation conditions have been obtained [13-15]. However, certain issues, such as the ages of all three phases of the massif determined by the U-Pb dating method on zircon, the estimation of the duration and formation conditions of the massif, and the obtaining of additional isotopic-geochemical characteristics of the parent melts, remain not fully resolved. The present study is devoted to these particular issues and is based on a comprehensive isotopic-geochemical study of zircon from the Belokurikhinsky granites massif.
Geological characteristics
The study of the Belokurikhinsky massif began in the 1950s and is still being carried out by a wide range of researchers: A.N.Leontiev [16], A.G.Vladimirov and colleagues [17, 18], A.I.Gusev and colleagues [19], O.A.Gavryushkina [12] and others. However, such a key mineral for determining the age and solving the question of the genesis of the host rocks, as zircon, has not been studied in detail until now.
The Belokurikhinsky massif is located in the northern part of the Gorny Altai. The massif is situated in the interfluve of the Anui-Peschanaya and has an area of about 500 km2, lying in the form of a laccolith among Ordovician-Devonian rocks of carbonate and terrigenous-carbonate formations. The estimated thickness of the laccolith based on modelling data is 2-3 km. Three phases of intrusion are distinguished in the Belokurikhinsky massif: 1) biotite and amphibole-biotite granodiorites found in the northern part of the massif and covering about 5 % of the massif area; 2) biotite granites developed throughout the massif area, covering about 70 % of the massif area; 3) divalent mica, muscovite, tourmaline- and garnet-bearing leucogranites represented by stocks, covering about 25 % of the massif area [19].
The first phase consists of coarse- and medium-grained light grey granodiorites. They have a porphyritic structure (large grains of plagioclase up to 3 cm are present amongst the main mass). The main mass of the rock consists of plagioclase (represented by oligoclase) – 35 %; potassium feldspar – 15 %; quartz – 25 %; dark coloured minerals (hornblende – up to 7 %, biotite – up to 10 %). Accessory minerals include titanite, apatite, and zircon. Fine grains of zircon (up to 0.05 mm) occur as inclusions in biotite and in the main mass on contacts of quartz with plagioclase and potassium feldspar. The secondary alteration includes sericitization of plagioclase and chloritization of biotite.
The second phase is represented by medium-grained biotite granites. The rock composition includes quartz – 30 %; plagioclase (oligoclase) – 25 %; potassium feldspar – 25 %; biotite – 8 %; accessory minerals – apatite and zircon. Zircon is found as fine grains (up to 0.01 mm) on contacts of quartz with biotite and potassium feldspar, as well as inclusions in biotite grains. The rock is practically unaffected by secondary alteration.
The third phase is represented by fine-grained leucogranites (potassium feldspar – 40 %; quartz – 35 %; plagioclase (oligoclase-albite) – 20 %; muscovite – 5 %; dark-coloured minerals). There are a variety of accessory minerals, reaching 5 %, including apatite, fluorite, topaz, garnet (spessartine), and zircon. Zircon is predominantly found as fine grains (up to 0.01 mm) on contacts of rock-forming minerals (quartz and potassium feldspar, plagioclase). The secondary alteration is practically absent except for plagioclase, on which sericite is formed.
The geological sketch map of the Belokurikhinsky massif with sampling points is given in [14, 15]. The coordinates of the sampling points can be provided by the authors. The sample from leucogranites of the Tochilny stock, located to the north of the main part of the outcrops of the Belokurikhinsky massif, was taken by N.I.Gusev and A.I.Gusev, while the rest of the samples were taken by M.E.Mamykina. During sampling, the authors followed the previously published scheme of phase separation of the massif [19]. Samples were taken from the most typical and representative unweathered varieties of granite.
Analytical methods
The zircon was separated from the granite samples at the Institute of Precambrian Geology and Geochronology of the Russian Academy of Sciences (IPGG RAS) using electromagnetic separation and heavy liquids following standard methodology. The local U-Pb dating of zircon was performed using the SHRIMP-II ion microprobe (CIR VSEGEI). The U-Pb measurements were performed according to the methodology described in [20]. The intensity of the primary 16O2̅ ion beam was 4 nA, and the crater diameter was about 20 µm. The data obtained were processed using the SQUID program (authored by K.Ludwig). The U/Pb ratio was normalized to the values for the zircon standards TEMORA and 91500. The errors of the individual analyses (U/Pb ratio and age) were at the 1σ level, and the errors of the calculated concordant ages and concordia intersections were at the 2σ level. The concordia diagram was constructed using the ISOPLOT/EX (author K.Ludwig). Prior to the geochronological study at the CIR VSEGEI, the zircon was imaged in cathodoluminescence (CL) mode on a CamScan MX2500S scanning electron microscope with CL detector CLI/QUA 2 (Fig.1).
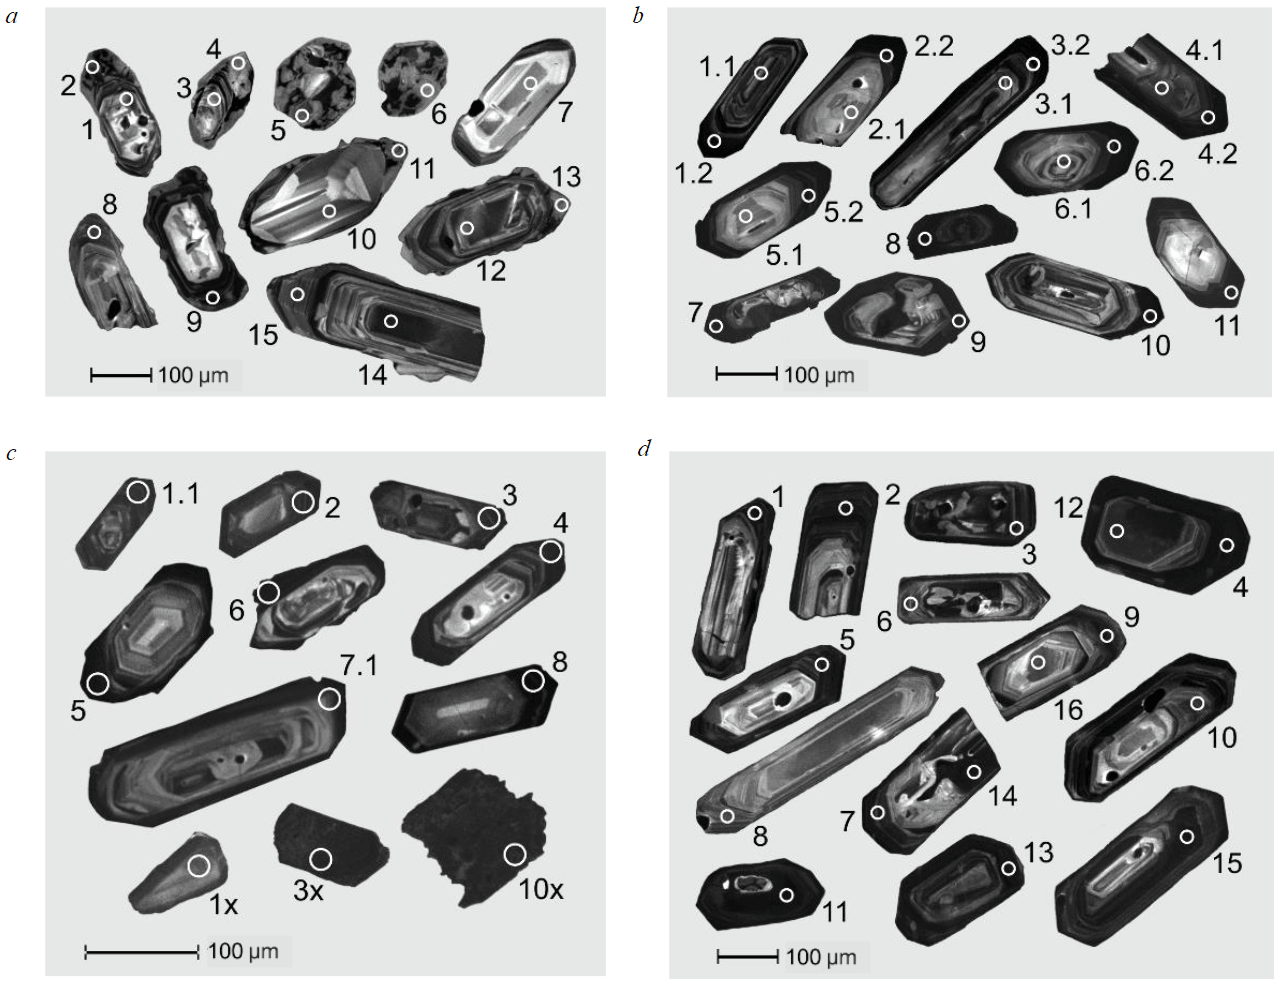
Fig.1. The CL images of zircons from granites of the Belokurikhinsky massif with indication of analytical craters (diameter is about 20 µm) for: a – the first phase (sample 2020-13); b – the second phase (sample TH1-2); c – the third phase (sample TH3-1); d – the Tochilny stock (sample 2016-5).
The content of trace and rare earth elements in zircon was determined by secondary ion mass spectrometry (SIMS) on the Cameca IMS-4f ion microprobe at the Yaroslavl’ Branch of the Institute of Physics and Technology of the Russian Academy of Sciences using standard methodology. The SIMS measurement conditions included a primary ion beam of 16O2̅ with a diameter of about 20 µm, an ion current of 5-7 nA, and a primary ion beam acceleration voltage of 15 kV. Each measurement consisted of three cycles, which allowed the individual measurement error to be estimated. The total analysis time for one point was on average 30 minutes. Measurement error for trace elements was up to 10 % for concentrations above 1 ppm and up to 20 % for concentrations in the range of 0.1-1 ppm; detection limits for various elements varied in the range of 5-10 ppb. The zircon was analyzed in the same craters where the U-Pb dating was carried out. To construct REE distribution spectra, the zircon composition was normalized to the chondrite CI composition [21]. The temperature of zircon crystallization was calculated using the Ti-in-zircon thermometer [22].
Results
Isotopic-geochemical characterization of zircons. Zircons from the granite of the first phase (sample 2020-13)
The zircon is mainly represented by idiomorphic grains elongated up to 350 µm and 150 µm in the transverse direction (Fig.1, a). The elongation coefficient is usually 1:2.5-1:3. Most zircon grains demonstrate heterogeneous structure. The central parts (cores) have a thin banded growth oscillatory zoning in light grey colours in CL images. The marginal zones (rims) are characterized by a mosaic structure with a chaotic alternation of different-sized dark grey, including black, areas in the grey main mass (e.g., the rim with point 2 in Fig.1, a). In some cases (the rim with point 9), the dark areas in the rim form consistent thin bands alternating with grey bands, collectively forming banding consistent with the zoning of the core. In some grains, the rims “cut off” the thin-banded oscillatory zoning shown in the cores (e.g., the grain with points 3 and 4). The zircon grains with points 5 and 6 have an isometric shape, probably, representing cross-sections perpendicular to the prism elongation axis. In the grain with point 6, the core with a cha-racteristic grey coloring in CL images is absent, and in the grain with point 5, the area occupied by the core in this cross-section is less than 10 % of the total area. In other grains, the ratio between the area of the core and the rim can vary significantly, from being comparable (the grain with points 1 and 2) to a sharp decrease in the rim relative to the core (the grain with points 10 and 11). In some grains, the rim is absent (e.g., the grain with points 14 and 15), where the oscillatory zoning is most clearly observed.
The zircon from granite of the first phase was dated using the U-Pb method at 15 points, with approximately equal representation of cores and rims. The results of the zircon isotopic-geochemical study are presented in Table 1. The dated zircon points form two clusters. The upper cluster consists of seven points (1, 3, 10, 15, 14, 8, 7) with 206Pb/238U ages ranging from 230 to 252 Ma, respectively (Table 1, Fig.2, a). These points mostly belong to zircon domains with growth oscillatory zoning – central areas of the cores or homogeneous grains (points 10, 14 and 7), marginal parts of the cores (points 1 and 3), marginal areas of the grains without boundaries (points15 and 8). The U content (from SHRIMP-II data) in these points varies widely – from 124 to 1101 ppm with an average of 484 ppm, Th – from 96.0 to 805 ppm with an average of 344 ppm. The Th/U ratio also varies significantly from 0.41 to 1.30 with an average value of 0.75, typical of zircon of magmatic genesis [23, 24]. The considered cluster of seven points is not compact; the range of individual 206Pb/238U age values is about 20 Ma. Considering the possible loss of radiogenic lead from the central parts of zircon grains due to superimposed processes, including the formation of rims significantly different in U-Pb age, the concordant age of this cluster was calculated for three points compactly located in the upper part of the cluster (points 14, 8, and 7). The zircon with these points has no rims contrasting in CL image, indicating the absence (or minimum influence) of superimposed processes specific to these grains. The concordant age calculated for these three points is 249 ± 3 Ma (MSWD = 0.15, Fig.2, b).
Point 9 with a 206Pb/238U age of about 204 Ma is located below the concordant cluster with an age of about 250 Ma. This point is characterized by the highest U and Th content among all points (2908 and 1479 ppm, respectively). In CL image (see Fig.1, a), this point is located in the rim with parallel dark bands, resembling oscillatory zoning. Considering the zircon age of point 9, which is close to the age of zircon cores, there is a reason to consider at least this rim as a result of core recrystallization influenced by superimposed processes that brought in U and Th.
Table 1
The U-Pb ages of zircons from granites of the Belokurikhinsky massif
|
Analysis points |
206Pbc, % |
U, ppm |
Th, ppm |
232Th238U |
206Pb*, ppm |
Age 206Pb/238U,Ma |
207Pb235U |
± % |
206Pb238U |
± % |
Rho |
|
The first phase (sample 2020-13) |
|||||||||||
|
1 |
0.34 |
448 |
561 |
1.30 |
14.0 |
230 |
0.252 |
3.8 |
0.036 |
2.3 |
0.612 |
|
3 |
0.98 |
618 |
307 |
0.51 |
19.7 |
233 |
0.260 |
4.2 |
0.037 |
2.3 |
0.544 |
|
10 |
0.13 |
288 |
268 |
0.96 |
9.49 |
242 |
0.264 |
3.7 |
0.038 |
2.3 |
0.630 |
|
14 |
0.12 |
1101 |
805 |
0.76 |
36.9 |
246 |
0.274 |
2.7 |
0.039 |
2.3 |
0.833 |
|
15 |
0.18 |
440 |
226 |
0.53 |
14.5 |
243 |
0.269 |
3.4 |
0.038 |
2.3 |
0.677 |
|
7 |
0.29 |
124 |
96.5 |
0.80 |
4.26 |
252 |
0.286 |
5.2 |
0.040 |
2.5 |
0.474 |
|
8 |
0.30 |
369 |
146 |
0.41 |
12.6 |
250 |
0.278 |
3.8 |
0.040 |
2.3 |
0.605 |
|
9 |
2.33 |
2908 |
1479 |
0.53 |
82.2 |
204 |
0.219 |
6.1 |
0.032 |
2.3 |
0.374 |
|
2 |
16.8 |
2125 |
700 |
0.34 |
37.4 |
109 |
0.124 |
16 |
0.017 |
2.4 |
0.153 |
|
4 |
4.63 |
627 |
92.9 |
0.15 |
10.3 |
116 |
0.118 |
11 |
0.018 |
2.4 |
0.214 |
|
5 |
5.01 |
906 |
140 |
0.16 |
16.4 |
128 |
0.131 |
12 |
0.020 |
2.4 |
0.198 |
|
6 |
3.84 |
609 |
118 |
0.20 |
10.4 |
122 |
0.133 |
10 |
0.019 |
2.4 |
0.239 |
|
12 |
13.6 |
518 |
259 |
0.52 |
9.57 |
119 |
0.125 |
30 |
0.019 |
2.7 |
0.088 |
|
13 |
28.5 |
860 |
125 |
0.15 |
18.1 |
112 |
0.133 |
63 |
0.017 |
3.2 |
0.051 |
|
11 |
34.3 |
2325 |
742 |
0.33 |
18.5 |
39 |
0.059 |
30 |
0.006 |
2.9 |
0.095 |
|
The second phase (sample ТН1-2) |
|||||||||||
|
1.1 |
0.20 |
475 |
443 |
0.96 |
15.9 |
246 |
0.274 |
2.3 |
0.039 |
0.6 |
0.259 |
|
2.1 |
0.35 |
137 |
106 |
0.80 |
4.57 |
244 |
0.295 |
5.2 |
0.039 |
0.8 |
0.148 |
|
3.1 |
– |
374 |
327 |
0.90 |
12.7 |
249 |
0.289 |
3.1 |
0.039 |
0.9 |
0.306 |
|
4.1 |
0.24 |
498 |
446 |
0.92 |
16.8 |
249 |
0.270 |
2.6 |
0.039 |
0.6 |
0.226 |
|
5.1 |
0.44 |
154 |
126 |
0.85 |
5.12 |
244 |
0.293 |
5.1 |
0.039 |
0.8 |
0.153 |
|
6.1 |
– |
187 |
151 |
0.83 |
6.32 |
248 |
0.281 |
3.5 |
0.039 |
0.7 |
0.196 |
|
1.2 |
7.65 |
1292 |
1226 |
0.98 |
41.4 |
235 |
0.268 |
11 |
0.037 |
2.2 |
0.196 |
|
2.2 |
10.6 |
1287 |
458 |
0.37 |
45.4 |
259 |
0.298 |
36 |
0.041 |
2.7 |
0.074 |
|
3.2 |
0.60 |
1959 |
694 |
0.37 |
67.1 |
251 |
0.295 |
4.0 |
0.040 |
1.7 |
0.410 |
|
4.2 |
0.03 |
3444 |
1407 |
0.42 |
132 |
281 |
0.316 |
0.8 |
0.045 |
0.5 |
0.634 |
|
5.2 |
0.46 |
3303 |
1763 |
0.55 |
123 |
273 |
0.319 |
1.6 |
0.043 |
1.0 |
0.642 |
|
6.2 |
0.59 |
1411 |
561 |
0.41 |
45.1 |
236 |
0.261 |
2.7 |
0.037 |
1.6 |
0.589 |
|
The third phase (sample ТН3-1, mount М-2974) |
|||||||||||
|
1х |
1.85 |
9309 |
120 |
0.01 |
354 |
274 |
0.314 |
2.3 |
0.043 |
0.7 |
0.305 |
|
3х |
6.69 |
5873 |
618 |
0.11 |
222 |
259 |
0.291 |
6.8 |
0.041 |
1.1 |
0.156 |
|
10х |
0.03 |
10283 |
91.2 |
0.01 |
375 |
268 |
0.295 |
0.8 |
0.042 |
0.7 |
0.813 |
|
The third phase (sample ТН3-1, mount М-3066) |
|||||||||||
|
1.1 |
0.04 |
3540 |
445 |
0.13 |
126 |
262 |
0.293 |
2.0 |
0.041 |
1.9 |
0.930 |
|
2 |
0.16 |
1819 |
273 |
0.16 |
64.7 |
261 |
0.292 |
2.5 |
0.041 |
1.9 |
0.753 |
|
3 |
0.82 |
2248 |
498 |
0.23 |
79.8 |
259 |
0.295 |
2.7 |
0.041 |
2.0 |
0.751 |
|
4 |
0.05 |
1509 |
1035 |
0.71 |
51.5 |
251 |
0.278 |
2.2 |
0.040 |
1.9 |
0.849 |
|
5 |
0.12 |
5643 |
319 |
0.06 |
198 |
257 |
0.287 |
2.0 |
0.041 |
1.9 |
0.943 |
|
6 |
0.05 |
805 |
1156 |
1.49 |
26.8 |
245 |
0.273 |
2.5 |
0.039 |
1.9 |
0.765 |
|
7.1 |
0.24 |
397 |
133 |
0.35 |
12.5 |
232 |
0.258 |
3.8 |
0.037 |
2.0 |
0.517 |
|
8 |
0.96 |
6617 |
1354 |
0.21 |
233 |
256 |
0.285 |
2.8 |
0.041 |
1.9 |
0.668 |
|
The Tochilny stock, leucogranites of the third phase (sample 2016-5) |
|||||||||||
|
1 |
0.20 |
517 |
194 |
0.39 |
17.5 |
249 |
0.275 |
3.3 |
0.039 |
1.2 |
0.353 |
|
2 |
0.11 |
1226 |
473 |
0.40 |
43.2 |
259 |
0.289 |
2.2 |
0.041 |
1.0 |
0.478 |
|
3 |
0.55 |
1090 |
358 |
0.34 |
37.0 |
249 |
0.284 |
4.0 |
0.039 |
1.1 |
0.270 |
|
4 |
1.14 |
1767 |
591 |
0.35 |
61.7 |
254 |
0.286 |
4.7 |
0.040 |
1.1 |
0.225 |
|
5 |
0.50 |
1544 |
513 |
0.34 |
55.3 |
262 |
0.289 |
3.1 |
0.042 |
1.0 |
0.334 |
|
6 |
0.80 |
423 |
186 |
0.45 |
13.8 |
238 |
0.282 |
6.2 |
0.038 |
1.3 |
0.205 |
|
7 |
2.82 |
1132 |
568 |
0.52 |
38.5 |
243 |
0.270 |
10.0 |
0.038 |
1.2 |
0.116 |
|
8 |
0.00 |
277 |
119 |
0.44 |
9.69 |
257 |
0.280 |
3.6 |
0.041 |
1.3 |
0.369 |
|
9 |
0.22 |
1340 |
338 |
0.26 |
47.3 |
259 |
0.294 |
2.4 |
0.041 |
1.1 |
0.451 |
|
10 |
0.13 |
744 |
208 |
0.29 |
26.1 |
257 |
0.287 |
2.6 |
0.041 |
1.1 |
0.421 |
Note. Dash – content below the detection limit. Pbc and Pb* – non-radiogenic and radiogenic lead. Rho – correlation coefficient between the errors of detecting isotopic ratios 206Pb/238U and 207Pb/235U.
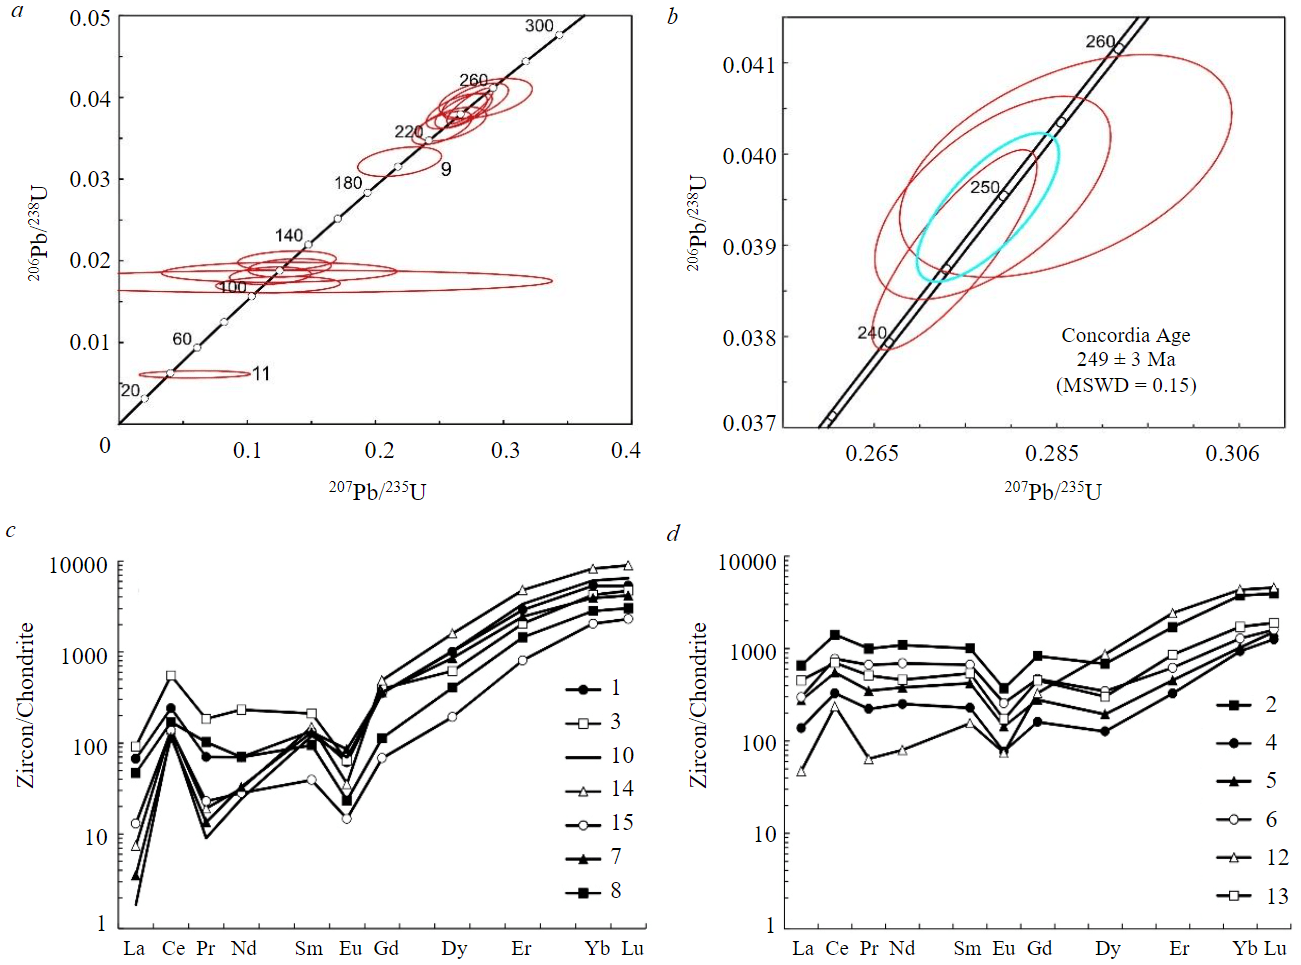
Fig.2. The concordance diagram (a, b) and the REE distribution spectra (c, d), normalized to chondrite CI, for zircons from the first phase granites (sample 2020-13) 1-15 – analysis points
The lower concordant cluster consists of six points (2, 13, 4, 12, 6, 5) with 206Pb/238U ages ranging from 109 to 128 Ma (Table 1). All these points are characterized by an increased content of non-radiogenic 206Pb – from 3.84 to 28.54 %. The U content is about twice as high as in the upper cluster, ranging from 518 to 2125 with an average of 484 ppm. The Th content varies slightly ranging from 93 to 700 with an average of 239 ppm. The Th/U ratio varies from 0.15 to 0.52, averaging 0.25. Such Th/U ratio corresponds to the lower limit values for zircon of magmatic genesis or may already correspond to metamorphic zircon [23]. The concordant age calculated for these six points is 117 ± 4 Ma (MSWD = 0.063). Point 11, also belonging to the zircon rim, has a 206Pb/238U age of about 39 Ma. The anomalously high content of non-radiogenic 206Pb at this point, reaching 34.30 %, allows this individual result to be excluded from consideration.
The zircon from the central parts of grains and cores, belonging to the cluster with the age of about 250 Ma (seven points), is characterized by a differentiated REE distribution pattern, trending for the content to increase from light to heavy REE (Fig.2, с). The LuN/LaN ratio averages 951 (Table 2). The total REE content is 1737 ppm, with heavy REE significantly dominating over light REE (averaging 1541 and 175 ppm, respectively). All REE distribution patterns from this group are characterized by a well-defined negative Eu anomaly (average Eu/Eu* = 0.27) and a positive Ce anomaly (average Ce/Ce* = 11.3). The Th/U ratio (according to SIMS data) averages 0.51. The listed features are characteristic feature of zircon of magmatic genesis [23]. The Y content is correlated with the content of heavy REE, averaging 2164 ppm. The Hf content averages 12061 ppm, corresponding to values for zircon from granitoids [25].
Table 2
Content of trace elements (ppm) in zircons from granites of the first phase of the Belokurikhinsky massif (sample 2020-13)
|
Component |
Zircon from the central parts of grains and cores |
Zircon from the “younger” age cluster |
|||||||||||
|
1 |
3 |
7 |
8 |
10 |
14 |
15 |
2 |
4 |
5 |
6 |
12 |
13 |
|
|
La |
15.8 |
21.6 |
0.83 |
11.0 |
0.40 |
1.75 |
3.07 |
156 |
32.8 |
65.3 |
70.5 |
11.2 |
107 |
|
Ce |
147 |
338 |
70.3 |
104 |
77.8 |
85.4 |
83.8 |
867 |
202 |
337 |
477 |
145 |
430 |
|
Pr |
6.51 |
17.0 |
1.25 |
9.49 |
0.84 |
1.77 |
2.12 |
92.9 |
20.6 |
32.5 |
61.9 |
5.95 |
47.6 |
|
Nd |
31.9 |
106 |
15.0 |
31.9 |
11.1 |
14.4 |
12.9 |
501 |
115 |
174 |
318 |
36.6 |
211 |
|
Sm |
20.0 |
31.2 |
19.4 |
14.0 |
17.7 |
22.2 |
5.80 |
149 |
33.9 |
62.5 |
99.1 |
23.0 |
80.3 |
|
Eu |
3.43 |
3.59 |
4.79 |
1.31 |
3.91 |
2.00 |
0.83 |
20.9 |
4.34 |
8.08 |
14.5 |
4.19 |
9.67 |
|
Gd |
69.9 |
78.0 |
72.0 |
22.5 |
70.6 |
97.4 |
13.5 |
166 |
32.0 |
55.6 |
93.4 |
65.6 |
90.0 |
|
Dy |
247 |
151 |
209 |
99.5 |
250 |
392 |
47.3 |
168 |
31.3 |
48.0 |
85.3 |
213 |
74.3 |
|
Er |
464 |
328 |
392 |
232 |
536 |
765 |
129 |
274 |
52.2 |
72.6 |
99.3 |
388 |
137 |
|
Yb |
860 |
682 |
631 |
455 |
978 |
1325 |
330 |
605 |
151 |
166 |
208 |
701 |
278 |
|
Lu |
131 |
116 |
103 |
74.3 |
159 |
220 |
56.7 |
96.9 |
31.0 |
37.3 |
39.4 |
113 |
46.9 |
|
Li |
14.2 |
10.9 |
0.55 |
6.90 |
0.68 |
11.3 |
10.2 |
15.4 |
11.3 |
17.0 |
9.53 |
3.54 |
12.1 |
|
P |
446 |
304 |
297 |
369 |
314 |
579 |
155 |
276 |
129 |
158 |
216 |
389 |
145 |
|
Ca |
1171 |
194 |
59.2 |
251 |
64.8 |
147 |
58.8 |
491 |
278 |
235 |
730 |
181 |
293 |
|
Ti |
81.9 |
152 |
26.1 |
52.6 |
20.5 |
44.0 |
21.0 |
222 |
74.0 |
115 |
196 |
43.8 |
149 |
|
Sr |
10.4 |
2.36 |
0.69 |
1.16 |
0.92 |
1.50 |
0.80 |
5.85 |
1.62 |
2.20 |
21.1 |
1.24 |
3.59 |
|
Y |
2403 |
1723 |
2037 |
1192 |
2823 |
4325 |
646 |
1484 |
252 |
410 |
629 |
2180 |
659 |
|
Nb |
161 |
99.6 |
79.1 |
43.6 |
70.7 |
171 |
91.5 |
76.0 |
71.6 |
56.2 |
n.d. |
64.7 |
161 |
|
Ba |
2.52 |
4.97 |
1.24 |
2.21 |
2.11 |
2.90 |
2.96 |
9.58 |
4.08 |
5.28 |
6.50 |
3.28 |
8.50 |
|
Hf |
10315 |
11487 |
10714 |
13606 |
13003 |
12355 |
12944 |
13266 |
13227 |
12731 |
14670 |
10959 |
13386 |
|
Th |
614 |
518 |
130 |
200 |
378 |
966 |
342 |
876 |
215 |
339 |
507 |
335 |
435 |
|
U |
852 |
1575 |
216 |
624 |
550 |
1792 |
984 |
4046 |
1741 |
1752 |
1715 |
824 |
1732 |
|
Th/U |
0.72 |
0.33 |
0.60 |
0.32 |
0.69 |
0.54 |
0.35 |
0.22 |
0.12 |
0.19 |
0.30 |
0.41 |
0.25 |
|
Eu/Eu* |
0.28 |
0.22 |
0.39 |
0.23 |
0.34 |
0.13 |
0.28 |
0.41 |
0.40 |
0.42 |
0.46 |
0.33 |
0.35 |
|
Ce/Ce* |
3.51 |
4.26 |
16.8 |
2.46 |
32.8 |
11.7 |
7.94 |
1.74 |
1.87 |
1.77 |
1.74 |
4.31 |
1.46 |
|
ΣREE |
1998 |
1872 |
1518 |
1054 |
2106 |
2927 |
685 |
3096 |
706 |
1059 |
1565 |
1707 |
1512 |
|
ΣLREE |
202 |
482 |
87.3 |
157 |
90.1 |
103 |
102 |
1617 |
370 |
609 |
927 |
199 |
796 |
|
ΣHREE |
1773 |
1355 |
1407 |
883 |
1994 |
2800 |
576 |
1310 |
298 |
380 |
525 |
1481 |
626 |
|
LuN/LaN |
80.0 |
51.6 |
1197 |
64.8 |
3879 |
1209 |
178 |
5.99 |
9.10 |
5.50 |
5.39 |
97.3 |
4.21 |
|
LuN/GdN |
15.2 |
12.0 |
11.5 |
26.7 |
18.2 |
18.3 |
33.9 |
4.73 |
7.83 |
5.42 |
3.41 |
13.9 |
4.21 |
|
SmN/LaN |
2.03 |
2.31 |
37.6 |
2.03 |
71.8 |
20.2 |
3.02 |
1.53 |
1.65 |
1.53 |
2.25 |
3.30 |
1.20 |
|
T(Ti), °C |
970 |
1058 |
835 |
914 |
811 |
893 |
813 |
1117 |
957 |
1016 |
1097 |
893 |
1054 |
Note. n.d. – content of element is not determined. LREE (light rare earth elements) – La-Nd, HREE (heavy rare earth elements) – Gd-Lu.
This group of zircon shows an increased content of non-formula elements such as Ca (an average of 278 ppm), Nb (an average of 102 ppm). The Ti content varies widely, ranging from 20.5 to 152 ppm. Since the increase in Ti content can be caused by the introduction of this non-formula element during superimposed zircon alteration, it is recommended to use the zircon content not exceeding 20 ppm to determine the crystallization temperature [26]. Therefore, only three points (7, 10, and 15), in which the Ti content is minimum and varies slightly ranging from 20.5 to 26.1 ppm, were used for temperature calculations using the Ti-in-zircon thermometer [22]. The absence of superimposed alteration in these grains is confirmed by clear and undisturbed oscillatory zoning structure, the minimum presence or absence of rims, and the lowest Ca content, serving as a geochemical criterion for the undisturbed isotopic-geochemical characteristics of zircon [27]. The average temperature of the zircon crystallization calculated from these selected points was 820 °C.
The REE distribution spectra in zircon from the “younger” age cluster are fundamentally diffe-rent (Fig.2, d). The total REE content (for six points included in the cluster) averages 1608 ppm, almost identical to the group considered. The light REE content is about 753 ppm on average, the heavy REE content is about half of that (on average of 770 ppm), as is the Y content (on average of 936 ppm). Due to this ratio, the REE distribution spectra have a subhorizontal pattern (an average of LuN/LaN = = 21.2). The negative Eu anomaly is less contrasted (an average of Eu/Eu* = 0.39), and the Ce anomaly is reduced and nearly absent (Ce/Ce* = 2.15). This REE distribution pattern is a typical feature of hydrothermal-metasomatic type zircon [23, 28]. The Th/U ratio is decreased (averaging 0.25) compared to the “older” cluster. The Hf content remains at approximately the same level (averaging 13040 ppm), and the Ca content is higher than in zircon cores (averaging 368 ppm). The Ti content in this zircon group is significantly higher; it ranges from 43.8 to 222 ppm, averaging 133 ppm, which excludes the use of this element as a thermometer.
Zircons from granites of the second phase (sample TH1-2)
The zircon is primarily represented by idiomorphic grains elongated up to 150-250 µm (rarely up to 350 µm) in length and reaching 100-150 µm in the transverse direction (see Fig.1, b). Accordingly, the elongation coefficient varies from 1:2 to 1:3, in single cases reaching 1:4 (e.g. grain with points 3.1 and 3.2). The central part of the grain, making up to 80-90 % of the total volume, is characterized by a thin banded growth oscillatory zoning in light grey tones in CL images. In some grains in the central part, a semblance of sector zoning can be observed with the appearance of areas differing in color in CL (e.g. grains with points 2.1 and 5.1). Almost in all grains there is a marginal zone characterized by black coloured in CL. The thickness of the zone is maximum at the tops of elongated grains (growth areas of dipyramid), reaching 40 µm. Along the prism boundaries the thickness of the zone decreases to the first microns. The black marginal zone in CL as though to envelop the entire central part of the grain and its outer and inner boundaries conform to the oscillatory zoning manifested in the central part, without intersecting its internal structure. Therefore, there is no reason to consider the central and marginal zones as cores and rims, as is the case with zircon from granites of the first phase.
Zircon from the second phase granites was dated using the U-Pb method at 12 points within six grains. The central and rim parts, which differ significantly in colour in CL images, were analyzed in each grain. The results of the isotopic-geochemical study of zircon are given in Table 1. Seven points form a single cluster in the concordia diagram with the concordant age value of 247 ± 2 Ma (MSWD = 1.12, Fig.3, a). These points include all six points from the central part of the grains and point 3.2, which is in the marginal zone. Individual 206Pb/238U age values for points from the central part are within a narrow range of 244-251 Ma with an average of 247 Ma, coinciding with the concordant age value for this group of points. Five points (except for point 3.2) from the rim have a wider range of individual 206Pb/238U age values from 235 to 281 Ma. Points 1.2 and 6.2 with 206Pb/238U ages of 235 and 236 Ma are characterized by an age rejuvenation, which can be explained by the loss of radiogenic lead from more metamict domains in the zircon. Points 2.2, 5.2, and 4.2 with individual 206Pb/238U ages older, are about 259; 273; and 281 Ma, with younger concordant U-Pb ages of the central parts in the same zircon grains. Points 5.2 and 4.2 have higher U (3303 and 3444 ppm) and radiogenic 206Pb (123 and 132 ppm) contents than other points. Point 2.2 is characterized by an anomalously high content of total (non-radiogenic) 206Pb – 10.65 %. Therefore, the older 206Pb/238U age values for these three rim points do not reflect the actual crystallization age and contradict the age relationships with the central parts of the same zircon grains. A positive correlation between 206Pb/238U age values and uranium content at these points has previously been reported in cases where zircon has been studied with a high-resolution ion probe (different models of SHRIMP and Cameca), and the zircon itself had a high uranium content at the analysis point, exceeding 1000-2500 ppm [29-31]. An increased uranium content leads to damage to the crystalline structure of zircon during radioactive decay. Therefore, the emission of lead ions is increased compared to that of uranium and uranium oxide ions when measured on a high-resolution ion probe. It has been determined that the relative age overestimation can be up to 3 % per 1000 ppm of uranium [30]. In the case of zircon from uranium-bearing granites in the Southern China [32], it was shown that uranium-enriched marginal parts of zircon had age values 40 Ma older than the major part of zircon with lower uranium content (268 and 228 Ma, respectively).
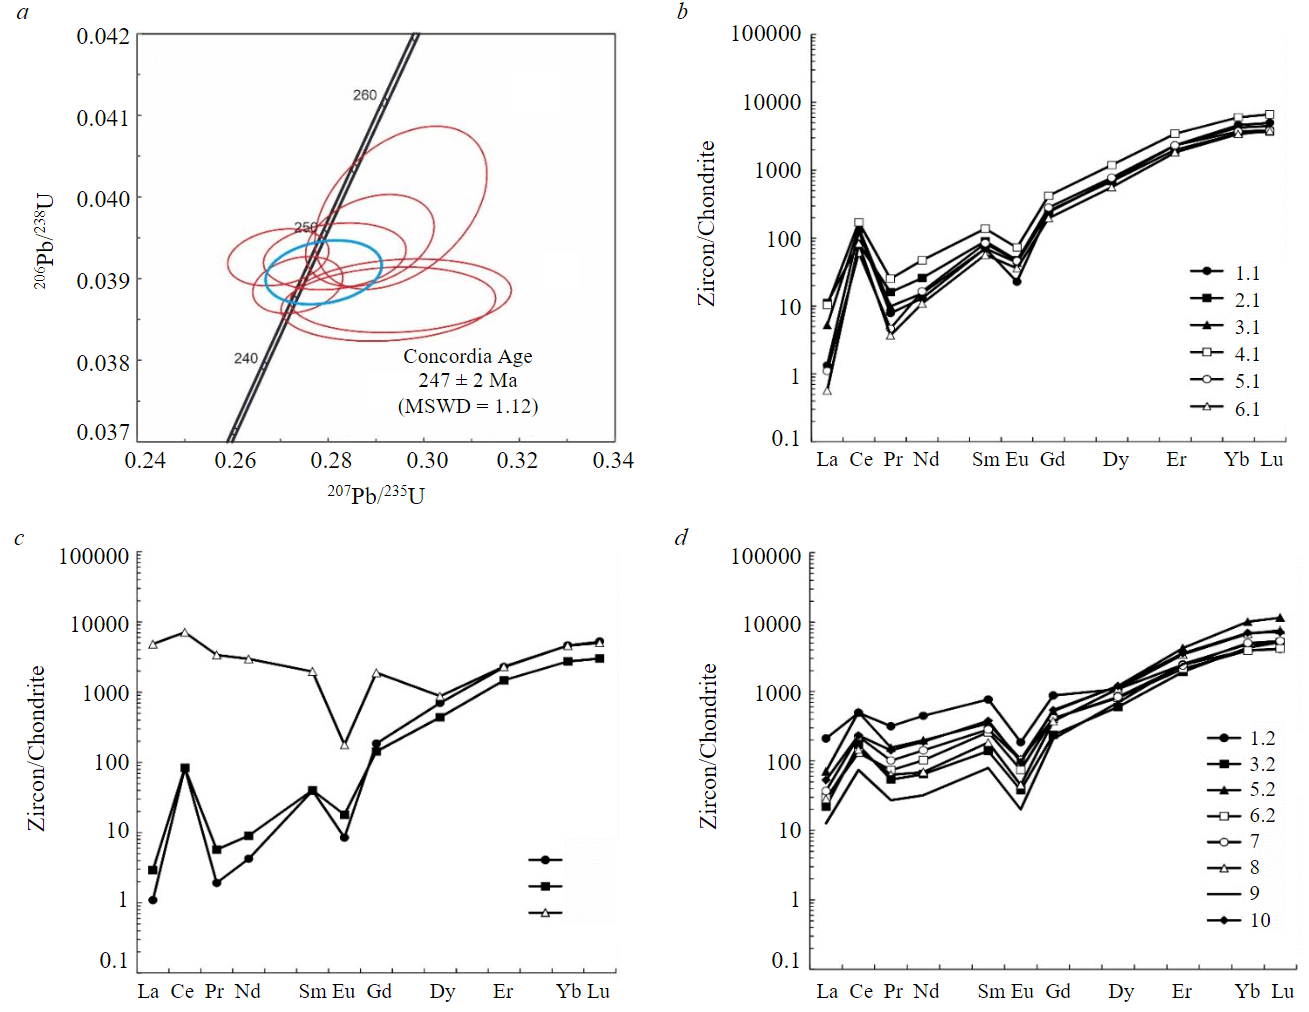
Fig.3. The concordance diagram (a) and the REE distribution spectra (b-d), normalized to chondrite CI, for zircons from the second phase granites (sample TH1-2)
The content of trace and rare earth elements was measured in zircon at five additional points (in the marginal zones black in CL image), in addition to the points with age determination (Table 3). The REE distribution spectra in the central parts are characterized by a differentiated distribution pattern increasing from light to heavy REE (Fig.3, b). The LuN/LaN ratio is 2646 on average. The total REE content is determined to be 1516 ppm, with heavy REE significantly dominating over light REE (averaging 1421 and 79.9 ppm, respectively). All REE distribution spectra from this group are similar to each other, slightly differing in the level of light REE content (Fig.3, b). The negative Eu anomaly (an average of Eu/Eu* = 0.29) and the positive Ce anomaly (an average of Ce/Ce* = 26.7) are shown. The U content varies widely, ranging from 218 to 1036 ppm with an average of 560 ppm. The Th content ranges from 128 to 565, with an average of 319 ppm. The Th/U ratio (by SIMS method) averages 0.58. Similarly, to the zircon cores from granites of the first phase, the established geochemical features of the central parts of zircon grains from granites of the second phase correspond to the characteristics of zircon of magmatic genesis [23]. The Y content averages 2044 ppm, Hf – 11343 ppm. The Ca content in this group of zircons is unequal – in three points it does not exceed 3 ppm, in three other points it varies from 21.4 to 594 ppm. Point 4.1, with the highest Ca content, also has the maximum U and light REE content, typical of altered zircon. The content of other non-formula elements, Ba and Sr, is quite low in all points, indicating minor alteration associated with the introduction of incompatible elements. The titanium content varies widely from 11.5 to 47.8 ppm and is positively correlated with the Ca content, which serves as an indicator of superimposed zircon alteration. Therefore, for temperature calculation using Ti-in-zircon as a thermometer [22], only four points (1.1, 3.1, 5.1, and 6.1) with minimum and consistent Ti content varying from 11.5 to 24.5 ppm, were used. The average value of zircon crystallization temperature calculated from these points is 798 °C.
Table 3
Content of trace elements (ppm) in zircons from granites of the second phase of the Belokurikhinsky massif (sample ТН1-2)
|
Component |
Zircon from the central parts of grains and cores |
Zircon from the marginal parts of the grains |
|||||||||||||||
|
1.1 |
2.1 |
3.1 |
4.1 |
5.1 |
6.1 |
1.2 |
3.2 |
5.2 |
6.2 |
7 |
8 |
9 |
10 |
4.2 |
11 |
2.2 |
|
|
La |
0.31 |
2.63 |
1.23 |
2.43 |
0.26 |
0.13 |
49.8 |
5.18 |
16.7 |
6.91 |
8.70 |
6.68 |
2.98 |
12.5 |
0.26 |
0.69 |
1145 |
|
Ce |
77.2 |
50.8 |
87.1 |
105 |
37.2 |
50.7 |
302 |
104 |
309 |
80.5 |
138 |
89.2 |
45.3 |
143 |
50.8 |
51.1 |
4343 |
|
Pr |
0.72 |
1.48 |
0.91 |
2.34 |
0.43 |
0.34 |
29.3 |
5.01 |
14.4 |
6.80 |
9.36 |
5.86 |
2.52 |
13.1 |
0.18 |
0.53 |
314 |
|
Nd |
5.91 |
11.7 |
6.98 |
21.5 |
7.45 |
4.98 |
204 |
29.4 |
90.3 |
46.7 |
64.6 |
31.4 |
14.6 |
86.3 |
1.93 |
4.12 |
1357 |
|
Sm |
10.5 |
13.3 |
10.4 |
20.3 |
12.4 |
8.40 |
113 |
20.5 |
51.1 |
38.5 |
41.8 |
27.2 |
11.7 |
56.0 |
5.84 |
5.91 |
290 |
|
Eu |
1.28 |
2.67 |
2.44 |
4.09 |
2.58 |
2.02 |
10.5 |
2.14 |
5.94 |
4.19 |
5.82 |
2.52 |
1.13 |
5.36 |
0.48 |
1.01 |
9.99 |
|
Gd |
47.9 |
49.9 |
48.6 |
83.4 |
56.0 |
39.0 |
174 |
47.0 |
104 |
81.0 |
81.5 |
74.3 |
41.3 |
107 |
36.8 |
28.4 |
375 |
|
Dy |
176 |
169 |
179 |
292 |
190 |
138 |
267 |
147 |
297 |
199 |
205 |
270 |
171 |
294 |
173 |
108 |
215 |
|
Er |
373 |
319 |
371 |
551 |
371 |
292 |
390 |
307 |
676 |
340 |
378 |
547 |
398 |
570 |
363 |
235 |
368 |
|
Yb |
744 |
560 |
684 |
970 |
599 |
549 |
637 |
689 |
1629 |
624 |
803 |
1095 |
775 |
1127 |
742 |
439 |
741 |
|
Lu |
123 |
91.5 |
111 |
164 |
94.9 |
93.8 |
100 |
127 |
286 |
102 |
131 |
188 |
126 |
176 |
129 |
73.9 |
123 |
|
Li |
7.90 |
0.72 |
10.1 |
4.92 |
0.17 |
2.53 |
54.5 |
33.0 |
26.5 |
35.8 |
45.4 |
130 |
68.0 |
77.9 |
60.4 |
12.2 |
51.8 |
|
P |
195 |
353 |
284 |
718 |
296 |
371 |
5804 |
248 |
513 |
494 |
448 |
988 |
500 |
1033 |
268 |
286 |
1448 |
|
Ca |
2.91 |
235 |
21.4 |
594 |
1.99 |
1.56 |
9371 |
46.5 |
59.1 |
110 |
74.4 |
330 |
47.2 |
118 |
1.70 |
6.51 |
275 |
|
Ti |
11.5 |
39.1 |
16.2 |
47.8 |
24.5 |
22.5 |
271 |
20.5 |
69.0 |
127 |
212 |
209 |
49.7 |
245 |
5.46 |
19.9 |
184 |
|
Sr |
0.72 |
1.63 |
0.72 |
1.00 |
0.68 |
0.53 |
6.92 |
1.21 |
2.68 |
2.01 |
1.39 |
2.56 |
1.15 |
2.36 |
0.88 |
0.59 |
5.14 |
|
Y |
1924 |
1665 |
1982 |
3132 |
1998 |
1560 |
2255 |
1815 |
3673 |
1927 |
2225 |
3051 |
1979 |
3149 |
1937 |
1240 |
2058 |
|
Nb |
60.2 |
33.1 |
75.1 |
31.2 |
24.0 |
22.0 |
88.6 |
59.1 |
81.9 |
57.4 |
78.9 |
71.6 |
55.1 |
73.7 |
60.5 |
29.3 |
75.9 |
|
Ba |
2.07 |
1.19 |
0.75 |
1.96 |
1.50 |
1.20 |
6.78 |
2.39 |
3.10 |
4.13 |
3.58 |
3.87 |
2.89 |
4.71 |
0.65 |
1.71 |
27.6 |
|
Hf |
12294 |
10632 |
12409 |
11452 |
10821 |
10450 |
14113 |
14752 |
14947 |
15670 |
14660 |
16997 |
18687 |
18858 |
17279 |
12699 |
15818 |
|
Th |
552 |
128 |
336 |
565 |
151 |
182 |
1753 |
741 |
1926 |
921 |
1078 |
1298 |
771 |
1557 |
1633 |
282 |
1229 |
|
U |
1036 |
218 |
586 |
964 |
244 |
312 |
2887 |
2757 |
5294 |
3204 |
4029 |
7482 |
4907 |
6607 |
5761 |
1085 |
2746 |
|
Th/U |
0.53 |
0.59 |
0.57 |
0.59 |
0.62 |
0.58 |
0.61 |
0.27 |
0.36 |
0.29 |
0.27 |
0.17 |
0.16 |
0.24 |
0.28 |
0.26 |
0.45 |
|
Eu/Eu* |
0.17 |
0.32 |
0.33 |
0.30 |
0.30 |
0.34 |
0.23 |
0.21 |
0.25 |
0.23 |
0.30 |
0.17 |
0.16 |
0.21 |
0.10 |
0.24 |
0.09 |
|
Ce/Ce* |
39.2 |
6.24 |
19.9 |
10.6 |
26.9 |
57.1 |
1.91 |
4.94 |
4.83 |
2.84 |
3.69 |
3.45 |
3.99 |
2.69 |
57.5 |
20.5 |
1.75 |
|
ΣREE |
1560 |
1272 |
1502 |
2216 |
1371 |
1178 |
2277 |
1482 |
3479 |
1530 |
1867 |
2338 |
1589 |
2590 |
1503 |
948 |
9280 |
|
ΣLREE |
84.1 |
66.7 |
96.2 |
131 |
45.3 |
56.2 |
584 |
144 |
431 |
141 |
220 |
133 |
65.4 |
255 |
53.2 |
56.5 |
7158 |
|
ΣHREE |
1464 |
1189 |
1393 |
2060 |
1311 |
1111 |
1569 |
1316 |
2991 |
1347 |
1599 |
2175 |
1511 |
2274 |
1443 |
885 |
1822 |
|
LuN/LaN |
3773 |
335 |
868 |
650 |
3530 |
6719 |
19.4 |
236 |
165 |
142 |
145 |
271 |
407 |
135 |
4822 |
1034 |
1.04 |
|
LuN/GdN |
20.7 |
14.8 |
18.5 |
15.9 |
13.7 |
19.5 |
4.66 |
21.8 |
22.3 |
10.2 |
13.0 |
20.5 |
24.8 |
13.3 |
28.4 |
21.0 |
2.66 |
|
SmN/LaN |
53.5 |
8.12 |
13.5 |
13.4 |
76.8 |
100 |
3.64 |
6.34 |
4.92 |
8.90 |
7.69 |
6.51 |
6.30 |
7.15 |
36.3 |
13.7 |
0.41 |
|
T(Ti), °C |
756 |
880 |
787 |
903 |
829 |
820 |
1151 |
811 |
948 |
1031 |
1109 |
1108 |
907 |
1134 |
692 |
807 |
1087 |
The black zircon marginal zones in CL image were analyzed at 11 points. Common to them is an increased U content (ranging from 1085 to 748 with an average of 4251 ppm) compared to the central parts of the grains. The Th content is also higher than in the central parts, but its increase is less significant – ranging from 282 to 1926, averaging 1199 ppm. The Th/U ratio in the marginal parts of the grains is accordingly slightly lower than in the central parts, averaging 0.30. The marginal zones are characterized by an increased Li content (averaging 54.1 ppm), in the central parts of the grains it is about an order of magnitude lower (averaging 4.39 ppm).
According to the pattern of REE distribution spectra, the analyzed marginal zones can be classified into three groups. The first group includes two points – 4.2 and 11 (Fig.3, c), where the REE distribution is similar to that in the central parts of the grains. The REE distribution spectra in them have a differentiated distribution pattern, trending from light to heavy REE (LuN/LaN averages 2928). The total REE content averages 1226 ppm. As well as in the central parts of the grains, these points show a positive Ce anomaly (Ce/Ce* averages 39.0) and a negative Eu anomaly (Eu/Eu* averages 0.17). However, there is no correlation between these parameters and U content – the U content varies significantly (from 1085 at point 11 to 5761 ppm at point 4.2). There is the same significant variation in hafnium content as well – 12699 and 17279 ppm, respectively. The Ca content, like other non-formula elements for zircon such as Sr and Ba, is low, not exceeding a few ppm. The average value of the crystallization temperature determined by the Ti-in-zircon thermometer at points 4.2 and 11 is 750 °C.
The second group of points is the most numerous; it includes points 1.2, 3.2, 5.2, 6.2, 7, 8, 9, and 10. The REE distribution spectra for these points are similar to each other, differing in the level of light REE and, to a lesser extent, heavy REE (Fig.3, d). A distinctive feature of the spectra is their flattening (LuN/LaN averaging 190), primarily due to increased content of light REE. The total LREE content averages 247 ppm, significantly higher than at points 4.2 and 11 (54.9 ppm). Accordingly, the total REE content is also increased, with an average of 2144 ppm. The negative Eu anomaly is well defined (average Eu/Eu* = 0.22). The positive Ce anomaly is significantly reduced (Ce/Ce* averaging 3.54). The Hf content is relatively high, averaging 16085 ppm. These points are character-rized by an increased content of non-formula elements – Ca, Sr, Ba, Ti. Point 1.2 shows anomalously high Ca and P content, possibly associated to the inclusion of apatite microinclusions within the analyzed region. Even without considering point 1.2, the average Ca content is 112 ppm, indicating zircon rim formation under the influence of a fluid enriched in incompatible elements. The Ti content varies from 20.5 to 270 ppm, reflecting the effects of a fluid. The zircon crystallization temperature determined by the Ti-in-zircon as a thermometer for point 3.2 with the minimum Ti content of 20.5 ppm is 810 °C.
Point 2.2 differs significantly from the other groups in the pattern of REE distribution (Fig.3, c). The light REE content at this point is 7158 ppm. The slope of the spectra in the LREE region is atypical for zircon – “negative”, with a decrease in the chondrite-normalized content as the LREE order number increases. The slope and level of heavy REE content for point 2.2 match those of other points belonging to the black high uranium rims in the CL. As a result, the REE distribution spectra for this point has the form of “bird's wing”. It is not excluded that this form of the spectra is a specific manifestation of the tetrad effect in the REE distribution, which has previously rarely been observed in zircon. An elevated P content of 1448 ppm is recorded at point 2.2. However, this is not high enough to link the enrichment of zircon with light REE to the incorporation of apatite and (or) monazite microinclusions. The presence of apatite is also contradicted by an elevated, but not anomalously high, Ca content of 275 ppm. In addition, a reduced positive Ce anomaly (Ce/Ce* averages 1.75), not typical for apatite and monazite, is observed in the REE distribution spectra. If the sharp increase in the light REE content is due to inclusion of microinclusions of these minerals, a positive Ce anomaly is absent. The negative Eu anomaly at point 2.2 is the maximum (Eu/Eu* averages 0.09) among the whole zircon abundance from the sample TH1-2. The content of other trace elements at point 2.2 is approximately at the same level as determined for the main group of points from the black marginal zones in CL. The U content is 2746 ppm, even lower than the average value for the marginal zones. The Th/U ratio is 0.45.
Zircons from third phase granites (sample ТН3-1)
Originally, about 30 zircon grains were separated from the granites of the third phase (leucogranites) emplaced in the mount M-2974. About a third of them are predominantly xenomorphic grains or their fragments, not exceeding 100 µm in transverse direction (see Fig.1, c). In CL image, they are characterized by dark grey, up to black, color and spotted internal structure, sometimes porous. According to the SEM-EDS data, these zircon grains contain a few microinclusions, among which xenotime, F-apatite, uraninite, and albite have been identified. The size of the microinclusions does not usually exceed 5 μm, only xenotime inclusion in one zircon crystal reaches 70 μm [15]. The second population of zircon is represented by slightly elongated (elongation coefficient in the range of 1:2-1:3) rounded grains, usually not exceeding 100 microns in elongation. They are characterized by thin banded growth oscillatory zoning in grey and dark grey tones. A few grains have dark grey rims in CL with “blurred” zoning or its absence, up to half the volume of grain. Dating of eight grains from the second population showed a wide range of 207Pb/206Pb ages ranging from 965 to 1928 Ma, with three points having a similar age of about 1600 Ma. Excluding one point, all others are situated on the Concordia. Obviously, this population of zircon is xenogenic with respect to leucogranites of the Belokurikhinsky massif, whose age was previously determined by the Ar-Ar method to be about 250 Ma [13]. The wide range of ages determined for xenogenic zircon suggests a detrital nature and suggests a sedimentary source.
The 206Pb/238U age was determined for the three dark grains in CL image with the absence of zoning and spotty internal structure, closer to the assumed age for the Belokurikhinsky massif (about 259, 268, and 274 Ma, see Table 1). All three points are characterized by high U content (from 5873 to 10283 ppm) with rather moderate Th content (from 91.2 to 618 ppm). Accordingly, the Th/U ratio is low, for two points is 0.01 and for the third one is 0.11. In the concordia diagram, the ellipses of error of the points are subconcordant and tend to the interval of age values 250-280 Ma (Fig.4, a). Two points with the maximum U content are located at the top of the diagram. It is not possible to correctly calculate the age value common to the three points. Therefore, the separation of zircon from the same sample of leucogranite TH3-1 was repeated. Of the 40 zircon grains, re-separated and placed in the mount M-3066, elongated grains with dipyramidal-prismatic morphology dominated, reaching 100-250 µm (elongation coefficient ranging from 1:2 to 1:3). A characteristic feature is the zonal structure of the grains with the light grey or grey in CL image central part with thin banded growth oscillatory zoning and the black marginal zone, with the maximum thickness at the tips of the grains not exceeding 30 µm (see Fig.1, c).
Dating was determined at ten points in nine grains. In one nearly black grain in CL with the absence of zoning, two points gave the age of about 1815 Ma, allowing considering this grain as xenogenic to the leucogranite. The other eight points were located in the dark rim zones visible in CL. Seven of these points formed a cluster with the concordant age of 255 ± 4 Ma (MSWD = 0.48, Fig.4, b). Point 7.1, characterized by the lowest level of U content of 397 ppm, has a 206Pb/238U age of about 232 Ma (see Table 1). In the points forming a concordant cluster, the U content varies from 805 to 6617 with an average value of 3168 ppm. The Th content also varies significantly (from 273 to 1354 with an average of 726 ppm), showing no correlation with U. Thus, the Th/U ratio ranges from 0.06 to 1.49, averaging 0.43.
A detailed study of the trace element composition of zircon from leucogranites of the Belokurikhinsky massif based on a significant number of analysis points (several dozen), including data on major element content (EPMA method), volatile components, and oxygen isotope composition (SIMS method), was carried out [15]. This paper presents geochemical data for dated grains only, excluding xenogenic zircon (Table 4).
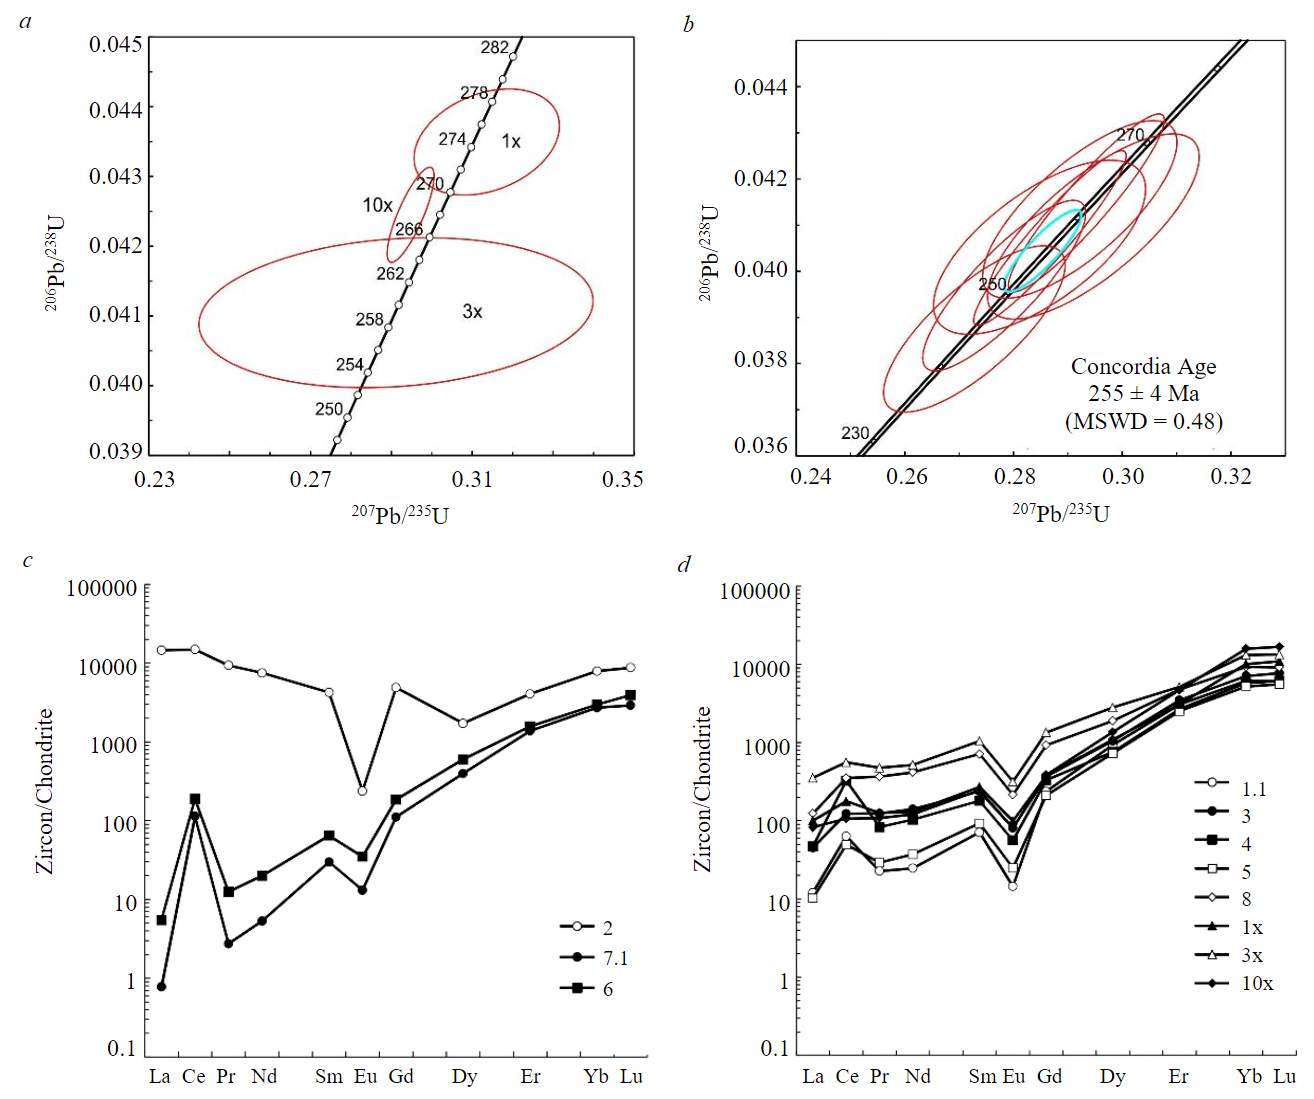
Fig.4. The concordance diagram (a, b) and the REE distribution spectra (c, d), normalized to chondrite CI, for zircons from the third phase granites (sample TH3-1)
Based on the pattern of the REE distribution spectra, the analyzed zircon from leucogranite can be grouped into three groups. The first group includes two points – 7.1 and 6 from the mount M-3066 (Fig.4, c), characterized by differentiated REE distribution spectra with an increase from light to heavy REE (LuN/LaN averages 2232). The total REE content averages 11039 ppm. These points show a positive Ce anomaly (Ce/Ce* averages 50.3) and a negative Eu anomaly (Eu/Eu* averages 0.27). These compositional features are typical for zircons of magmatic origin [23]. The U and Hf content is the less than all compared to other points in this sample, averaging 878 and 10979 ppm, respectively. The average P and Li content is lower than in other zircon groups – 257 and 16.3 ppm. The content of Ca at points 7.1 and 6 is 5.39 and 86.1 ppm, respectively. Other non-formula elements for zircon, such as Sr and Ba, are present at a low levels (Sr – less than 1 ppm, Ba – no more than a few ppm). The average crystallization temperature determined by the Ti-in-zircon thermometer is 808 °C for points 7.1 and 6.
The second group consists of eight points (1.1, 3, 4, 5, 8 from the mount M-3066 and 1x, 3x, 10x from the mount M-2974). The REE distribution spectra for these are similar to each other, differing in the level of light REE and almost correspond in the heavy REE (Er-Lu) region (Fig.4, d). A distinctive feature of the spectra is the slope (LuN/LaN averages 221) due to increased content of light REE. The total LREE content averages 258 ppm, significantly higher than at points 7.1 and 6 (99.9 ppm). The total REE content is increased, averaging 3027 ppm. The negative Eu anomaly is well defined (Eu/Eu* averages 0.24). The positive Ce anomaly is significantly reduced (Ce/Ce* averages 2.41). The U content varies from 3638 to 14196, averaging 6912 ppm. The average Li content is anomalously high, averaging 90.3 ppm. Such high Li content is atypical for zircons of magmatic genesis [33]; it can be explained by the influence of a fluid with a significant crustal component. The P content in this zircon group is higher (1040 ppm) than for the first group zircon with Ce and Eu anomalies. The P and Y are positively correlated, possibly explained by the xenotime type substitution: Si4+ + Zr4+ = P5+ + Y3+ [34].
Table 4
Content of trace elements (ppm) in zircons from granites of the third phase of the Belokurikhinsky massif (sample ТН3-1)
|
Component |
Zircon from the central parts of grains and cores |
Zircon from the marginal parts of the grains |
||||||||||
|
6 |
7.1 |
1.1 |
3 |
4 |
5 |
8 |
1х |
3х |
10х |
2 |
||
|
La |
1.30 |
0.18 |
2.85 |
10.7 |
11.1 |
2.43 |
29.3 |
23.7 |
83.6 |
19.5 |
3450 |
|
|
Ce |
116 |
69.5 |
38.9 |
75.3 |
198 |
30.2 |
216 |
109 |
342 |
65.3 |
9125 |
|
|
Pr |
1.16 |
0.25 |
2.11 |
11.5 |
7.68 |
2.70 |
33.9 |
11.7 |
44.1 |
10.1 |
867 |
|
|
Nd |
9.11 |
2.42 |
11.3 |
64.1 |
47.2 |
17.0 |
190 |
59.4 |
237 |
55.1 |
3426 |
|
|
Sm |
9.58 |
4.41 |
10.5 |
35.1 |
26.6 |
13.7 |
105 |
40.0 |
154 |
36.5 |
627 |
|
|
Eu |
1.97 |
0.74 |
0.81 |
4.55 |
3.15 |
1.40 |
12.1 |
5.59 |
17.7 |
4.54 |
13.4 |
|
|
Gd |
36.8 |
22.1 |
47.2 |
73.0 |
65.7 |
42.0 |
183 |
75.2 |
267 |
76.7 |
972 |
|
|
Dy |
147 |
97.5 |
229 |
258 |
186 |
180 |
466 |
267 |
689 |
335 |
422 |
|
|
Er |
251 |
221 |
491 |
555 |
429 |
402 |
761 |
493 |
822 |
751 |
649 |
|
|
Yb |
481 |
437 |
989 |
1142 |
924 |
836 |
1490 |
1624 |
2118 |
2553 |
1275 |
|
|
Lu |
96.5 |
71.7 |
149 |
190 |
151 |
137 |
225 |
268 |
329 |
412 |
215 |
|
|
Li |
25.5 |
7.02 |
94.1 |
59.0 |
32.0 |
60.4 |
119 |
119 |
81.4 |
157 |
99.6 |
|
|
P |
305 |
209 |
594 |
739 |
241 |
593 |
1316 |
1146 |
1699 |
1991 |
3008 |
|
|
Ca |
86.1 |
5.39 |
82.7 |
128 |
23.7 |
34.0 |
392 |
522 |
1488 |
187 |
369 |
|
|
Ti |
30.7 |
12.6 |
159 |
166 |
21.5 |
36.9 |
892 |
33.1 |
137 |
14.6 |
87.5 |
|
|
Sr |
0.94 |
0.44 |
1.29 |
2.36 |
1.22 |
1.18 |
5.23 |
9.19 |
20.9 |
4.52 |
6.33 |
|
|
Y |
1612 |
1118 |
2604 |
2934 |
2201 |
2136 |
4830 |
2776 |
5456 |
4068 |
3376 |
|
|
Nb |
58.6 |
44.3 |
69.2 |
83.0 |
87.6 |
47.9 |
181 |
59.7 |
173 |
52.5 |
85.5 |
|
|
Ba |
4.33 |
1.97 |
2.62 |
3.97 |
4.06 |
2.10 |
12.3 |
13.2 |
29.9 |
9.42 |
46.5 |
|
|
Hf |
10004 |
11955 |
15804 |
18658 |
12864 |
16126 |
18342 |
34201 |
27348 |
31837 |
19498 |
|
|
Th |
1148 |
215 |
615 |
705 |
1866 |
534 |
1920 |
117 |
1102 |
129 |
2181 |
|
|
U |
1217 |
539 |
5516 |
4311 |
3638 |
3947 |
9121 |
7263 |
7307 |
14196 |
7320 |
|
|
Th/U |
0.94 |
0.40 |
0.11 |
0.16 |
0.51 |
0.14 |
0.21 |
0.02 |
0.15 |
0.01 |
0.30 |
|
|
Eu/Eu* |
0.32 |
0.23 |
0.11 |
0.27 |
0.23 |
0.18 |
0.27 |
0.31 |
0.27 |
0.26 |
0.05 |
|
|
Ce/Ce* |
22.9 |
77.8 |
3.83 |
1.64 |
5.19 |
2.85 |
1.66 |
1.58 |
1.36 |
1.13 |
1.28 |
|
|
ΣREE |
1151 |
927 |
1972 |
2419 |
2050 |
1664 |
3714 |
2978 |
5103 |
4319 |
21040 |
|
|
ΣLREE |
128 |
72.4 |
55.1 |
162 |
264 |
52.3 |
470 |
203 |
707 |
150 |
16867 |
|
|
ΣHREE |
1012 |
850 |
1905 |
2218 |
1756 |
1596 |
3126 |
2729 |
4224 |
4128 |
3533 |
|
|
LuN/LaN |
717 |
3747 |
504 |
171 |
131 |
542 |
74.1 |
109 |
37.9 |
204 |
0.60 |
|
|
LuN/GdN |
21.2 |
26.2 |
25.6 |
21.0 |
18.6 |
26.3 |
9.94 |
28.9 |
10.0 |
43.4 |
1.79 |
|
|
SmN/LaN |
11.8 |
38.4 |
5.89 |
5.25 |
3.83 |
9.02 |
5.76 |
2.70 |
2.96 |
3.00 |
0.29 |
|
|
T(Ti), °C |
853 |
764 |
1065 |
1071 |
815 |
873 |
1393 |
861 |
1042 |
777 |
979 |
|
The increased content of Y, P and Ca due to microinclusions of xenotime or other phosphates, not detected by electron microscopy, is excluded due to the absence of a significant increase in the P content with an anomalous increase in the REE and Y content that has been established for some zircon grains from the same sample leucogranite [15]. In [15] it is shown that at the highest of Y and Ca content (50700 and 7200 ppm, respectively), the zircon contains only 7900 ppm of phosphorus. Such a ratio of elements excludes phosphate microinclusions in the field of analysis. It can be assumed that in this case, the xenotime type substitution scheme is of subordinate significance, while the substitution with proton participation according to the scheme H+ + (REE, Y)3+ = Zr4+ dominates [35]. The Hf content is at a high level, averaging 21897 ppm. The three dark grains without zoning analyzed in the mount M-2974 have a much higher average Hf content, 31129 ppm, than the marginal zones of zircon from the mount M-3066. The points of this group are characterized by a high content of non-formula elements – Ca (an average of 357 ppm), Sr (5.73 ppm), Ba (9.69 ppm) and Ti (183 ppm). In two points from this group (4 and 10x), the Ti content is not overestimated due to the influence of the liquid, reaching to 21.5 and 14.6 ppm, respectively. The crystallization temperature value determined by the Ti-in-zircon thermometer for these two points averages 796 °C.
Point 2 differs significantly from the other groups in the distribution pattern of REE (Fig.4, c). Its light REE content is 16867 ppm, while the slope angle of the spectra in the LREE region is “negative”, with a decrease in the normalized content to chondrite as the atomic number of LREE increases. The spectra in the heavy REE region, starting with Dy, are consistent with the spectra of other points in this sample. As observed for one zircon grain from the second phase (point 2.2), the REE distribution spectra for this point from the third phase also takes on a “bird's wing” shape. Point 2 recorded the highest P content relative to other grains (3008 ppm) was recorded, but not high enough to cause the enrichment of zircon with light REE by inclusion of apatite and (or) monazite microinclusions. The increased but not anomalously high Ca content of 369 ppm also does not correspond to apatite entering the analysis region. The REE distribution spectra shows a reduced positive Ce anomaly (Ce/Ce* = 1.28), which is characteristic exclusively for zircon. A negative Eu anomaly at point 2 is the maximum (Eu/Eu* = 0.05) of the whole zircon sample from the leucogranite sample. The U content is 7320 ppm, which is at the level of the zircon group discussed above. The Th/U ratio is 0.30.
Zircons from leucogranites of the third phase of the Tochilny stock (sample 2016-5)
The leucogranites of the Tochilny stock belong to the third phase of the Belokurikhinsky massif intrusion. The zircon is mainly represented by elongated idiomorphic grains, with elongation sizes ranging from 200-350 µm (rarely up to 450 µm), and elongation coefficients of 1:2-1:3, in individual cases reaching 1:6 (e.g. the grain with point 8, see Fig.1, d). A significant portion of the grains has a heterogeneous structure with a light grey central part in CL image. The central part, as a rule, has an idiomorphic shape, with boundaries parallel to the external edges of the grain (e.g. grain with point 5). The marginal part, distinguished by dark grey in CL image, envelops the central part completely, with the highest thickness (up to 40-90 µm) at the tops of the dipyramid. Тhe thin banded growth oscillatory zoning is observed in the central and marginal zones, with oriented parallel between to each other, as well as with the external boundaries of the grain. Therefore, this relationship between zones internal to the grain should not be viewed as a core-rim combination reflecting two discrete events, a magmatic event corresponding to the zircon core and a metamorphic or hydrothermal event leading to the formation of a rim. Most probably, the presence of dark and black marginal zones in CL image is a result of enrichment of magmatic melt during zircon crystallization with incompatible elements, including uranium, primarily determining the intensity of colour in CL image. This effect was noted for zircon crystallized from a fractionated granite melt [32].
The U-Pb ages were determined at ten points, one in each grain. Points 2, 4, 5, 9 are located in the marginal zones without zoning, contrasting with dark colour from the light grey in CL images of the central zones. The U content in these points averages 1469 ppm, and the Th/U ratio is 0.34 (see Table 1). The other points (1, 3, 6, 7, 8, and 10) are also located in the marginal zones but they contain thin-banded growth oscillatory zoning and in CL by colour more similar to the central parts of the zircon grains. The U content in them averages 697 ppm, the Th/U ratio is 0.41. On the concordia diagram, all ten analyzed points form a cluster within the age range of 230-270 Ma (Fig.5, a). Considering the effect of the overestimated 206Pb/238U age for high-uranium zircon previously noted, the three oldest high-uranium points (5, 9, and 2), as well as point 6, which is highly discordant, have been excluded from the concordant age calculation. As a result, the concordant age of 251 ± 2 Ma was determined (MSWD = 0.16, Fig.5, b). If the two points (6 and 7) with the youngest 206Pb/238U age are excluded from the total sample, the concordant age of 256 ± 2 Ma can also be calculated (MSWD = 0.16). The absolute difference between these determinations is 5 Ma with equal values of the determination error and MSWD, the relative difference is 2 % of the granite age, which is comparable to the instrumental uncertainty of the high-resolution ion probe [31]. Considering a possible analytical artefact of U-Pb age overestimation in high-uranium zircon domains, the authors consider the age value of leucogranites of the Tochilny stock at about 251 Ma as more preferable.
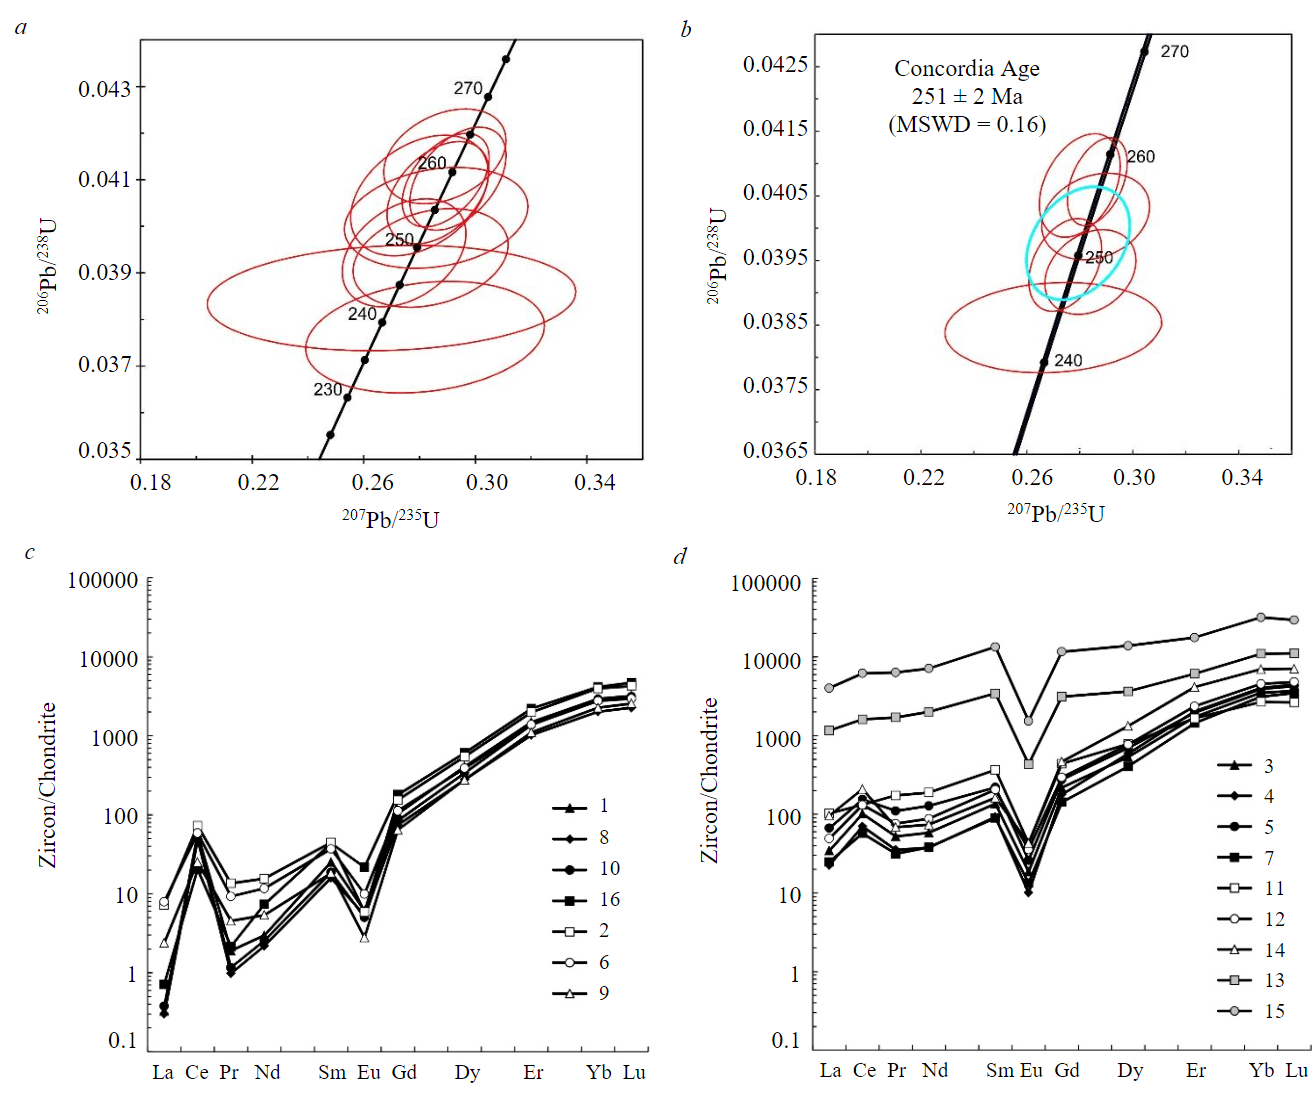
Fig.5. The concordance diagram (a, b) and the REE distribution spectra (c, d), normalized to chondrite CI, for zircons from leucogranites of the Tochilny stock (sample 2016-5)
The geochemistry of zircon from the leucogranites of the Tochilny stock was additionally studied at six points (see Fig.1, d, Table 5). Points 11, 14 and 15 are located in irregularly shaped domains, black in CL image, associated with the central parts of grains. Points 12 and 16 are located in the dark grey central part, point 13 – in the black marginal zone.
Based on the trace element composition, the studied zircon can be conditionally separated into four groups. This is primarily shown in the pattern of REE distribution.
Table 5<
Content of trace elements (ppm) in zircons from leucogranites of the Tochilny stock (sample 2016-5)
|
Component |
Zircon from the marginal parts of grains with thin banded zoning |
Zircon from marginal parts of grains without zoning |
Zircon from central parts of grains and cores |
|||||||||||||
|
1 |
3 |
6 |
7 |
8 |
10 |
2 |
4 |
5 |
9 |
13 |
11 |
12 |
14 |
15 |
16 |
|
|
La |
0.08 |
8.17 |
1.87 |
5.87 |
0.07 |
0.09 |
1.70 |
5.33 |
15.8 |
0.57 |
274 |
24.3 |
11.6 |
22.7 |
952 |
0.17 |
|
Ce |
35.2 |
62.3 |
35.8 |
35.1 |
30.0 |
30.7 |
44.5 |
42.9 |
94.6 |
15.5 |
985 |
80.8 |
80.4 |
128 |
3789 |
12.4 |
|
Pr |
0.18 |
4.86 |
0.86 |
2.92 |
0.09 |
0.11 |
1.26 |
3.28 |
10.2 |
0.42 |
158 |
16.1 |
7.07 |
6.37 |
590 |
0.20 |
|
Nd |
1.35 |
26.7 |
5.33 |
17.4 |
1.00 |
1.16 |
7.09 |
17.2 |
58.4 |
2.46 |
918 |
86.5 |
40.1 |
33.7 |
3261 |
3.35 |
|
Sm |
3.73 |
20.2 |
5.46 |
13.3 |
2.35 |
2.75 |
6.60 |
13.7 |
32.5 |
2.70 |
509 |
54.3 |
30.4 |
23.9 |
1985 |
6.42 |
|
Eu |
0.34 |
1.04 |
0.56 |
0.75 |
0.30 |
0.28 |
0.33 |
0.56 |
1.46 |
0.16 |
24.4 |
2.39 |
2.01 |
2.42 |
86.4 |
1.22 |
|
Gd |
20.6 |
43.4 |
22.4 |
28.2 |
14.8 |
16.8 |
30.7 |
35.5 |
54.7 |
12.8 |
621 |
87.4 |
58.5 |
92.8 |
2318 |
35.7 |
|
Dy |
100 |
131 |
95.3 |
99.5 |
68.4 |
83.3 |
134 |
146 |
171 |
68.1 |
898 |
192 |
190 |
326 |
3422 |
149 |
|
Er |
238 |
275 |
220 |
230 |
164 |
219 |
317 |
325 |
313 |
177 |
980 |
265 |
378 |
664 |
2826 |
354 |
|
Yb |
473 |
567 |
445 |
503 |
325 |
466 |
640 |
653 |
631 |
366 |
1769 |
432 |
732 |
1127 |
5130 |
668 |
|
Lu |
78.7 |
91.2 |
72.6 |
85.6 |
55.9 |
77.0 |
105 |
109 |
105 |
63.2 |
274 |
65.2 |
118 |
174 |
726 |
116 |
|
Li |
2.15 |
3.44 |
2.39 |
2.94 |
1.39 |
1.64 |
8.16 |
3.40 |
3.45 |
1.65 |
7.32 |
2.88 |
2.40 |
4.71 |
2.61 |
0.73 |
|
P |
193 |
213 |
227 |
155 |
190 |
210 |
231 |
218 |
210 |
95.2 |
14874 |
433 |
300 |
459 |
3080 |
199 |
|
Ca |
0.71 |
42.3 |
63.0 |
37.5 |
1.06 |
0.49 |
10.3 |
28.9 |
88.2 |
3.46 |
22974 |
94.4 |
76.6 |
37.4 |
4255 |
0.83 |
|
Ti |
7.45 |
30.0 |
19.2 |
31.9 |
9.02 |
7.42 |
12.5 |
20.4 |
64.5 |
4.02 |
599 |
128 |
37.2 |
19.2 |
2002 |
7.91 |
|
Sr |
0.41 |
1.55 |
0.61 |
1.14 |
0.35 |
0.51 |
0.69 |
1.15 |
1.87 |
0.53 |
36.4 |
2.20 |
1.54 |
2.79 |
82.9 |
0.57 |
|
Y |
1172 |
1470 |
1130 |
1149 |
844 |
1059 |
1633 |
1656 |
1655 |
843 |
5718 |
1608 |
2044 |
3816 |
15787 |
1783 |
|
Nb |
72.8 |
65.6 |
23.4 |
42.5 |
24.5 |
43.1 |
51.6 |
65.9 |
80.9 |
25.0 |
213 |
89.9 |
56.1 |
31.9 |
1060 |
12.7 |
|
Ba |
1.07 |
2.65 |
1.75 |
1.54 |
1.11 |
0.87 |
0.81 |
1.73 |
2.59 |
0.84 |
21.5 |
3.93 |
2.55 |
2.15 |
110 |
0.84 |
|
Hf |
13915 |
14143 |
12732 |
14521 |
13119 |
13688 |
14340 |
15969 |
13964 |
15929 |
14418 |
14800 |
13470 |
9535 |
19267 |
11527 |
|
Th |
189 |
306 |
190 |
510 |
114 |
179 |
523 |
542 |
464 |
276 |
1236 |
210 |
474 |
1447 |
2000 |
157 |
|
U |
716 |
1335 |
675 |
1230 |
378 |
752 |
1834 |
2444 |
2077 |
1510 |
4789 |
3343 |
2212 |
1279 |
10264 |
422 |
|
Th/U |
0.26 |
0.23 |
0.28 |
0.41 |
0.30 |
0.24 |
0.29 |
0.22 |
0.22 |
0.18 |
0.26 |
0.06 |
0.21 |
1.13 |
0.19 |
0.37 |
|
Eu/Eu* |
0.12 |
0.11 |
0.15 |
0.12 |
0.16 |
0.13 |
0.07 |
0.08 |
0.11 |
0.08 |
0.13 |
0.11 |
0.15 |
0.16 |
0.12 |
0.25 |
|
Ce/Ce* |
72.9 |
2.39 |
6.84 |
2.05 |
89.9 |
75.8 |
7.34 |
2.48 |
1.80 |
7.66 |
1.14 |
0.99 |
2.15 |
2.59 |
1.22 |
16.4 |
|
ΣREE |
952 |
1232 |
905 |
1022 |
662 |
898 |
1289 |
1351 |
1488 |
708 |
7410 |
1307 |
1648 |
2602 |
25087 |
1347 |
|
ΣLREE |
36.8 |
102 |
43.8 |
61.3 |
31.1 |
32.0 |
54.5 |
68.7 |
179 |
18.9 |
2335 |
208 |
139 |
191 |
8593 |
16.2 |
|
ΣHREE |
911 |
1108 |
856 |
947 |
628 |
863 |
1227 |
1268 |
1276 |
686 |
4542 |
1042 |
1476 |
2384 |
14422 |
1323 |
|
LuN/LaN |
9773 |
108 |
373 |
141 |
7528 |
8321 |
594 |
197 |
64.3 |
1076 |
9.63 |
25.9 |
98.3 |
74.0 |
7.34 |
6601 |
|
LuN/GdN |
30.9 |
17.0 |
26.3 |
24.5 |
30.5 |
37.1 |
27.7 |
24.9 |
15.6 |
40.0 |
3.57 |
6.04 |
16.4 |
15.2 |
2.53 |
26.3 |
|
SmN/LaN |
77.0 |
3.95 |
4.67 |
3.62 |
52.6 |
49.5 |
6.21 |
4.10 |
3.30 |
7.64 |
2.97 |
3.58 |
4.19 |
1.69 |
3.34 |
60.7 |
|
T(Ti), °C |
718 |
850 |
804 |
857 |
734 |
717 |
763 |
810 |
939 |
668 |
1304 |
1032 |
874 |
804 |
1609 |
723 |
The first group includes points 1, 8, 10, 16. The REE distribution spectra for them nearly correspond (Fig.5, c) and have a clearly differentiated character of distribution with growth from light to heavy REE (LuN/LaN ratio is equal to average 8056). The total REE content averages 965 ppm. At these points, the positive Ce anomaly (Ce/Ce* averages 63.7) and the negative Eu anomaly (Eu/Eu* on average of 0.16) are well defined. The U and Th content, compared to other points in this sample, is minimum, averaging 567 and 160 ppm, respectively. The content of non-formulaic elements (Ca, Sr and Ba) is at low levels – around 1 ppm or lower. The Ti content remains almost unchanged and averages 7.95 ppm. The average crystallization temperature for this group was determined to be 723 °C.
The second group, which includes points 2, 6, 9, differs from the first group by flatter REE distribution spectra in the light REE region (LuN/LaN averages 681, Fig.5, c). The total REE content remains almost unchanged, averaging 967 ppm. The light REE content increases insignificantly compared to the first group (29.0 and 39.1 ppm, respectively). The positive Ce anomaly decreases (Ce/Ce* averages 7.28), while the negative Eu anomaly remains at the same level (Eu/Eu* averages 0.10). The average U content increases to 1340 ppm, and Th content to 329 ppm. The average Ca content increases to 25.6 ppm. The content of Sr and Ba remains at the same level. The Ti content varies from 4.02 to 19.2 ppm, averaging 11.9 ppm, corresponding to the crystallization temperature of 745 °C.
The third group is the largest, it includes points 3, 4, 5, 7, 11, 12, 14 (Fig.5, d). Compared to the first and second groups, the REE spectra are characterized by an even more flattened distribution pattern (LuN/LaN averages 101). There is a noticeable increase in the total REE content (an average of 1521 ppm) and light REE content (an average of 136 ppm). The heavy REE content also increases compared to the second group (1357 and 923 ppm, respectively). The average U content increases to 1988 ppm, Th to 565 ppm. The average Ca content increases to 57.9 ppm. The average Sr and Ba content increases to an average about 2 ppm. The Ti content varies from 19.2 to 128, with an average of 47.3 ppm. The crystallization temperature using the Ti-in-zircon thermometer for two points with the minimum Ti content of about 20 ppm averages 807 °C.
The fourth group includes two points 13 and 15, associated with black areas in CL imaging of zircon. The REE distribution spectra for them fundamentally differ from the spectra for the other three groups by a higher content of all REE (7410 and 25087 ppm) and especially by an increased content of light REE (2335 и 8593 ppm). Notably, other three groups considered have a similar level of heavy REE content, yet differing in light REE content. A Се anomaly in the fourth group is significantly reduced (Ce/Ce* averages 1.18). The value of a negative Eu anomaly corresponds to other groups (Eu/Eu* averages 0.13). The content of a number of trace elements significantly increases – U (4789 and 10264 ppm), Th (1236 and 2000 ppm), and Ca (22974 and 4255 ppm). The Sr content increases to an average of 59.6 ppm, Ba – to 65.9 ppm. The Ti content is anomalously high for zircon (599 and 2002 ppm) and cannot be used to estimate the crystallization temperature. The Nb content increases abnormally, in other three groups the highest average content is 61.8 ppm, in the fourth group the Nb content is 213 and 1060 ppm. For the fourth group, an abnormally high Y content was also determined – 5718 ppm for point 13, 15787 ppm for point 15. In other groups, the average Y content is significantly lower; it is the same in the first and second groups, about 1200 ppm, in the third group it increases to 1914 ppm. The Hf content tends to increase from the first to the fourth group (on average of 13062 and 16843 ppm). In the second and third groups, the Hf content is higher than in the first group. The P content is the lowest in the first and second groups (on average of 198 and 184 ppm), and increases to average 284 ppm in the third group, to average 8977 ppm in the fourth group. The Li content is generally stable for all zircon points (0.72 to 8.16 ppm), with minimum values determined for the first group. The Th/U ratio varies not significantly within the whole population, remaining at the level of 0.2-0.3.
Discussion
The age of granites of the Belokurikhinsky massif
From previously published data on the age of granites of the Belokurikhinsky massif, it is worth noting the results of dating micas using the Ar-Ar method [13]. The age of 250 ± 2.7 Ma was obtained for the biotite, it is not indicated which phase of emplacement this determination relates to. Considering the almost complete absence of biotite in the third phase leucogranites and the rather limited distribution of the first phase granites, it can be assumed that the biotite was sampled from the second phase granites, which make up the majority of the outcrops in the massif. The other two determinations were based on determining of muscovite from stocks of the third phase leucogranites, which are satellites of the Belokurikhinsky massif. The muscovite from pegmatites of the Tochilny stock (Tochilnensky in the author's edition) was dated to 247 ± 3 Ma, while the muscovite from leucogranites of the Osokinsky stock was dated to 250 ± 3.5 Ma. The Ar-Ar age for the mica in granites of the second and third intrusive phases was within the margin of error and was about 250 Ma.
However, the Ar-Ar system for mica is less reliable than the U-Pb system for zircon in terms of reliability in determining the crystallization age of igneous rocks, particularly granitoids [36, 37]. On the one hand, the Ar-Ar system applied to micas has a significantly lower closure temperature (about 500 °C) compared to the closure temperature of the U-Pb system for zircon – the most reliable geochronometer mineral [38]. On the other hand, micas are often subjected to a late- and post-magmatic alteration, resulting in a “lag” of the Ar-Ar age of micas from the U-Pb age of zircon. Previous dating of zircon from porphyritic biotite granites (apparently belonging to the second intrusion phase) was performed on outdated equipment using the “classical" ID-TIMS method, which does not consider the possible heterogeneity of zircon [17]. The zircon age of 232 ± 4.7 Ma was obtained from the upper intersection of the discordia, significantly differing from the Ar-Ar dating results of micas (about 250 Ma [13]) and from the U-Pb age of 255 ± 2 Ma determined by ID-TIMS of titanite from granites of the first intrusion phase [14]. Therefore, the zircon age of about 232 Ma from granites of the Belokurikhinsky massif should be considered unreliable and not supported by modern analytical data.
Table 6 compares our U-Pb dating results (SHRIMP-II method) of zircon from three phases of the Belokurikhinsky massif granites are compared with age determinations obtained by the U-Pb method (ID-TIMS) on titanite from the first intrusion phase [14] and by the Ar-Ar method on muscovite, presumably from the second and third phases of granites [13]. The U-Pb age of the first phase granites was determined to be 255 ± 2 Ma for titanite and 249 ± 3 Ma for zircon. There is reason to assume that the “geological” age of crystallization of the first phase is in the range of 255-250 Ma. The concordant age of zircon from leucogranites of the third phase is formally “older” than the concordant age of zircon from granites of the first and second phases. This discrepancy should not be given fundamental significance, since the zircon from the sample TH3-1, with its trace element composition demonstrating strong fluid influence [15], could have altered the U-Pb isotopic system (e.g., the effect of increasing age with the introduction of uranium, described higher). To estimate the age of the third phase leucogranites, it is proposed to use the concordant age value of 251 ± 2 Ma obtained for zircon from the Tochilny stock leucogranites. In this case, considering the instrumental errors of the age determinations (1.5-2 % for the SIMS method), the age of the second and third phases granites can be considered to be similar, about 250 Ma, which is in full agreement with the age determinations of mica by the Ar-Ar method [13].
Table 6
The results of dating of granites of the Belokurikhinsky massif
|
Granite phase |
U-Pb metod |
Ar-Ar metod [13] |
|
First |
255 ± 2 (Ttn [14])249 ± 3 (Zrn) |
– |
|
Second |
247 ± 2 (Zrn) |
250 ± 3 (Bt) |
|
Third (including leucogranites from stocks) |
251 ± 2 (Zrn)255 ± 4 (Zrn) |
247 ± 3 (Ms)250 ± 4 (Ms) |
An unresolved question is the reason for the occurrence of rims with the age of 117 ± 4 Ma on the zircons from the granites of the first phase. In the Gorny Altai, magmatism of Cretaceous age has not yet been detected. Similarly, aged magmatic formations containing a zircon with a similar age are known in the Tuva, in breccias of the Karasug fluorite-barite-rare earth element deposit [39]. This time range (120 ± 10 Ma) is the most productive for gold mineralization in the northeastern Russia and China [40]. In the Gorny Altai, a zircon population with the age of 126 ± 3 Ma has been determined, among other age generations, in explosive breccias from the Churinsky gold-silver ore occurrence of Devonian age, belonging to the morphological type of mineralized explosion pipes [41]. It can be assumed that the zircon rims with the age of 117 ± 4 Ma also reflect a hydrothermal-metasomatic process of the Cretaceous age; its manifestation in rocks and (or) minerals is either not posed to the surface or has not yet been detected.
The oxygen isotope composition and the temperature of zircon formation
The study of the oxygen isotope composition of magmatic zircon gives an indication of the source of the magma, the conditions of its crystallization, and the continued evolution of the rock [42]. In addition to other advantages that zircon has as a mineral geochronometer, the diffusion rate of oxygen in its crystal lattice is insignificantly low [43], making the oxygen isotope composition of zircon an indicator of crystallization and recrystallization conditions. Previous studies made it possible to determine that zircon preserves its oxygen isotope composition with minor alterations from the parent rock under closed system conditions [42]. However, in a metamict zircon, significant exchange of structural oxygen with oxygen subsequently embedded by intruding melts, fluids and hydrothermal solutions is possible [42, 44, 45]. Therefore, an abrupt change in the oxygen isotope composition of zircon reflects its evolution.
The oxygen isotope composition was analyzed in the altered zircon from the third phase leucogranites (sample TH3-1, mount M-2974) at ten points, where the content of trace and rare earth elements was previously determined [15]. The average δ18O value is 11.55 ‰ with the lowest value of 9.22 ‰ and the highest value of 12.54 ‰, which is almost twice as high as the mantle value (about 5.3 ‰). This value is also higher than the average δ18O value determined for zircons from the Phanerozoic granitoids (in the range of 6-8 ‰) [45]. Such high δ18О values in zircon from the leucogranites of the Belokurikhinsky massif can be explained by their crystallization from melts with a significant contribution of continental crust. It should be noted that the δ18O shift when comparing different zircon grains from the leucogranite is more than 4 ‰, while the δ18O shift within a single grain is slightly more than 2 ‰. This variation in the oxygen isotope composition can be explained by the influence of fluid from an external source [45].
Similar values of δ18O, but less variable, with a shift of no more than 1-2 ‰, were obtained by S.G.Skublov (unpublished data) for zircon from leucogranites of the Tochilny stock (sample 2016-5, with an average δ18O value for 16 points was 11.47 ‰ ranging from the minimum of 10.84 ‰ to the maximum of 12.94 ‰) and zircon from the granites of the second intrusion phase (sample TH1-2, with an average δ18O value for 17 points was 11.96 ‰ ranging from the minimum of 11.55 ‰ to the maximum of 12.55 ‰).
Thus, the δ18О value for zircon from granites of the second and the third intrusion phases averages 11.5-12.0 ‰, indicating a significant contribution of a crustal component during the formation of the parent melts for these phase granites. A high value of the primary Sr isotope ratios in the third phase granites, reaching 0.717, also confirms the contribution of a crustal component. During the crystallization of the third phase granites, the zircon was influenced by fluids from an external source, causing significant variations in δ18O values. Apparently, the effect of the fluid disturbed the isotope equilibrium.
The determination of the crystallization temperature of zircon using the Ti-in-zircon thermometer (considering the possible introduction of Ti under fluid influence) for three phases of intrusion falls within the range of 820-800 °C. In this case, there is a tendency for the temperature to decrease from the first to the third phase (820-810-800 °C). The data on the Zr and Al2O3 content in titanite from the first phase granites of the Belokurikhinsky massif, as given in [14], give a calculated crystallization temperature and pressure for this mineral. The P-T parameters determined by the titanite thermobarometer [46] average about 770 °C and 2.7 kbar.
The trace element composition of zircons
Recently, discriminant diagrams based on zircon rare earth element composition data have been widely used to reconstruct the conditions of zircon formation and host rocks [28, 33, 47]. The La – SmN/LaN diagram (an indicator of light REE fractionation degree) allows magmatic zircon to be distinguished from hydrothermal-metasomatic zircon. The research carried out has shown that the diagram of a hydrothermal-metasomatic zircon includes an altered magmatic zircon that has underwent intense fluid impact during the late- or post-magmatic stage [15]. The discriminant diagram includes a field for “porous” zircon, also affected by fluids and exhibiting characteristic porous internal features [33].
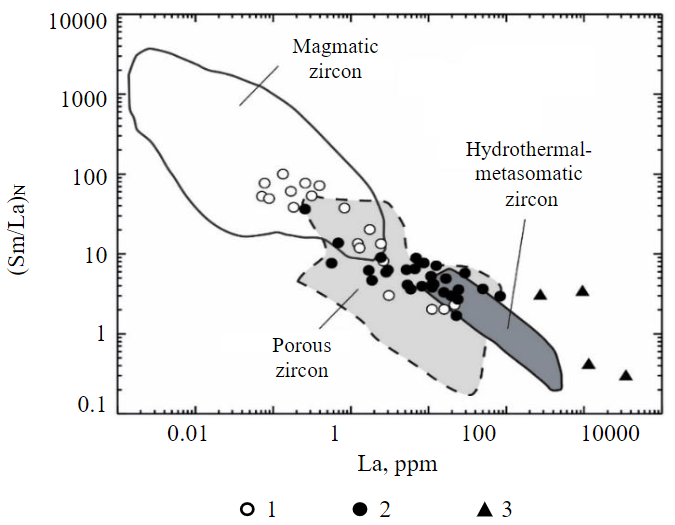
Fig.6. The discrimination diagram for determining zircon genesis. The composition fields are given according to [28, 33, 47]. The zircons from granites of Belokurikhinsky massif
1 – corresponding unaltered magmatic zircon; 2 – influenced by fluid; 3 – with anomalous geochemical characteristics
On the La – SmN/LaN diagram (Fig.6) of all zircon points from the granites of the Belokurikhinsky massif separated by intrusion phases (except the population of zircon rims of the first phase granites, which have a younger age), a significant similarity of their compositions is noticeable. Each phase of the granites contains a typical igneous zircon and an altered zircon, which has the geochemical characteristics of a hydrothermal-metasomatic zircon, in particular, an increased content of light REE and a flattened spectra pattern in this region. The zircon composition of the granites was classified into four geochemical types: 1) corresponding to unaltered magmatic zircon by the level of impurity elements and REE pattern; 2) demonstrating fluid influence (increased content of incompatible elements, flattened REE pattern in the region of light REE with a reduced Се anomaly); 3) with anomalous geochemical characteristics (anomalously high content of a number of non-formula elements, atypical REE pattern). It was found that the first type zircon falls mainly within the magmatic zircon field and partially within the “porous” zircon field (Fig.6). The second type zircon falls within the “porous” and hydrothermal-metasomatic zircon composition fields. The third type zircon (point 2.2 from the sample TH1-2, point 2 from the sample TH3-1, points 13 and 15 from the sample 2016-5) is located separately, gravitating towards the hydrothermal-metasomatic zircon field.
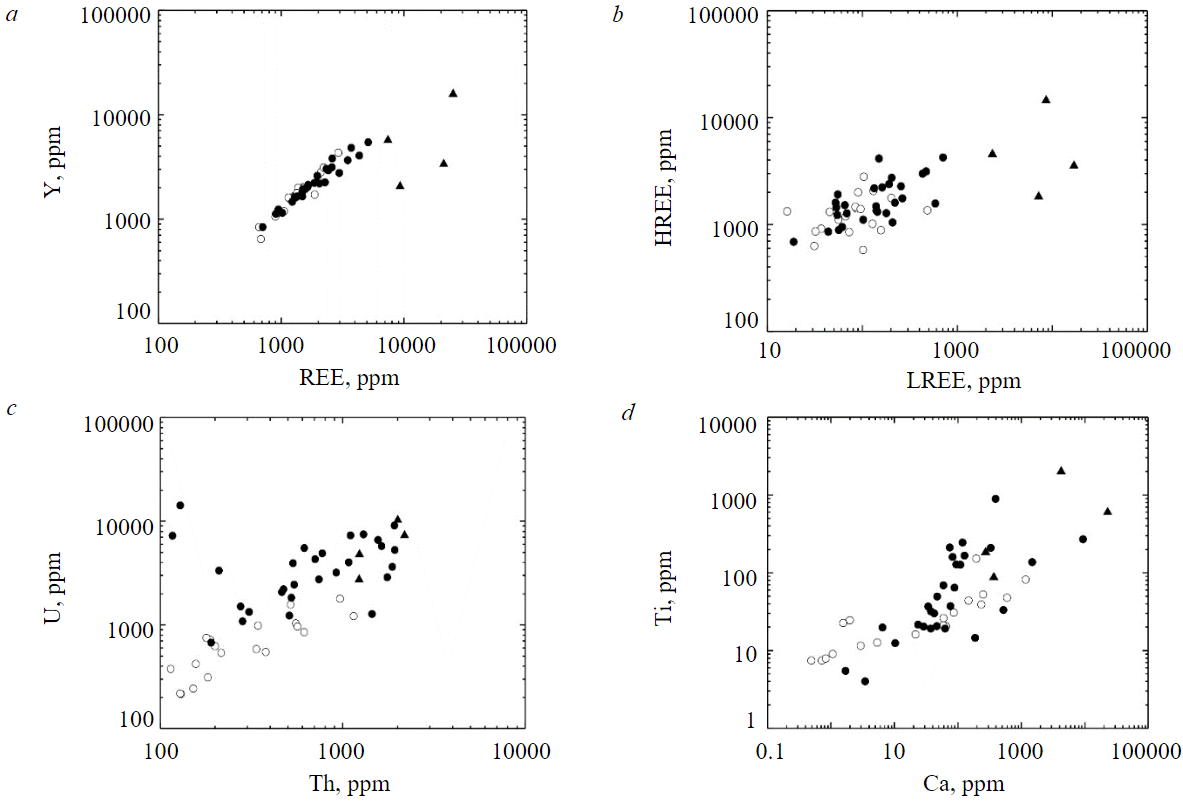
Fig.7. Ratio of elements content in the zircons: REE and Y (a), LREE and HREE (b), Th and U (c), Ca and Ti (d)
On the relationship between the total content of REE and Y plot (Fig.7, a), the zircon of the first and second types consistently form a linear trend with a strong positive correlation, showing a systematic increase in REE and Y content in zircon influenced by fluids. Four zircon points of the third type are located outside this trend. Two points of the third type with anomalously REE spectra with a flat profile (points 13 and 15 from the sample 2016-5) are located on the continuation of the compositional trend of the first and second types. Two other points of third type (point 2.2 of the sample TH1-2, point 2 of the sample TH3-1) with the “bird's wing” REE spectra profile are located outside the trend, showing a predominant accumulation of REE compared to Y.
The diagram of the ratio of light and to heavy REE (Fig.7, b), shows a significant overlap in the composition of the first and second type zircons. The second type zircon is overall more enriched in LREE and HREE than the first type zircon. The third type zircon is characterized by an anomalously high light REE content. The level of heavy REE in it corresponds to the trend of changes in composition for a given level of light REE.
The second and third type zircons differ from the first type zircon in their increased Th and U content (Fig.7, c). The Th/U ratio for the first type zircon is higher, with the points forming a linear trend. The second type zircon demonstrates variable Th content with consistently elevated U content. The third type zircon is characterized by increased Th and U content.
The diagram of the ratio of Са и Ti, the zircon of the first type forms a linear trend with predominant increases in Ti compared to Ca (Fig.7, d). The trend for the second type zircon, on the contrary, demonstrates a sharp increase in Ca (an indicator element of fluid impact [27]) with a more gradual increase in Ti content. The third type zircon has a higher content of these non-formula elements.
Conclusion
As a result of the isotope-geochemical study of zircon from granites of the Belokurikhinsky massif in the Gorny Altai, the age of three intrusion phases has been determined for the first time by the U-Pb method – the age of the first phase belongs to the time interval of 255-250 Ma, the second and third phases have a similar age of about 250 Ma. The duration of formation of the Belokurikhinsky massif can be estimated as not exceeding 5-8 Ma. The δ18О value for zircon from granites of the second and third phases averages 11.5-12.0 ‰, which indicates a significant contribution of the crustal component in the formation of parent melts for granites of these phases. The crystallization temperature of zircon using the Ti-in-zircon thermometer for three intrusion phases is in the range of 820-800 °C. The P-T parameters of titanite crystallization from the first phase, determined by the titanite thermobarometer, average about 770 °C and 2.7 kbar.
The zircon from the first phase predominantly displays geochemical characteristics of a typical magmatic zircon. The zircon from the second and third phases can be both unaltered magmatic and enriched in incompatible elements (LREE, Th, U, Ti, Ca, etc.) as the result of fluid influence, with geochemical characteristics corresponding to zircon of the hydrothermal-metasomatic type. A number of zircon grains from the second and third phases of granites show anomalous geochemical characteristics – atypical REE distribution spectra (including “bird's wing” spectra with oppositely tilted profiles of light and heavy REE distribution), the maximum high content of a number of impurity elements compared to other varieties. Such an enriched zircon composition and wide variations in incompatible element content are probably due to non-equilibrium conditions of zircon crystallization and fluid saturated melt composition evolution during the final stages of massif formation.
References
- Alekseev V.I. Deep structure and geodynamic conditions of granitoid magmatism in the Eastern Russia. Journal of Mining Institute. 2020. Vol. 243, p. 259-265. DOI: 10.31897/PMI.2020.3.259
- Beskin S.M., Marin Yu.B. Granite Systems with Rare-Metal Pegmatites. Geology of Ore Deposits. 2020. Vol. 62. Iss. 7, p. 554-563. DOI: 10.1134/S107570152007003X
- Akbarpuran Haiyati S.A., Gulbin Yu.L., Sirotkin A.N., Gembitskaya I.M. Compositional Evolution of REE- and Ti-Bearing Accessory Minerals in Metamorphic Schists of Atomfjella Series, Western Ny Friesland, Svalbard and Its Petrogenetic Significance. Geology of Ore Deposits. 2021. Vol. 63. Iss. 7, p. 634-653. DOI: 10.1134/S1075701521070047
- Marin Yu.B. On Mineralogical Studies and the Use of Mineralogical Information in Solving Petro- and Ore Genesis Problems. Geology of Ore Deposits. 2021. Vol. 63. Iss. 7, p. 625-633. DOI: 10.1134/S1075701521070059
- Aleksandrova T.N., Talovina I.V., Duryagina A.M. Gold-sulphide deposits of the Russian Arctic zone: Mineralogical features and prospects of ore benefication. Geochemistry. 2020. Vol. 80. Iss. 3. N 125510. DOI: 10.1016/j.chemer.2019.04.006
- Gvozdenko T.A., Baksheev I.A., Khanin D.A. et al. Iron-bearing to iron-rich tourmalines from granitic pegmatites of the Murzinka pluton, Central Urals, Russia. Mineralogical Magazine. 2022. Vol. 86. Iss. 6, p. 948-965. DOI: 10.1180/mgm.2022.104
- Alekseev V.I., Alekseev I.V. Zircon as a Mineral Indicating the Stage of Granitoid Magmatism at Northern Chukotka, Russia. Geosciences. 2020. Vol. 10. Iss. 5. N 194. DOI: 10.3390/geosciences10050194
- Machevariani M.M., Alekseenko A.V., Bech J. Complex Characteristic of Zircon from Granitoids of the Verkhneurmiysky Massif (Amur Region). Minerals. 2021. Vol. 11. Iss. 1. N 86. DOI: 10.3390/min11010086
- Kudryashov N.M., Udoratina O.V., Kalinin A.A. et al. U-Pb (SHRIMP-RG) age of zircon from rare-metal (Li, Cs) pegmatites of the Okhmylk deposit of the Kolmozero-Voron’ya greenstone belt (northeast of the Fennoscandian shield). Journal of Mining Institute. 2022. Vol. 255, p. 448-454. DOI: 10.31897/PMI.2022.41
- Levashova E.V., Popov V.A., Levashov D.S., Rumyantseva N.A. Distribution of trace elements controlled by sector and growth zonings in zircon from a miaskite pegmatite of the Vishnegorsky massif, the Southern Urals. Journal of Mining Institute. 2022. Vol. 254, p. 136-148. DOI: 10.31897/PMI.2022.29
- Murzintsev N.G., Annikova I.Yu., Travin A.V. et al. Thermochronology and mathematical modeling of the formation dynamics of rare‐metal‐granite deposits of the Altai collision system. Geodynamics & Tectonophysics. 2019. Vol. 10. N 2, p. 375-404 (in Russian). DOI: 10.5800/GT‐2019‐10‐2‐0419
- Gavryushkina O.A. Petrogenesis of the Permo-Triassic granitoids of the Altai: Avtoref. dis. … kand. geol.-mineral. nauk. Novosibirsk: IGM SO RAN, 2021, p. 17 (in Russian).
- Gavryushkina O.A., Travin A.V., Kruk N.N. Duration of granitoid magmatism in peripher-parts of large igneous provinces (based on 40Ar/39Ar isotopic studies of Altai Permian‐Triassic granitoids). Geodynamics & Tectonophysics. 2017. Vol. 8. N 4, p. 1035-1047. DOI: 10.5800/GT‐8‐4‐0331 14.
- Skublov S.G., Mamykina M.E., Rizvanova N.G. U-Pb age and trace elements composition of titanite from granites of Belokurikhinsky massif, Gorny Altai. Vestnik of MSTU. 2021. Vol. 24. N 2, p. 168-177 (in Russian). DOI: 10.21443/1560-9278-2021-24-2-168-177
- Levashova E.V., Mamykina М.Е., Skublov S.G. et al. Geochemistry (TE, REE, Oxygen) of Zircon from Leucogranites of the Belokurikhinsky Massif, Gorny Altai, as Indicator of Formation Conditions. Geochemistry International. 2023. Vol. 61. Iss. 13, p. 1323-1339. DOI: 10.1134/S001670292311006X
- Leontev A.N. Formation of Late Hercynian rare-metal granites and the rare-metal belts of the Irtysh Region. Moscow: Nedra, 1969, p. 164 (in Russian).
- Vladimirov A.G., Shokalskii S.P., Ponomareva A.P. On the riftogenic-shift nature of Late Palaeozoic-Early Mesozoic granitoids of the Altai. Doklady Akademii nauk. 1996. Vol. 350. N 1, p. 83-86 (in Russian).
- Vladimirov А.G., Ponomareva А.Р., Shokalskii S.Р. Late Paleozoic – Early Mesozoic granitoid magmatism in Altai. Russian Geology and Geophysics. 1997. Vol. 38. N 4, p. 715-729 (in Russian).
- Gusev A.I., Gusev N.I., Tabakaeva E.M. Petrology and ore mineralization of Belokurihinskii komplex of Gornyi Altai. Biisk: BPGU im. V.M.Shukshina, 2008, p. 193 (in Russian).
- Williams I.S. Chapter 1 – U-Th-Pb Geochronology by Ion Microprobe. Reviews in Economic Geology. Society of Economic Geologists. 1998. Vol. 7, p. 1-35. DOI: 10.5382/Rev.07
- McDonough W.F., Sun S.-s. The composition of the Earth. Chemical Geology. 1995. Vol. 120. Iss. 3-4, p. 223-253.DOI: 10.1016/0009-2541(94)00140-4
- Watson E.B., Wark D.A., Thomas J.B. Crystallization thermometers for zircon and rutile. Contributions to Mineralogy and Petrology. 2006. Vol. 151. Iss. 4, p. 413-433. DOI: 10.1007/s00410-006-0068-5
- Hoskin P.W.O., Schaltegger U. The Composition of Zircon and Igneous and Metamorphic Petrogenesis. Reviews in Mineralogy and Geochemistry. 2003. Vol. 53. N 1, p. 27-62. DOI: 10.2113/0530027
- Kirkland C.L., Smithies R.H., Taylor R.J.M. et al. Zircon Th/U ratios in magmatic environs. Lithos. 2015. Vol. 212-215, p. 397-414. DOI: 10.1016/j.lithos.2014.11.021
- Wang X., Griffin W.L., Chen J. Hf contents and Zr/Hf ratios in granitic zircons. Geochemical Journal. 2010. Vol. 44. Iss. 1, p. 65-72. DOI: 10.2343/geochemj.1.0043
- Fu B., Page F.Z., Cavosie A.J. et al. Ti-in-zircon thermometry: applications and limitations. Contributions to Mineralogy and Petrology. 2008. Vol. 156. Iss. 2, p. 197-215. DOI: 10.1007/s00410-008-0281-5
- Geisler T., Schleicher H. Improved U–Th–total Pb dating of zircons by electron microprobe using a simple new background modeling procedure and Ca as a chemical criterion of fluid-induced U-Th-Pb discordance in zircon. Chemical Geology. 2000. Vol. 163. Iss. 1-4, p. 269-285. DOI: 10.1016/S0009-2541(99)00099-6
- Hoskin P.W.O. Trace-element composition of hydrothermal zircon and the alteration of Hadean zircon from the Jack Hills, Australia. Geochimica et Cosmochimica Acta. 2005. Vol. 69. Iss. 3, p. 637-648. DOI: 10.1016/J.GCA.2004.07.006
- Williams I.S., Hergt J.M. U-Pb dating of Tasmanian dolerites: a cautionary tale of SHRIMP analysis of high-U zircon. Beyond 2000: New Frontiers in Isotope Geoscience, 30 January – 4 February 2000, Lorne, Australia. 2000, p. 185-188.
- White L.T., Ireland T.R. High-uranium matrix effect in zircon and its implications for SHRIMP U–Pb age determinations. Chemical Geology. 2012. Vol. 306-307, p. 78-91. DOI: 10.1016/j.chemgeo.2012.02.025
- Xian Hua Li, Xiao Ming Liu, Yong Sheng Liu et al. Accuracy of LA-ICPMS zircon U-Pb age determination: An inter-laboratory comparison. Science China Earth Sciences. 2015. Vol. 58. Iss. 10, p 1722-1730. DOI: 10.1007/s11430-015-5110-x
- Zhao K.D., Jiang S.-Y., Ling H.-F., Palmer M.R. Reliability of LA-ICP-MS U-Pb dating of zircons with high U concentrations: A case study from the U-bearing Douzhashan Granite in South China. Chemical Geology. 2014. Vol. 389, p. 110-121. DOI: 10.1016/j.chemgeo.2014.09.018
- Bouvier A.-S., Ushikubo T., Kita N.T. et al. Li isotopes and trace elements as a petrogenetic tracer in zircon: insights from Archean TTGs and sanukitoids. Contributions to Mineralogy and Petrology. 2012. Vol. 163. Iss. 5, p. 745-768. DOI: 10.1007/s00410-011-0697-1
- Finch R.J., Hanchar J.M. Structure and Chemistry of Zircon and Zircon-Group Minerals. Reviews in Mineralogy and Geochemistry. 2003. Vol. 53. N 1, p. 1-25. DOI: 10.2113/0530001
- De Hoog J.C.M., Lissenberg C.J., Brooker R.A. et al. Hydrogen incorporation and charge balance in natural zircon. Geochimica et Cosmochimica Acta. 2014. Vol. 141, p. 472-486. DOI: 10.1016/j.gca.2014.06.033
- Dopico C.I.M., Tohver E., López de Luchi M.G. et al. Jurassic cooling ages in Paleozoic to early Mesozoic granitoids of northeastern Patagonia: 40Ar/39Ar, 40K–40Ar mica and U–Pb zircon evidence. International Journal of Earth Sciences. 2017. Vol. 106. Iss. 7, p. 2343-2357. DOI: 10.1007/s00531-016-1430-0
- Tichomirowa M., Käßner A., Sperner B. et al. Dating multiply overprinted granites: The effect of protracted magmatism and fluid flow on dating systems (zircon U-Pb: SHRIMP/SIMS, LA-ICP-MS, CA-ID-TIMS; and Rb-Sr, Ar-Ar) – Granites from the Western Erzgebirge (Bohemian Massif, Germany). Chemical Geology. 2019. Vol. 519, p. 11-38. DOI: 10.1016/j.chemgeo.2019.04.024
- Villa I.M. Isotopic closure. Terra Nova. 1998. Vol. 10. N 1, p. 42-47. DOI: 10.1046/j.1365-3121.1998.00156.x
- Bolonin A.V., Nikiforov A.V., Lykhin D.A., Sugorakova A.M. The Chailag-Khem fluorite-barium-strontium rare earth carbonatite occurrence, the Western Sayan Range, Russia. Geology of Ore Deposits. 2009. Vol. 51. N 1, p. 17-32. DOI: 10.1134/S1075701509010024
- Pirajno F., Ernst R.E., Borisenko A.S. et al. Intraplate magmatism in Central Asia and China and associated metallogeny. Ore Geology Reviews. 2009. Vol. 35. Iss. 2, p. 114-136. DOI: 10.1016/j.oregeorev.2008.10.003
- Gusev N.I., Gusev A.I., Shokalskii S.P. et al. Mezozoic tectonothermal activation and epithermal gold mineralization in the North-Eastеrn Gornyi Altai. Regionalnaya geologiya i metallogeniya. 2014. N 57, p. 49-62 (in Russian).
- Valley J.W. Oxygen Isotopes in Zircon. Reviews in Mineralogy and Geochemistry. 2003. Vol. 53. N 1, p. 343-385. DOI: 10.2113/0530343
- Watson E.B., Cherniak D.J. Oxygen diffusion in zircon. Earth and Planetary Science Letters. 1997. Vol. 148. Iss. 3-4, p. 527-544. DOI: 10.1016/S0012-821X(97)00057-5
- Peck W.H., Valley J.W., Wilde S.A. et al. Oxygen isotope ratios and rare earth elements in 3.3 to 4.4 Ga zircons: Ion microprobe evidence for high δ18O continental crust and oceans in the Early Archean. Geochimica et Cosmochimica Acta. 2001. Vol. 65. Iss. 22, p. 4215-4229. DOI: 10.1016/S0016-7037(01)00711-6
- Valley J.W., Lackey J.S., Cavosie A.J. et al. 4.4 billion years of crustal maturation: oxygen isotope ratios of magmatic zircon. Contributions to Mineralogy and Petrology. 2005. Vol. 150. Iss. 6, p. 561-580. DOI: 10.1007/s00410-005-0025-8
- Hayden L.A., Watson E.B., Wark D.A. A thermobarometer for sphene (titanite). Contributions to Mineralogy and Petrology. 2008. Vol. 155. Iss. 4, p. 529-540. DOI: 10.1007/s00410-007-0256-y
- Grimes C.B., John B.E., Cheadle M.J. et al. On the occurrence, trace element geochemistry, and crystallization history of zircon from in situ ocean lithosphere. Contributions to Mineralogy and Petrology. 2009. Vol. 158. Iss. 6, p. 757-783. DOI: 10.1007/s00410-009-0409-2