Alluvial tin mining by spray-suction borehole method: a case study on remaining alluvial tin reserves in Bangka Belitung, Indonesia
- 1 — Postgraduate Student Bandung Institute of Tecnology ▪ Orcid
- 2 — Ph.D., Dr.Sci. Lecturer Bandung Institute of Tecnology ▪ Orcid
- 3 — Ph.D., Dr.Sci. Lecturer Bandung Institute of Tecnology ▪ Orcid
- 4 — Ph.D., Dr.Sci. Lecturer Bandung Institute of Tecnology ▪ Orcid

Abstract
The area of the Bangka Belitung Islands, which is a potential area for alluvial tin deposits in Indonesia, has been affected by the destruction of tin reserves on the mainland due to rampant artisanal mining, which has left remnants of small-dimensional reserves. The remnants of these reserves can no longer be mined using the hydraulic mining of open pit method due to the small dimensions of the deposits. The hypothesis is that such sedimentary conditions can only be mined by the borehole method. This research aimed to design tools and perform test mining using the borehole method with a spray-suction mechanism. This research produced a novelty, namely, a method and parameters for alluvial tin deposits mining using borehole mining methods, such as the excavation capacity, excavation radius, mining recovery, and dilution factor. The benefit of this research is expected to provide an opportunity to increase the amount of onshore alluvial tin reserves to support tin production.
The authors would like to especially thank PT. Timah Tbk, including the Director, Alwin Albar, who provided access to facilities, Head of Exploration, Satyogroho, engineering staff, Sasri Romi, and all parties who helped and supported during this research. We hope that this research can be useful for mining science and technology, especially in alluvial tin mining.
Introduction
Since 2000, artisanal alluvial tin mining has been widespread in the area of Bangka Belitung, Indonesia. The artisanal alluvial tin mining carried out by the local community is done in an unsystematic manner; as a result, the tin reserves which originally was developed by high continuity deposits is now changed to be spotted ones. These forms of spotted deposits are not formed geologically [1] but are the result of the impact of unsystematic artisanal mining [2]. These forms of spotted deposits cannot be classified as a reserve anymore [3-5] as there is currently no available mining method for the deposits [6-9].
Based on the evaluation of the physical conditions that occurred in mining area, artisanal mines still leave many unmined area as spotted reserves.
A typical cross-section shows the condition of the tin deposit mined by artisanal mining. The section shows the remaining reserves that have not been mined by artisanal. The remnants of these reserves are visible in spotted forms. Remaining reserves such as this, based on validation, can possibly be reclassified as resources.
The principle of open pit hydraulic alluvial tin mining is to spray the tin layer to disperse the material to form a slurry, which is then flowed into the suction hole for suction and subsequent pumping of the material to the tin ore concentration device. The spray-suction process is very important to optimizing material excavation in open pit hydraulic mining [10, 11].
The hypothesis is that such sedimentary conditions can only be mined by the borehole method. The aim of this research is to design tools and perform mining tests using the borehole method with a spray-suction mechanism. The former artisanal mining holes that have been filled with water can be used as a water source for mining. The results of this research are the excavation parameters using the borehole mining method, such as the digging capacity, excavation radius, mining recovery, and dilution factor. The benefit of this research is expected to provide an opportunity to increase the amount of onshore alluvial tin reserves to support tin production.
The location where the spray-suction mechanism borehole mining test was carried out was in S.Sekah, Belinyu, Bangka Regency, Bangka Belitung Islands Province, Indonesia at the coordinates of UTM X: 596,967; Y: 9,830,627. This location is representative of the remaining tin reserves in the region.
Methods
Designing the lifting capacity of the slurry
The parameters that influence the design of the lifting speed include the specific gravity of the materials transported, the density of the fluid, and the diameter of the grains. The designed lift speed is calculated using the Stokes equation for spherical materials [12-14]:
where ρ1 – cassiterite mineral density, ρ1 = 7 g/cm3; ρ2 – density of fluid (water), ρ2 = 1 g/cm3; μ – fluid viscosity (water), m = 0.00899 Pa∙s = 0.000899 mPa∙s; d – grain diameter, d = 20" = 0.841 mm.
By using this equation, the resulting lifting speed is 2.6 m/s, which is rounded up to 3 m/s.
Determination of suction pipe diameter
The slurry is lifted through the suction pipe. The diameter of the suction pipe used will determine the amount of discharge or the volume of slurry produced. The diameter of the suction pipe used in principle is the one with the highest productivity. The productivity of the suction pipe handling will depend on the equipment load and the power required for the resulting productivity. The larger the pipe diameter, the greater the production, but the larger the pump and its supporting accessories, so the load will be heavier. Empirically, the most efficient handling productivity is when using a 4-inch diameter pipe.
Slurry volume
The results of the calculation of the lifting speed and the determination of the diameter of the suction pipe used above can determine the discharge or volume of the slurry [15, 16]. The determination of the slurry discharge can be calculated using equation:
where A – cross-sectional area, m2.
With a speed V of 3 m/s and a suction pipe diameter of 4 inches, the resulting slurry discharge is 0.02431 m3/s or 87.51 m3/h.
Spray pressure and spray nozzle diameter
Spray pressure is used to spread the tin ore layer, which is generally composed of coarse sand and forms a slurry. The volume of slurry formed must be adequate for the volume or discharge of the slurry to be lifted. The spray pressure will also determine how many spray nozzles will be used [17-19]. The spray pressure is determined using:
where c – nozzle discharge coefficient, c = 0.96; α – nozzle cross-sectional area, m2; η – water pressure coming out of the nozzle (atmosphere).
The pressure needed to form a layer of coarse sand into a slurry is 3.5 atmospheres (atm). This quantity, if using equation (3), can be determined the velocity of the water produced in spraying the material that a water pressure of 3.5 atm will produce a spray speed of 25 m/s. Furthermore, by using a pressure of 3.5 atm, the relationship between the nozzle diameter and the resulting discharge can also be simulated.
The volume of water generated from the spray pressure must be sufficient for the amount of slurry to be removed. From the above calculation, it is known that the volume of the slurry lifted is 87.51 m3/h. The volume of water that approximates this amount is 81.64 m3/h using a nozzle diameter of 34 mm. The slurry produced consists of solid material and water in a ratio of 1:8 to 1:10; with the amount of water sprayed at 81.64 m3/h, solids of 8.16 up to 10.20 m3/h will be produced, so the total volume of slurry produced is 89.80 to 91.40 m3/h. This amount is greater than the volume of the slurry to be lifted, which is 87.51 m3/h, so it is sufficient. If spraying uses two nozzles, the diameter of each nozzle should be 17 mm.
Borehole mining (BHM) equipment design
Principally, the design for tin ore excavation using borehole tools is based on the spraying and suction mechanism. The spray and suction pipes are set as 6 inches and 4 inches respectively. The suction pipe is installed inside the spray pipe so that the space or cavity where the spray flows is between the 6-inch pipe and the 4-inch pipe. The tip of the drill is fitted with two spray holes, one on the side and the other at the bottom. The diameter of each side nozzle is 17 mm.
Two pumps are used, for spraying and suction. In principle, the spray pump and the suction pump must have balanced capacity. The pressure of the spray pump for dispersing the material must be sufficient to disperse the tin ore layer.
The suction pump is designed to lift slurries with a solid/water volume ratio of 1:8 to 1:10. The depth of excavation in accordance with the test location above was designed at a depth of 16 m. The pipe height above the ground was designed to be 5 m high so that the design height was 21 m. The suction pipe was designed in a vertical condition so that it is assumed that there is no friction loss due to the slope of the pipe (Hf = 0). The lifting capacity for cassiterite (tin) mineral with a size of 20-inches is 3 m/s, resulting in a head loss velocity of 0.46 m. The total design height and head loss is therefore 21.46 m. Other head loss due to hose bends, connecting
pipe, engine, etc., was estimated at 5 % of this amount, so the Hl is 1.07 m [20-24]. Overall, the head total [25-28] is
where Z2 – total design height, m; Hf – friction head, m; Hv – head loss velocity, m; Hl – other head loss, m.
Thus, the head total Ht used in the design of the tin material transportation in this test is 22.53 m.
The pump power capacity required for slurry material lifting with a head total of 22.53 m was calculated using the formula for determining the pump power as follows [29-33]:
where γ – density of slurry, kg/dm3; η – pump efficiency, %.
The cross-sectional area of the suction pipe with a diameter of 4 inches is 0.0081 m2; thus, with a slurry transport speed of 3 m/s, the resulting discharge Q is 0.0243 m3/s or 1.459 m3/min. The density of the tin layer is assumed to be 2.65 kg/dm3 and the density of water is 1 kg/dm3, so with a ratio of solid volume to water of 1:10, the density of slurry γ is 1.1 kg/dm3. When doing pump work, it is estimated that it will not work at its maximum capacity, so the pump yield value η was assessed at 75 %. Under these conditions, the pump power P required to lift the material with a total head Ht of 22.53 m is 11 kg m/s . In this study, the test uses power sourced from a mechanical engine.
Fig.1. Drill hole position test 1 – clay sand-fine, sand-coarse; 2 – stiff clay; 3 – sand-coarse, sand-fine
Test
A cross-sectional description of the position of the borehole for testing can be seen in Fig.1. Excavation at this position would be carried out at a depth of 11-16 m or a thickness of 5 m. The tin (Sn) content in each layer is at levels of 0.0211 kg/m3 to 0.1734 kg/m3. The overall tin content (grade) at a thickness of 5 m (11-16 m) is 0.0931 kg/m3.
The spray distance measurement in this study was carried out by installing three observation points. These points were constructed by installing monitoring pipes measuring 4 inches in diameter with distances of 1, 2, and 2.5 m. The monitoring pipes were filled with sand material with a size of 48-100 mesh which had been painted with a certain amount of color and heavy material (nuts) to also test the pump’s ability to transport heavy materials. Yellow sand was inserted into the monitoring pipe at a distance of 1 m, green sand into the monitoring pipe at a distance of 2 m, and blue sand into the monitoring pipe at a distance of 2.5 m. The heavy material used here was stainless-steel nuts, each with a size of 28 mm and a thickness of 13 mm, weighing 41.7 g, the specific gravity of this nut is 7.1 g/cm3. Nuts were inserted into the monitoring pipes at three points each. The nuts inserted into each pipe were distinguished by their color (white nuts were inserted into the monitoring pipe at a distance of 1 m, red nuts into the monitoring pipe at a distance of 2 m, and brown nuts into the monitoring pipe at a distance of 2.5 m).
The sand that has been painted and the nuts will then be observed when the excavation process is carried out for the removal of the material which indicates the range of spray in excavating the ground.
The monitoring pipe was installed by forming an angle of 45° from the end/bit of the borehole mining pipe at the lowest position (depth of 16 m). With this installation, it is expected that if the painted sand/nut material has formed a slurry, it will fall directly towards the end of the suction pipe, so it is expected that it will be immediately lifted. The painted sand and the nuts were then observed when the excavation process was carried out for the removal of the material, to indicate the range of spray in excavating the ground.
After the test hole was prepared, the borehole mining tool was installed and the pipe was inserted into the hole. The excavation was carried out from layer 1 to layer 5. The material that was excavated and suctioned then flowed to the surface to be accommodated in a prepared jumbo bag.
Result discussion
Ground excavation using borehole mining gave the following results:
Ground removal
Table 1 shows that the total excavation produced 58 jumbo bags with a total volume of 42.282 m3. The solid material that was accommodated in the jumbo bags was sand material in a loose condition, so to measure ground displacement, it was necessary to convert the material to bank conditions [34, 35]. In tin mining, to apply the correction factor for loose sand material to bank conditions, the correction is made by dividing the volume of loose sand material by 0.9. The conversion of loose volume to bank conditions can be seen in Table 1. Furthermore, by dividing the volume of sand material in bank conditions by elapsed time, the ground transfer rate can be found.
Table 1
Ground removal rate
|
Layers |
Charging time |
Duration, |
Number |
Volume (loose), |
Factor |
Volume (bank), m3 |
Ground transfer rate, m3/h |
|||
|
empty |
full |
|||||||||
|
1 |
10:43 |
10:54 |
12 |
4 |
2.916 |
0.9 |
3.240 |
16 |
||
|
2 |
10:54 |
11.06 |
12 |
4 |
2.916 |
0.9 |
3.240 |
16 |
||
|
11:06 |
11:18 |
12 |
4 |
2.916 |
0.9 |
3.240 |
16 |
|||
|
3 |
11:18 |
11:39 |
21 |
4 |
2.916 |
0.9 |
3.240 |
9 |
||
|
11:39 |
11:57 |
18 |
4 |
2.916 |
0.9 |
3.240 |
11 |
|||
|
11:57 |
12:19 |
22 |
4 |
2.916 |
0.9 |
3.240 |
9 |
|||
|
12:19 |
12:37 |
18 |
4 |
2.916 |
0.9 |
3.240 |
11 |
|||
|
12:37 |
14:17 |
12 |
4 |
2.916 |
0.9 |
3.240 |
16 |
|||
|
14:17 |
14:35 |
18 |
4 |
2.916 |
0.9 |
3.240 |
11 |
|||
|
14:35 |
15:02 |
27 |
4 |
2.916 |
0.9 |
3.240 |
7 |
|||
|
4 |
15:02 |
16:31 |
26 |
4 |
2.916 |
0.9 |
3.240 |
7 |
||
|
16:31 |
16:51 |
20 |
4 |
2.916 |
0.9 |
3.240 |
10 |
|||
|
16:51 |
11:02 |
11 |
4 |
2.916 |
0.9 |
3.240 |
18 |
|||
|
5 |
11:41 |
12:00 |
19 |
4 |
2.916 |
0.9 |
3.240 |
10 |
||
|
12:00 |
12:20 |
20 |
2 |
1.458 |
0.9 |
1.620 |
5 |
|||
|
|
Total |
268 |
58 |
42.282 |
0.9 |
46.980 |
11 |
|||
The total amount of soil material (sand) produced by the bank was 46.980 m3. Ground removal rates were in the range of 7 to 18 m3/h with an average of 11 m3/h.
Spray range
The spray range was measured using a monitoring pipe inserted into painted sand material and nuts. The results of direct observation in the field regarding the nuts showed red nut. Observations of the painted sand material were carried out using shaking. The sand material that could be found was painted yellow and green. This measurement proves that the spray digging range is up to 2 m.
Dilution
During the process of excavating the ground, there was ground surface collapse around the borehole mining pipe. The dimensions of the cavity or hole shape were assumed to be cone-shaped. This surface collapse indicates the occurrence of collapse under the ground from the undeveloped layer (above it) that enters the excavated area (dilution). Dilution measurements can be seen in Table 2, which shows that when the ground excavation operation was carried out until no further tin layer material was removed, there was a collapse on the surface of 12.64 m2 in a relatively circular shape with a diameter of 4.01 m. The depth of the collapse that occurred was 1.55 m. The collapse was relatively conical with a volume of 6.55 m3.
Tin content from excavation
The tin ore layer material that was excavated and accommodated in jumbo bags was then sampled for laboratory examination to determine its content. The Sn content in the tin ore layer appears to be in the range 0.0290-0.1529 kg/m3 with a total composite layer content of 0.1096 kg/m3 (Table 3).
Comparison of actual excavation and drill data
A comparison between the content of tin (Sn) in the tin ore layer was also made between the drill data and the borehole mining excavation results. The grade obtained from the excavation test results at a depth of 11-16 m (5 m thick) is 0.1096 kg/m3. The comparison results for the Sn content in the tin ore layer can be seen in Table 4. There are significant differences in layers 4 and 5, but overall, the difference in grade is not significant.
Table 2
Dilution measurement results
|
Day |
Time, s |
Accumulation time, s |
Hole diameter, m |
Accumulation area, m2 |
Collapse depth, m |
Accumulation volume, m3 |
Collapse rate, m3/h |
Stage |
|
|
Start |
End |
||||||||
|
1 |
10:59:18 |
11:16:53 |
1055 |
– |
– |
– |
– |
– |
Operation |
|
11:16:53 |
12:00:52 |
2639 |
– |
– |
– |
– |
– |
–"– |
|
|
12:00:52 |
12:15:01 |
3488 |
1.60 |
2.01 |
0.50 |
0.33 |
0.35 |
–"– |
|
|
12:15:01 |
12:26:19 |
4166 |
1.90 |
2.83 |
1.05 |
0.99 |
0.86 |
–"– |
|
|
12:26:19 |
13:53:45 |
9412 |
1.95 |
2.98 |
1.31 |
1.30 |
0.50 |
–"– |
|
|
13:53:45 |
14:11:12 |
10,459 |
2.02 |
3.20 |
1.49 |
1.59 |
0.55 |
–"– |
|
|
14:11:12 |
14:56:43 |
13,190 |
2.50 |
4.91 |
2.00 |
3.27 |
0.89 |
–"– |
|
|
14:56:43 |
15:44:45 |
16,072 |
3.01 |
7.10 |
2.04 |
4.83 |
1.08 |
–"– |
|
|
15:44:45 |
15:53:53 |
16,620 |
4.01 |
12.64 |
1.55 |
6.55 |
1.42 |
–"– |
|
|
2 |
12:19:55 |
15:00:35 |
72,823 |
4.50 |
15.90 |
2.37 |
12.55 |
0.62 |
Post operation |
Table 3
Measurement of Sn content in the tin ore layer
|
Layer’s |
Gross weight, kg |
Dry weight, |
Grade, % Sn |
Sn, kg |
Volume (bank), m3 |
Grade, |
||
|
1 |
3630 |
3260 |
0.015 |
0.495 |
0.495 |
3.240 |
0.1529 |
|
|
2 |
3102 |
2785 |
0.018 |
0.503 |
0.945 |
6.480 |
0.1458 |
|
|
2723 |
2444 |
0.018 |
0.442 |
|||||
|
3 |
3078 |
2763 |
0.011 |
0.314 |
2.259 |
22.680 |
0.0996 |
|
|
3692 |
3316 |
0.011 |
0.377 |
|||||
|
3152 |
2830 |
0.011 |
0.322 |
|||||
|
2978 |
2673 |
0.011 |
0.304 |
|||||
|
3026 |
2716 |
0.011 |
0.309 |
|||||
|
3382 |
3037 |
0.011 |
0.345 |
|||||
|
2835 |
2546 |
0.011 |
0.289 |
|||||
|
4 |
3307 |
2969 |
0.013 |
0.401 |
1.309 |
9.720 |
0.1347 |
|
|
3579 |
3214 |
0.013 |
0.434 |
|||||
|
3920 |
3521 |
0.013 |
0.475 |
|||||
|
5 |
4509 |
4049 |
0.003 |
0.105 |
0.141 |
4.860 |
0.0290 |
|
|
1535 |
1378 |
0.003 |
0.036 |
|||||
|
Total |
48,448 |
43,499 |
0.012 |
5.149 |
5.149 |
46.980 |
0.1096 |
|
Comparison of tin content (Sn) in the tin ore layers
Table 4
|
Layer’s |
Drill data, |
Borehole mining excavation, test, |
Ratio |
|
1 |
0.1734 |
0.1529 |
0.88 |
|
2 |
0.1319 |
0.1458 |
1.11 |
|
3 |
0.1071 |
0.0996 |
0.93 |
|
4 |
0.0319 |
0.1347 |
4.22 |
|
5 |
0.0211 |
0.0290 |
1.37 |
|
1-5 |
0.0931 |
0.1096 |
1.18 |
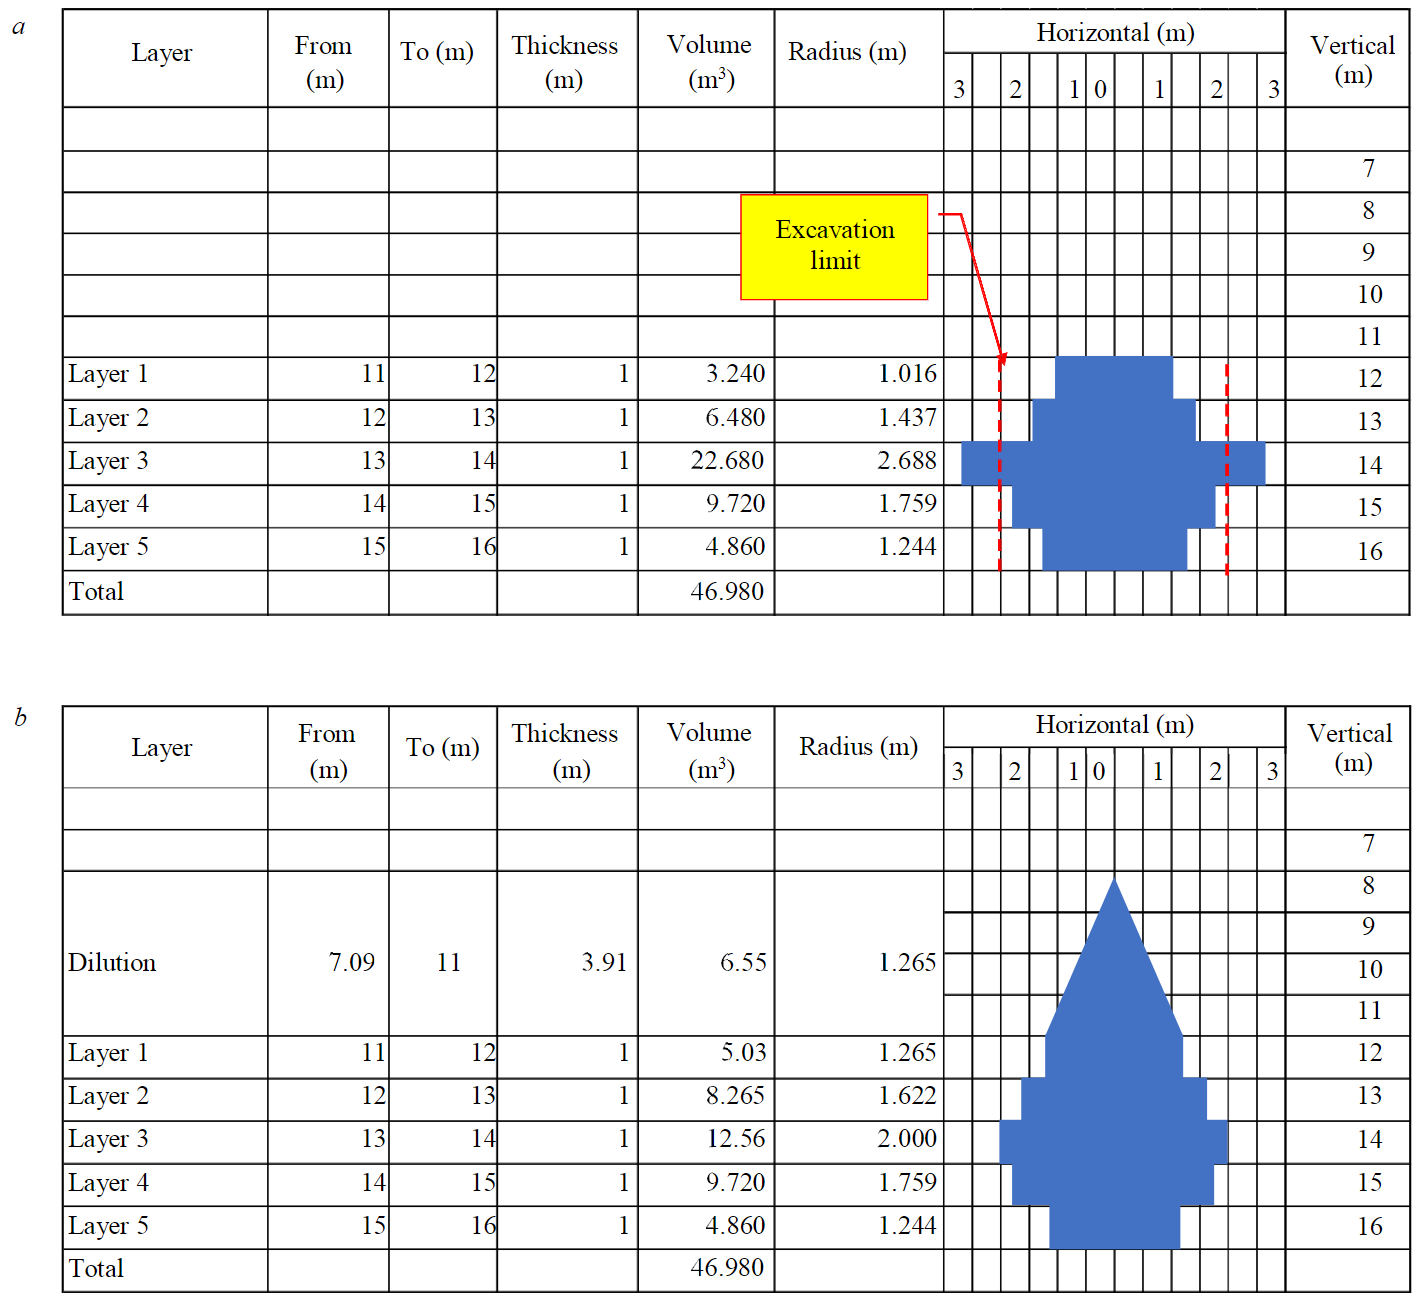
Fig.2. Graphical image of the borehole mining excavation cross section: a – before correction; b – after correction
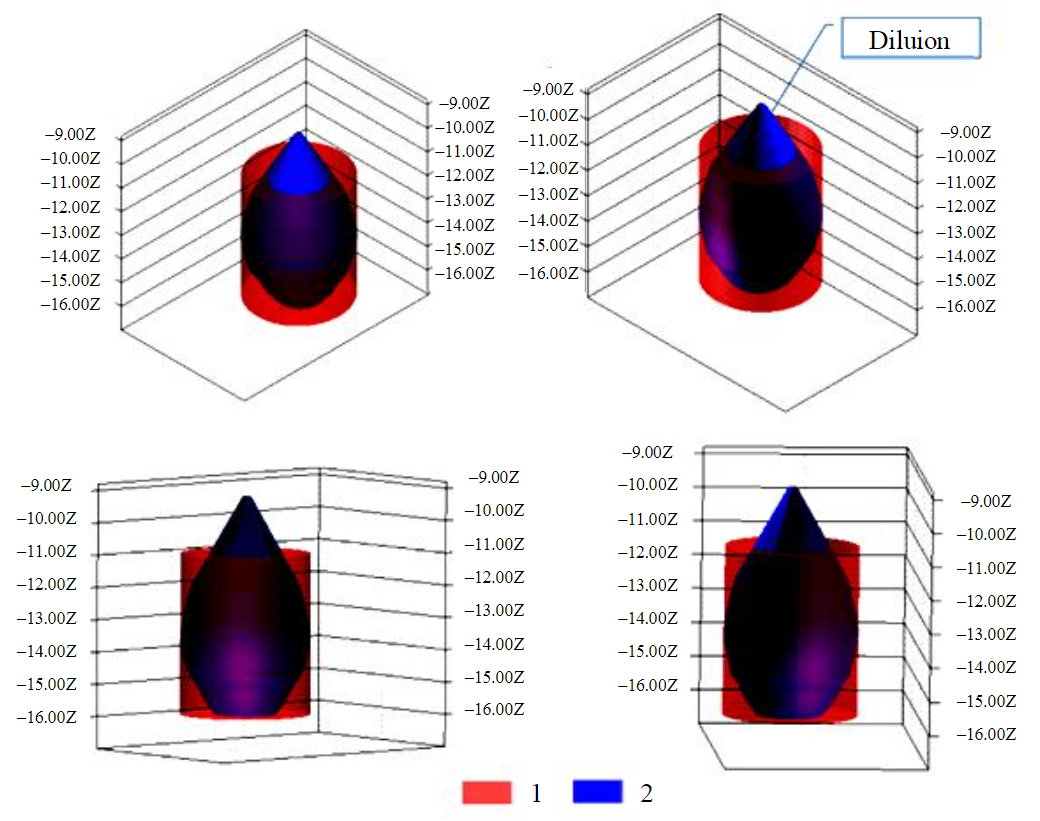
Fig.3. Combination of excavation dimensions and work plans 1 – sediment in the form of a tube; 2 – excavated results
The occurrence of dilution does not significantly affect the tin content in the actual drilling data. The yield ratio is 1.18, which was obtained from the division of borehole mining excavation realization grade by the drill grade data. The range of ratio is a comparison between the realization data and exploration data. The ratio tolerance range is +20 % or 0.80 to 1.20 [36].
From the above measurement data, the excavation dimension made using borehole mining can be estimated. Estimation was done by combining the data in Tables 1, 2 and made in a linear configuration. An illustration of the excavation can be seen in Fig.2.
Ground excavation started at layer 1 to layer 5, consisting of coarse and fine sand. The layer above this was a layer of clay, coarse sand, and fine sand. When the excavation was widened, there was an imbalance in the soil layer above it, resulting in collapse of the top layer. The type factor of the layer above with loose material was also the cause of this possibility to collapse. The volume of material falling into the excavation area was analogous to the dilution that occurred during excavation of the tin ore layer. The shape of the debris was also estimated to be analogous to the shape of the debris on the surface.
Layer 1 to layer 5 under excavation each had a thickness of 1 m, so the total thickness of the excavation was 5 m. The dimensions of the excavation were obtained from the data above and expressed in a graphical cross-section as shown in Fig.2.
Figure 2, a shows a cross-section of the excavation shape at each layer, which is illustrated by assuming that the hole area is circular. This figure does not predict dilution due to collapse of the material above it. Layer 3 of this image appears to have a radius of 2.688 m. This radius is greater than the reach of the borehole mining excavation test results (as far as 2 m), so the excavation dimension as shown in Fig.2, a needs to be corrected. Correction was carried out by entering the dilution factor and adjusting the radius of layer 3 with a digging range of 2 m. This correction resulted in an excavation volume at layer 3 of 12.56 m3. There was a volume reduction of 10.12 m3 from the initial data of 22.680 m3. The volume of 10.12 m3 is soil collapse originating from the layers above it (layers 1, 2) and the dilution that occurs. The volume of dilution that occurred during operation, as can be seen in Table 2, was 6.55 m3, so that the soil collapse originating from layers 1 and 2 was 3.57 m3. The dilution material was soil material originating from collapse of the layer above layer 1. The shape of the diluted material was estimated to be analogous to the shape of the collapse that occurred at the soil surface, namely, in the form of a cone. Based on these conditions, it was possible to estimate the borehole mining excavated cross-section, as shown in Fig.2, b.
During the excavation, the level of water also fluctuated due to the spray-suction process. This condition caused vertical water flow to rise and fall along the hole. This condition can also produce in an imbalance of the layers, which produce in soil slip-ups in the layers around the pipe, especially in the layers consisting of sand and weak clay. There is an expansion of the collapse/hole on the surface around the pipe.
Excavation at each layer ended when no more suctioned material was lifted to the surface. When in this condition, there is only water circulation, the water condition is relatively stable (there is no fluctuating flow of water like during ground excavation), and there is no longer any expansion of soil debris on the surface. The overall excavation ended when excavation reached layer 5, which was the last layer.
From the above conditions, parameters can be determined which can be used as a reference in estimating borehole mining reserves originating from spotted sediment resources, including mined material (mineable) and dilution factors. The shape of the excavation dimensions as depicted in Fig.2, b can be made into a three-dimensional model. The three-dimensional model created is shown in blue in Fig.3.
If the dimensions of the tin ore layer for the work plan or reserves are made in the form of a tube with a circle diameter of 4 m in accordance with the spray excavation range and a thickness of 5 m, then the volume of the excavation area is 62.8 m3. The volume of bank excavation as shown in Table 4 was 46.98 m3; this amount includes material from outside the excavated area that entered the excavation area (dilution). The ratio of the volume of material mined to the volume of tubular ore sediment is 0.75. From these two dimensions, a combination can be made as shown in Fig.3. The combination shows that parts of the work plan (tubes) were not excavated. It can also be seen that soil material from outside the work plan was excavated during mining.
Conclusions
The hydraulic borehole mining using a spray-suction mechanism can be applied to alluvial tin deposits. The equipment used featured an outer pipe (spray) measuring 6 inches and an inner pipe (suction) measuring 4 inches. From this research, mining parameters using the spray-suction borehole method were obtained, including: earthmoving capacity of 8-16 m3/h; an excavation radius of 2 m; a comparison between the mining data and exploration data (ratio) of 0.8-1.2;
A ratio of the volume of material mined to the volume of tubular ore sediment of 0.75 (volume of mining recovery); and dilution of 14 % of the excavated volume, or a Factor of Mining Dilution (FMD) of 1.14.
The benefit of this research is expected to provide an opportunity to increase the amount of onshore alluvial tin reserves to support tin production.
References
- Stephenson P.R., Allman A., Carville D.P. et al. Mineral resource classification – it's time to shoot the spotted dog'! Proceedings Sixth International Mining Geology Conference. Melbourne: The Australasian Institute of Mining and Metallurgy, 2006, p. 91-96.
- Sutedjo Sejarah. Sejarah penambangan Timah di Indonesia: abad ke 18-abad ke 20: sekitar sejarah perkembangan teknologi dan pengelolaan penambangan Timah di Indonesia. Pangkalpinang, Bangka: PT.Timah (Tbk), 2007, p. 286.
- The JORC Code. 2012 Edition. Australian Code for Reporting of Exploration Result. Mineral Resources and Ore Reserves. The Joint Ore Reserves Committee of The Australasian Institute of Mining and Metallurgy, Australian Institute of Geoscientists and Minerals Council of Australia, 2012, p. 8-21.
- CIM Definition Standards for Mineral Resources and Mineral Reserves. Westmount, Quebec, Canada: Canadian Institute of Mining, Metallurgy and Petroleum, 2014, p. 7-9.
- Lomberg K., Rupprecht S.M. The 2016 SAMREC Code. Journal of the Southern African Institute of Mining and Metallurgy. Vol. 117. N 12. p. 1095-1100. DOI: 10.17159/2411-9717/2017/v117n12a1
- Pan-European Standard for the Public Reporting of Exploration Results, Mineral Resources and Mineral Reserves. Pan-European Reserves and Resources Reporting Committee, 2021, p. 14-40.
- The SME Guide for Reporting Exploration Results, Mineral Resources, and Mineral Reserves (The 2014 SME Guide), 2014, p. 11-30.
- KODE-KCMI 2017. Kode Pelaporan Hasil Eksplorasi Sumber Daya Mineral dan Cadangan Mineral Indonesia. Edisi Cetak Kedua Tahun, 2019, p. 14-40.
- SNI 4726:2011 Pedoman pelaporan, sumberdaya, dan cadangan mineral. Badan Standardisasi Nasional, 2019, p. 10-29.
- Balasubramanian A. Placers and Placer Mining. Centre for Advanced Studies in Earth Science, University of Mysore, Mysore. 2017, p. 1-7. DOI: 10.13140/RG.2.2.27654.78403
- Ibrahim E., Lema L., Barnabé P. et al. Small-scale surface mining of gold placers: Detection, mapping, and temporal analysis through the use of free satellite imagery. International Journal of Applied Earth Observation and Geoinformation. 2020. Vol. 93. N 102194. DOI: 10.1016/j.jag.2020.102194
- Bano Z., Siddiqui A.M., Bhatti K. Unsteady Stokes Flow through a Porous Pipe with Periodic Suction and Injection with Slip Conditions. Journal of Applied and Computational Mechanics. 2020. Vol. 6. N SI, p. 1168-1177. DOI: 10.22055/JACM.2020.32136.1973
- Guobiao M., Sangani A.S. A method for computing Stokes flow interactions among spherical objects and its application to suspensions of drops and porous particles. Physic Fluids. 1994. Vol. 6. Iss. 5. N 1637. DOI: 10.1063/1.868227
- Akimoto H., Anoda Y., Takase K. et al. Laminar Flow and Turbulent Flow (The Similarity Rule). Nuclear Thermal Hydraulics. Springer Japan, 2018, p. 143-151. DOI: 10.1007/978-4-431-55603-9_9
- Hayat T., Shahzad F., Ayub M. Analytical solution for the steady flow of the third grade fluid in a porous half space. Applied Mathematical Modelling. 2007. Vol. 31. Iss. 11, p. 2424-2432. DOI: 10.1016/j.apm.2006.09.008
- Rizvandi O.B., Miao X.-Y., Frandsen H.L. Fast and stable approximation of laminar and turbulent flows in channels by Darcy’s Law. Alexandria Engineering Journal. 2021. Vol. 60. Iss. 2, p. 2155-2165. DOI: 10.1016/j.aej.2020.12.033
- Anglani F., Barry J., Dekkers W. A numerical study on high-pressure water-spray cleaning for CSP reflectors. AIP Conference Proceedings. 2016. N 1734. DOI: 10.1063/1.4949242
- Rui Chen, Hong Li, Jian Wang, Xin Guo. Effects of Pressure and Nozzle Size on the Spray Characteristics of Low-Pressure Rotating Sprinklers. Water. 2020. Vol. 12. Iss. 10. N 2904. DOI: 10.3390/w12102904
- Junior A.M., Costa Ferreira da M. Influence of Working Pressure and Spray Nozzle on The Distribution of Spray Liquid in Manual Backpack Sprayers. Arquivos do Instituto Biológico. 2019. Vol. 86. N e0442018, p. 1-9. DOI: 10.1590/1808-1657000442018
- Muffarih A., Silalahi S.K., Setyowidodo I. Analysis of Head Losses Consequent Section Diameter, Pipe Material and Flow Debit Using Contrast Test (Scheffe’s Method) At 900 Elbow Joint. IPTEK, The Journal of Engineering. 2017. Vol. 3. N 3, p. 9-14. DOI: 10.12962/j23378557.v3i3.a3081
- Melo V.G.M.L., Arau´jo A.C.S., Camargo A.P. et al. Head Loss in Thin-Walled Drip Tapes with Continuous Labyrinth. The Scientific World Journal. 2019. Vol. 2019. N 8640893, p. 1-11. DOI: 10.1155/2019/8640893
- Madeira A.A. Major and minor head losses in a hydraulic flow circuit: experimental measurements and a Moody’s diagram application. Eclética Química Journal. 2020. Vol. 45. N 3, p. 47-56. DOI: 10.26850/1678-4618eqj.v45.3.2020.p47-56
- Abduh M., Suhardjono, Sumiadi, Dermawan V. Simplified Equations and Ansys Simulation of Head Loss on Nonlinear (Sliced) Bend for Piping Network. Journal of Physics: Conference Series. 2020. Vol. 1477. N 052002, p. 1-8. DOI: 10.1088/1742-6596/1477/5/052002
- Oliviera A.R.E. History of Bernoulli Principle. Mechanisms and Machine Science. Springer, Cham, 2019. Vol. 73, p. 1161-1178. DOI: 10.1007/978-3-030-20131-9_115
- Shichikha J.M., Bitok J., Manyonge A.W., Sang K.N. Head Loss Analysis in Pipe System Components. Applied Mathematics. 2013. Vol. 3. N 5, p. 160-162. DOI: 10.5923/j.am.20130305.02
- Thappeta S. K., Fiener P., Chandra V. Experimental Study on Head Loss Due to Cluster of Randomly Distributed Non-Uniform Roughness Elements in Supercritical Flow. Water. 2022. Vol. 14. Iss. 3. N 464, p. 1-14. DOI: 10.3390/w14030464
- Fernando E., Fahrudin A.Manometer Design for Measuring Head Losses in Piping Test. Indonesian Journal of Innovation Studies. 2021. Vol. 13. DOI: 10.21070/ijins.v13i.531
- Provenzano G., Pumo D., Dio P.D. Simplified Procedure to Evaluate Head Losses in Drip Irrigation Laterals. Journal of Irrigation and Drainage Engineering. 2005. Vol. 131. Iss. 6. DOI: 10.1061/(ASCE)0733-9437(2005)131:6(525)
- Martin-Candilejo A., Santillan D., Garrote L. Pump Efficiency Analysis for Proper Energy Assessment in Optimization of Water Supply Systems. Water. 2020. Vol. 12. N 132. DOI: 10.3390/w12010132
- Matlakala M.E., Kallon D.V. Optimization of the Pumping Capacity of Centrifugal Pumps Based on System Analysis. MATEC Web of Conferences. 2021. Vol. 347, p. 1-12. DOI: 10.1051/matecconf/202134700024
- Shojaeefard M.H., Rizi B.S., Khalkhali A., Tahani M. A New Method to Calculate Centrifugal Pump Performance Parameters for Industrial Oils. Journal of Applied Fluid Mechanics. 2015. Vol. 8, p. 673-681. DOI: 10.18869/acadpub.jafm.67.223.21294
- Zaman M.H., Najmi J., Abbasi A.I. et al. Selection of a low-cost high efficiency centrifugal pump. Fifth International Conference on Aerospace Science & Engineering (ICASE), 14-16 November 2017, Islamabad, Pakistan, p. 1-7. DOI: 10.1109/ICASE.2017.8374273
- Solodkiy E.M., Kazantsev V.P., Dadenkov D.A. Improving the Energy Efficiency of the Sucker-rod Pump via Its Optimal Counterbalancing. International Russian Automation Conference, 8-14 September 2019, Sochi, Russia, p. 1-5. DOI: 10.1109/RUSAUTOCON.2019.8867737
- Euch Khay El S., Neji J., Loulizi A. Shrinkage properties of compacted sand concrete used in pavements. Construction and Building Materials. 2010. Vol. 24. Iss. 9, p. 1790-1795. DOI: 10.1016/j.conbuildmat.2010.02.008
- Yousif H.H., Karim T.H., Mohammad I.B. The Swell and Shrinkage Percentages for Various Soil Types and their Prediction from Intrinsic Soil Properties. Agricultural and Environmental Researches. 2020. Vol. 32. N 6, p. 123-137. DOI: 10.21271/zjpas.32.6.14
- Dominy S.C., Noppé M.A., Annels A.E. Errors and Uncertainty in Mineral Resource and Ore Reserve Estimation: The Importance of Getting it Right. Exploration and Mining Geology. 2002. Vol. 11. N 1-4, p. 77-98. DOI: 10.2113/11.1-4.77