
Fragmentation analysis using digital image processing and empirical model (KuzRam): a comparative study
- 1 — Ph.D., Dr.Sci. Lecturer University of Abderrahmane Mira ▪ Orcid
- 2 — Ph.D., Dr.Sci. Lecturer University of Abderrahmane Mira ▪ Orcid ▪ Scopus
- 3 — Ph.D., Dr.Sci. Lecturer University of Abderrahmane Mira ▪ Orcid
- 4 — Professor Ferhat Abbas University

Abstract
The rock fragmentation reflects the degree of control of blasting. Despite the accuracy of screening analysis to determine the size distribution of blasted rocks, this technique remains complex and long because of the large volume of blasted rocks. The digital image processing method can overcome these constraints of accuracy and speed. Our method uses the empirical model of KuzRam and numerical method (Digital image processing) through two image processing software’s (WipFrag and Split-Desktop) to analyze the particle size distribution of rocks fragmented by explosives in Jebel Medjounes limestone quarry. The digital image processing is based on the photography of the pile of blasted rock analyzed using image processing techniques. The objective of this work is to evaluate and compare the results obtained for each blast from the two methods and to discuss the similarities and differences among them. Three different blasts with the same design were analyzed through the two methods. The result of the KuzRam model gave idealistic results due to the heterogeneity of the structure of the rocks; although, this model can be used for an initial evaluation of blast design. For better efficiency of the explosion, we proposed a new fragmentation indicator factor in order to compare the fragment produced to the estimated ideal size obtained from the KuzRam model by incorporating the blast design parameters and the rock factor. Both image processing gives close results with more accuracy for the Split-Desktop software. Our method can improve the efficiency and reduce crushing costs of the studied career.
None
Introduction
The surface mining process requires several fundamental operations such as drilling, blasting, loading, hauling, and crushing [1, 2]. As an initial operation, drilling and blasting have a significant impact on the performance and cost of subsequent operations [3, 4]. The role of blasting consists to achieve optimal rock fragmentation, which increases the efficiency of crushing and economizes energy [5, 6]. It must optimize the size of blasting rock to geometries which not exceed the primary crushing opening size [7].
The fragmentation of rocks by explosives depends mainly on the design of the blast and the properties of the rock mass [8, 9]. The heterogeneity degree of rocks leads to different size distributions of blasted rock piles. The control of this size distribution is very influential on the economic success of the mining operation [10-13]. Rock fragmentation by explosives must be regularly monitored, measured, analyzed, designed, planned, and accordingly modified to achieve an efficiency of the mining processes [14, 15].
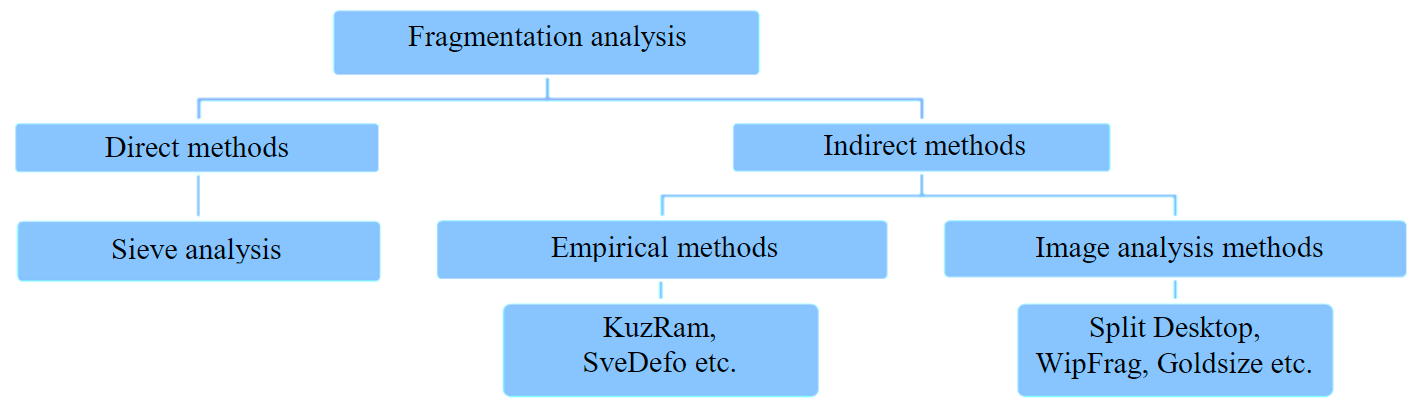
Fig.1. Flowchart of fragmentation analysis methods
The efficiency of the blast can be estimated by determining the particle size distribution of the fragments of the rock blast. There are many methods for estimating the size distribution of fragments of blasted rocks [16] including uncontrollable methods based on physical and mechanical properties of rocks and controllable methods dependent on design factors such as determination of size distribution and fragmented rocks prediction [17]. The controllable methods can be divided into direct and indirect methods, as shown in Fig.1. The direct method that is more reliable for determining the distribution of fragmented rocks is sieve analysis. Although the accuracy of this method is very high, the difficulty is mainly that it requires more time and high cost to obtain a suitable distribution of fragmented rocks. Nevertheless, the sieve analysis method can be used in part and in some low-vo-lume experimental explosions [18, 19]. On the other hand, indirect methods including empirical and image analysis techniques provide a trade-off between the accuracy of the test and the amount of time and cost.
In some empirical models such as Larsson’s equation, SveDeFo formula, KuzRam model, etc., blasting parameters are considered to determine the size distribution of blasted rock before blasting [20]. In this regard, another technique is using image processing programs which have been developed and have made rapid and accurate blast fragmentation distribution assessment possible [21, 22]. Some of these systems include IPACS, Tucips, FragScan, CIAS, GoldSize, WipFrag, Split, PowerSieve and Fragalyst [23-25]. Split-Desktop, WipFrag, FragScan and Gold Size are the most popular software packages based on 2D image processing for performing size distribution analysis of the blasted rock blocks. In image analysis method, the size distribution of fragmented rocks can be determined precisely using the captured images after blasting.
Researchers are continuously improving the models of rock fragmentation by explosives in order to compare and analyze the predicted distribution with the actual fragmentation obtained [26]. They have commonly recognized the relationship between the different levels of accuracy, speed, efficiency, and the optimization of empirical models, image analysis techniques, and numerical models [27, 28].
Due to the limitations of the results of indirect analysis methods, several researchers have conducted a number of studies related to the particle size analysis of blasted rock piles [29, 30]. Various empirical and numerical models have developed for the prediction of heap size distribution after rock blasting [31-33].
The objective of this work is to evaluate and compare the results obtained for different blast from the two methods and discuss the similarities and differences between them.
General setting
The cement company of Ain El-Kebira (SCAEK) (Setif Province) is one of the most important cement industrial units in Algeria. SCAEK is located in the northeastern of Algeria in 36°20' N latitude and 5°27' E longitude and 1040 m of Altitude. It is at 20 km northeastern of Setif city (Fig.2) [34]. One of the key success factors of this company is the use of high quality and cheap raw materials, which are available in the nearby regions [35]. This material is supplied from the Jebel Medjounes deposit adjacent to the plant. This deposit is characterized by a very pronounced relief, extends over 15 km from east to west, with an average width of 7 km, reaching an altitude of 1461 m at the peak. The limestone rock is medium-hard, the upper part of the limestone deposit is strongly fractured, which poses problems of clogging of holes during drilling and the quality of felling, the compressive strength of the rocks is 87 MPa and a density of 2.6 t/m3 [36].
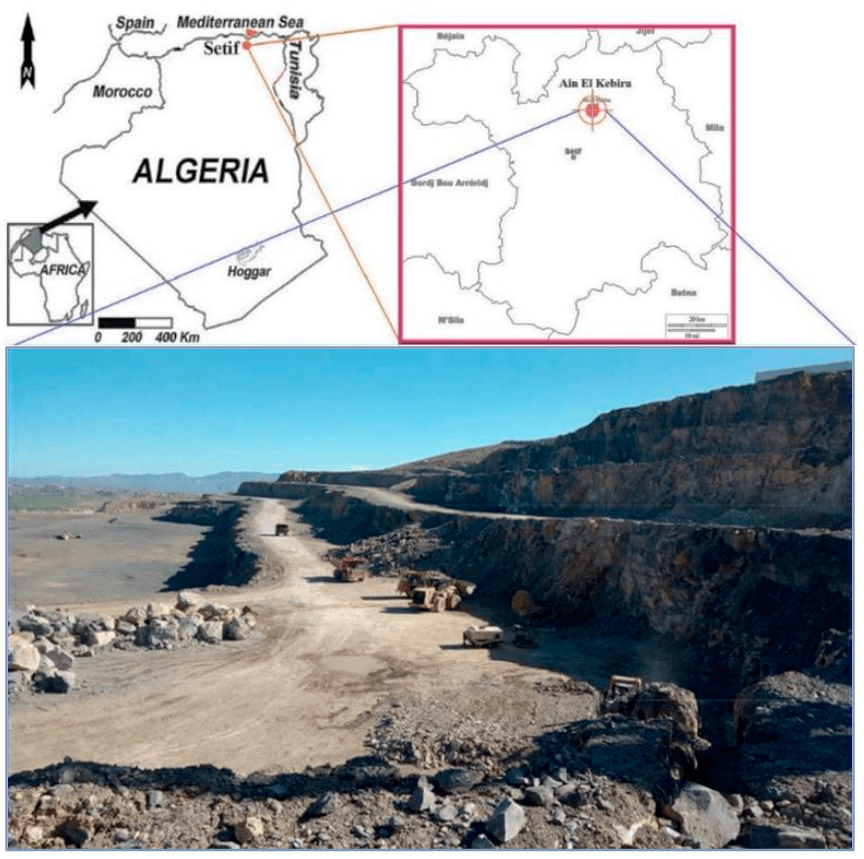
Fig.2. Jebel Medjounes limestone quarry, Ain El-Kebira, Setif
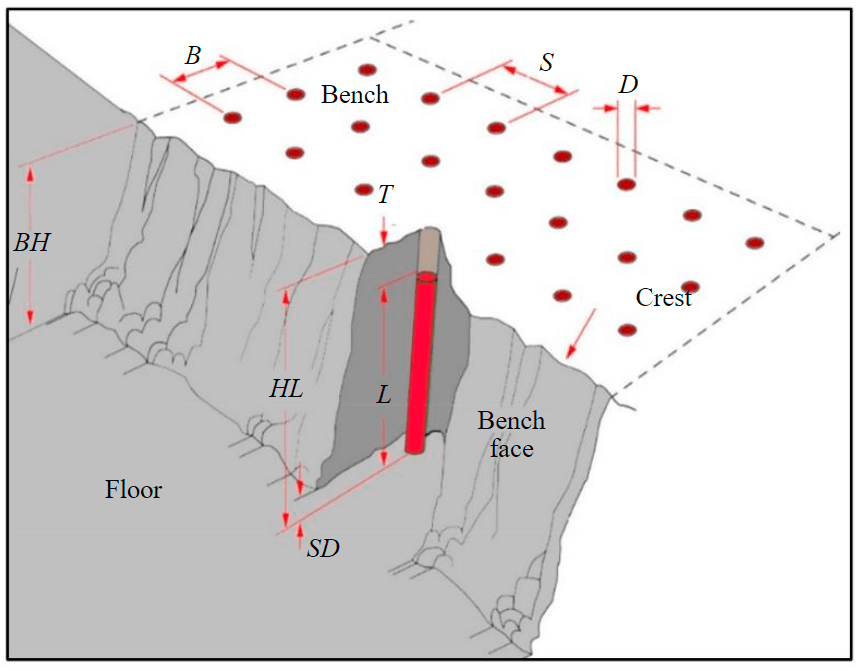
Fig.3. Blast design used in Jebel Medjounes limestone quarry
The exploitation of the limestone quarry is carried out according to five benches, by the drilling and blasting method. The quarry operates with benches of 15 m in height and 82° of dip angle. The holes drilled with percussion with blast holes diameter of size 110 mm. Each hole is loaded with 79.15 kg of Marmanite and approximately 45 kg of ANFO per hole for a total explosive quantity in the blast hole Q equal 124.15 kg, with a charge density of explosive K. The blast holes are staggered in three rows. The blast design parameters presented in Fig.3 and the different parame-ters: bench heigt ВН – 15 m; burden В – 4 m; spacing S – 4 m; holediameter D – 110 mm; subdrill – 1.65 m; stem height Т – 2.70 m; charge legth L – 14.1 m; hole legth HL – 16.8 m; total explosive guantity Q – 124.15 kg; charge density of explosive K – 0.48 kg/m3.
Materials and methods
Blast fragmentation should continually be monitored, measured, analyzed and their designs updated. The classical methods used a sieve analysis [37]. The expensiveness of this technique has led to the emergence of several indirect methods to estimate the size distribution [38-40].
The analysis of the particle size distribution of the fragmented rocks in the Jebel Medjounes quarry is carried out by the empirical model KuzRam and the numerical method through two image processing software's (WipFrag and Split-Desktop) as shown in Fig.4.
The KuzRam fragmentation model was derived by Cunningham (1983, 1987), from Rosin – Rammler (1933) and Kuznetsov (1973) equations to calculate the average size and the uniformity index. This model is an empirical relationship that evaluates blast fragmentation by incorporating blast design parameters, blast geometry, explosive characteristics, quantity of explosive used and rock factors [41-43]. Parameters of the KuzRam model:
- mean size fragments, m: $X_{50}=A[PF]^{-0,8}Me^{0,167}\left(\frac{115}{RWS_\mathrm {{ANFO}}}\right)^{0,633}$;
- size distribution curve: ;
- uniformity index: ,
where A – rock factor; PF – specific charge in kg/m3; Me – charge mass per blast holes, kg; RWSANFO – the relative weight strength of the explosive to ANFO, %; Ep – blast holes deviation.
The Split-Desktop software is a numerical image processing program, resulted from several years of research and development at the University of Arizona in the 90s. Two versions exist of this program; the first is an automatic and continuous that is used on the conveyor belt and the second is the Split-Desktop software refers to the offline, user-assisted version of the Split programs that can operate on saved images. The digital images can obtain by using a high-resolution digital camera in any support where the images are clear. Once the images are taken, they will be saved on a disk.
The WipFrag image analysis software uses an image analysis technique of fragmented rock to predict the particle size distribution in the mined rock pile. It was developed by Wipware, Inc (Ca-nada) [40]. It processes images from various sources such as camcorders, fixed cameras, photographs, or digital files. And uses automatic algorithms to identify individual blocks and create an outline net. The images of the rock pile are acquired in the field; coupled to a scaling device to reference the size. The recorded rock pile is uploaded to the WipFrag system. The image of the broken rocks is transformed into a map or particle network, converted into volumes and weights and the results are displayed as graphs. The reliability and speed of fragment contour detection allows fully automatic remote monitoring at a rate of a few seconds per image [24].
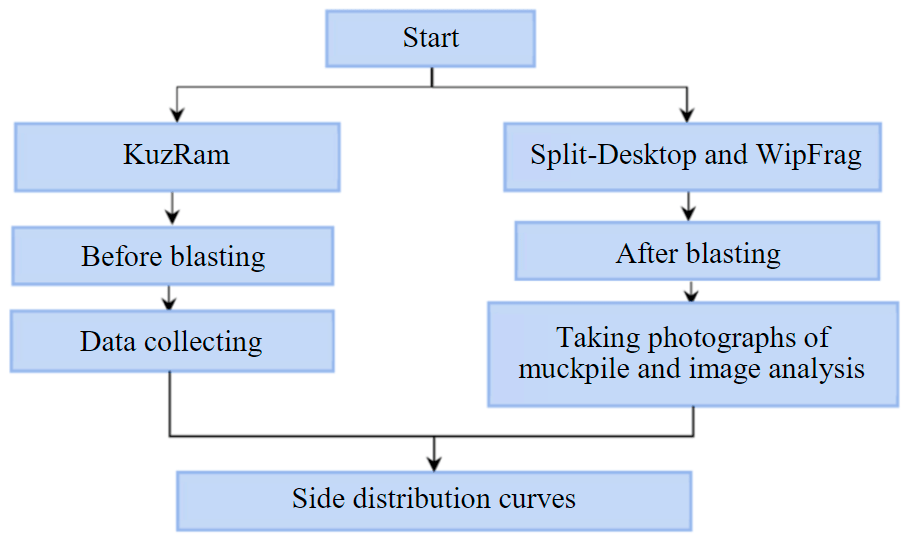
Fig.4. Fragmentation analysis steps
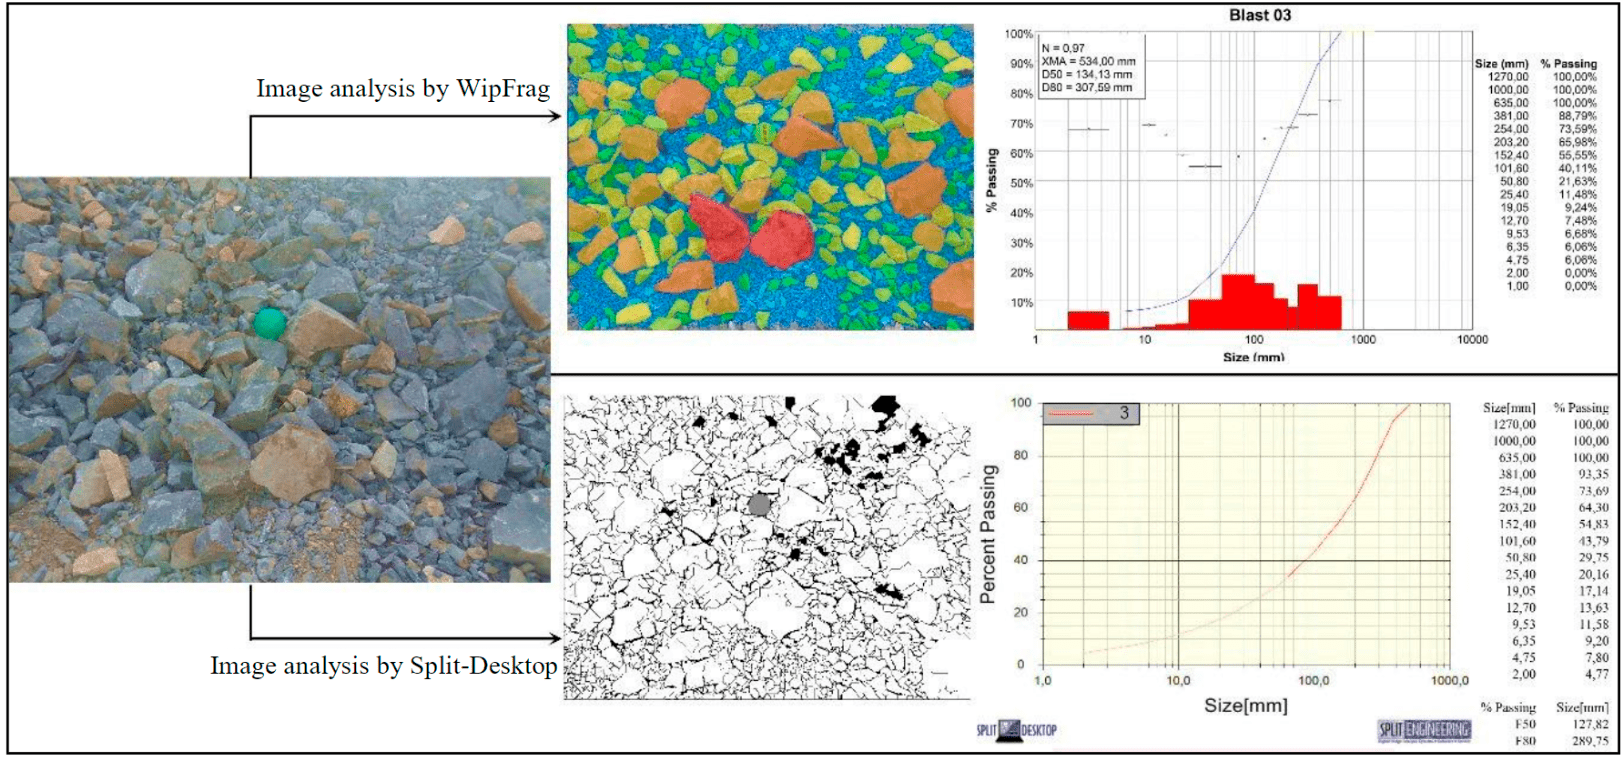
Fig.5. Main steps of image processing analysis
In order to realize the size distribution of blasting operations, three blasts were carried out in different areas and with the same blasting design. The first blast was made in the upper part of the deposit wherever the massif structure is strongly fractured. The other blasts (blast 2 and blast 3) are carried out in the lower part of the deposit which has high rock quality. The data from three different blasting operations consisting of burden, hole spacing, powder factor, hole diameter, bench height, hole length, and stemming length were collected. In addition, the geomechanical properties of rocks such as UCS, density, and young’s modulus were measured in the laboratory based on the International Society for Rock Mechanics (ISRM) standards.
The parameters of the blast design were obtained and evaluated as inputs to the KuzRam model (Excel worksheet). A passing percentage of (X50) was compared of the blasted rock size of 1000 mm, considering that the primary crusher installed in the quarry is accepted for fragmented rock sizes less than 1000 mm and produces a fine size product of 152.4 mm.
The image processing analysis was carried out by taking several photographs from fragmented muckpile in three steps (after blasting, in the one-third and two-thirds of loading by loader) and uploaded to the computer for WipFrag and Split-Desktop analysis. These software's uses images captured with one object (ball) that is used as scaling tool (Fig.5). These photographs were taken randomly in consideration of size variation and defined scales. In the next step, several randomly chosen photographs were selected as input file for the two-processing software. After the scaling process, in few seconds to minutes the software delineates images automatically and the status of the auto meshing displayed. After getting the mesh results, we notice that the boundaries have not been drawn correctly, and the results (particle size distribution curve) are completely different from reality, which requires every fragment so some manual editing must be done. Edge detection parameters were further manually adjusted to enhance a better result. A virtual sieve was then carried out to measure block sizes and to generate percentage passing curve of the fragment distribution and cumulative size table for each analyzed image. The processes are repeated for other images from the same muckpile, and the results are merged for better accuracy.
Results and discussion
The results of the analysis particle size distribution of the blasted rockpile obtained from the three different blasts using the Split-Desktop and WipFrag software are shown in Fig.6, while Fig.7 compare the KuzRam curve with the three results obtained from Split-Desktop and WipFrag. In the quarry of Ain El-Kebira, the maximum permissible size of the fragment that the primary crusher can handle is 100 cm.
From Fig.6 the results of blasts 1, 2, and 3 in the Split-Desktop analysis produced 23.12, 13.66, and 54.83 % fines (<15.24 cm), respectively. Average measured fragment sizes (X50) of 33.96, 34.86 and 12.78 cm were obtained for blasts 1, 2 and 3 respectively. The top size of the fragmented rock from all blasts was less than the primary crusher opening of 100 cm. This implies that an insignificant amount of the muck-pile (<4.5 %) of boulders in blast 1 (Fig.6, a), (<2.5 %) of boulders in blast 2 (Fig.6, b) and with zero amount in blast 3 (Fig.6, c).
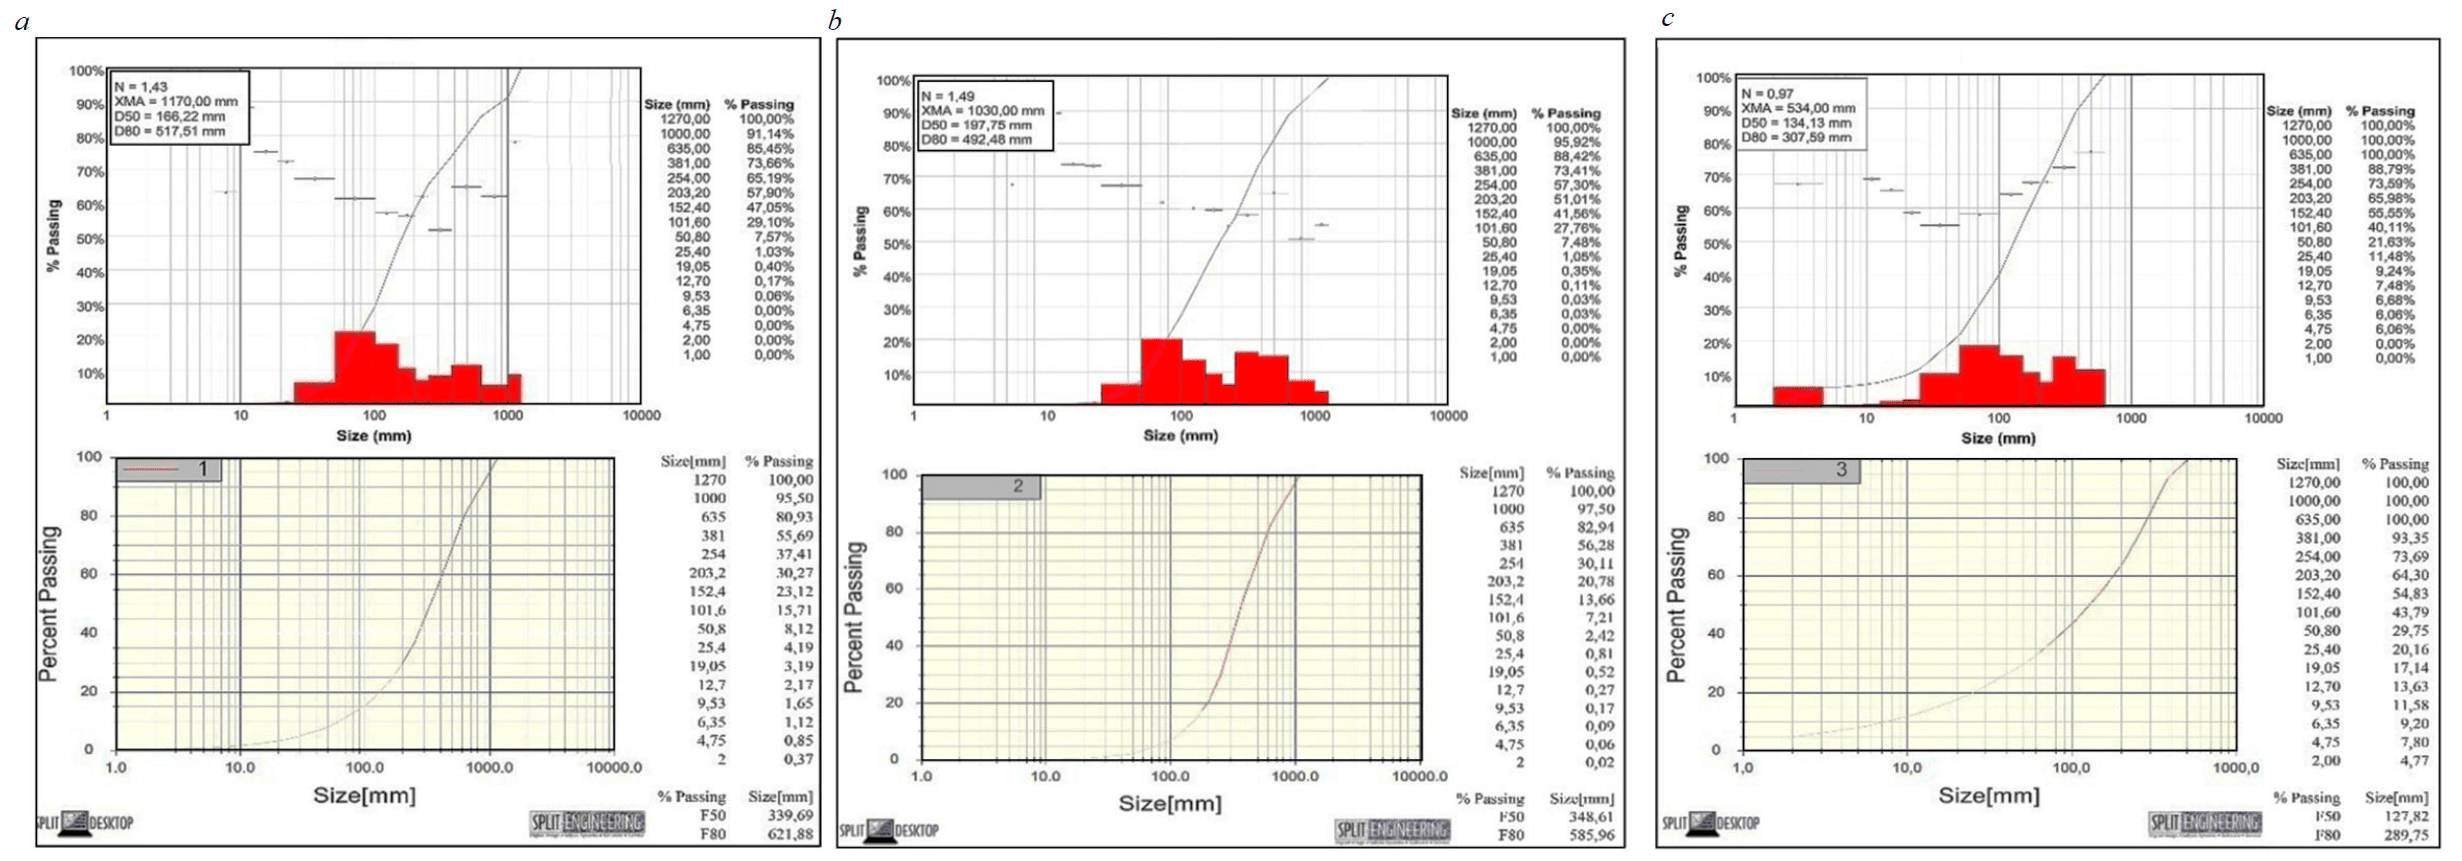
Fig.6. Split-Desktop and WipFrag analysis of blasts: a – blast 1; b – blast 2; c – blast 3
The results by numerical analysis by WipFrag software produced in the three blasts 47.05, 41.92 and 55.55 % of fines (<15.24 cm) respectively with average measured fragment sizes (X50) of 16.62, 19.77 and 13.41 cm were obtained for blasts 1, 2 and 3 respectively. The upper fragmented rock size values of all blasts were smaller than the 100 cm crusher opening with percentages of the muckpile is (<8.86 %) boulders in blast 1, and (<4.1 %) boulders in blast 2 and with zero amount of the muckpile blocks in blast 3. Therefore, the results of KuzRam fragmentation were stable (same results found in three blasts) with insignificant or near zero amount of boulders (<0.01 %) of the top sizes of the fragmented rocks from all blasts was less than the crusher opening of 1000 mm.
The Split-Desktop results show that boulders were observed in the blasts 1and 2, with blast 3 has the least proportion of boulders of 0.00 % while blast 1 having the highest percentage boulder of 4.5 %. The maximum allowable size of the fragment that the primary crusher can handle is 1000 mm. The Split-Desktop analyses show a very closely related particle size distribution for the three blasts with X50: 339.69, 348.61 and 127.82 mm respectively.
While, the particle size distribution obtained from the WipFrag program almost gives the same results as the Split-Desktop program although showing a similar trend. The WipFrag program shows that all muckpile s fragments are less than the 1000 mm benchmark; the three WipFrag analyses indicate a tolerable range of boulders, with percent passing recorded of 91.14 % in blast 1, 95.9 % in blast 2 while blast 3 has the highest percentage of passing of 100 %. The three independent WipFrag results are very similar of Split-Desktop program as shown in Fig.6, thus reflect the same implemented design. The small difference can be noticed is the variation in the structural characteristics of the rock mass [44].
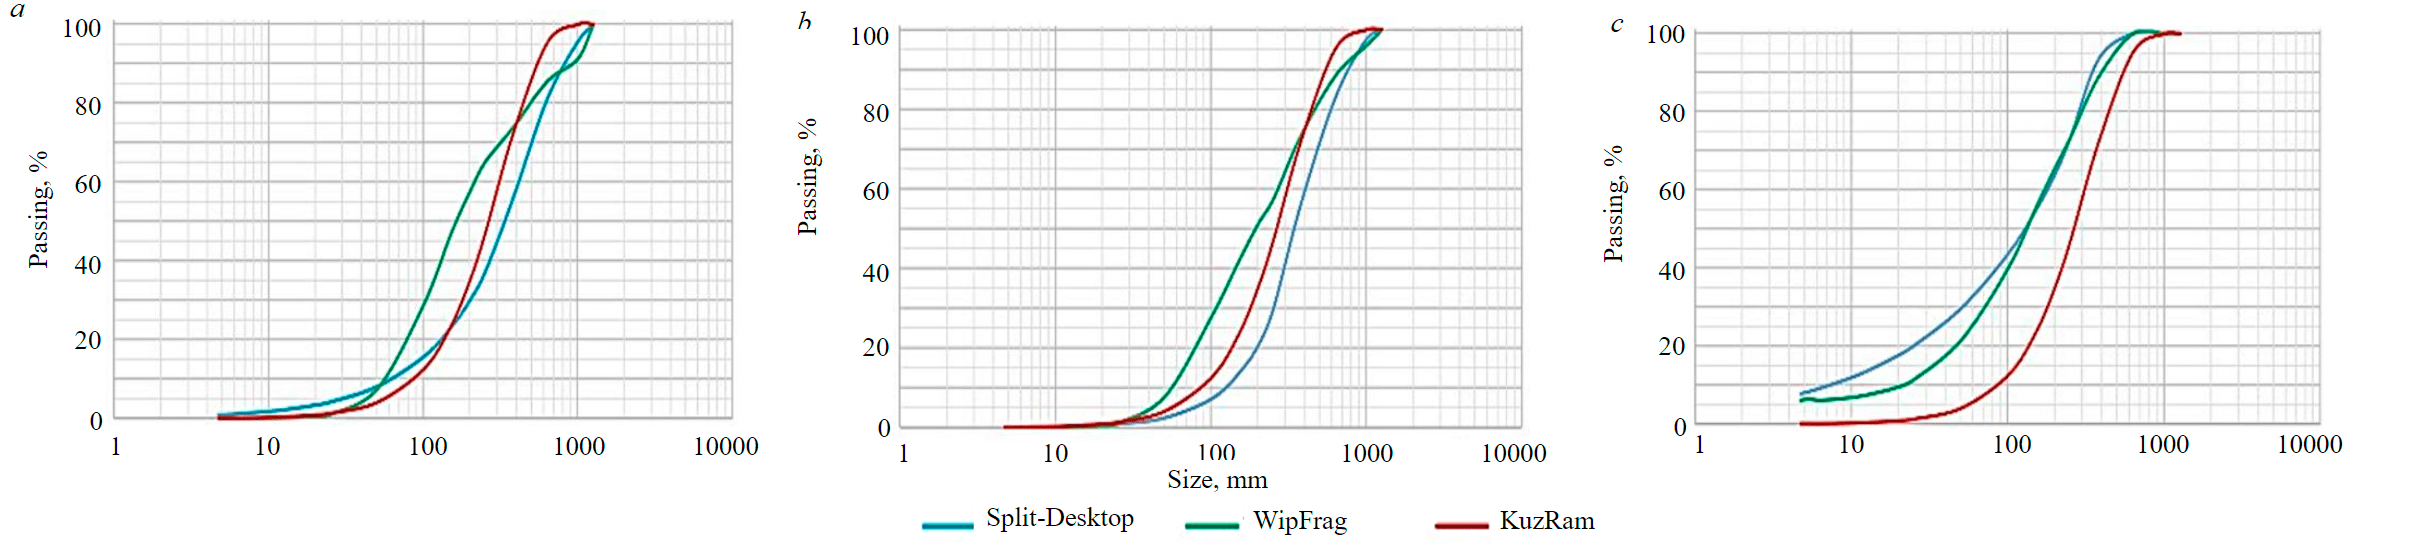
Fig.7. KuzRam compare Split-Desktop and WipFrag size distribution curves for three blasts: a – blast 1; b – blast 2; c – blast 3
According to the results of the percentage passing obtained from the three analysesshown in Table 1, the KuzRam model gives stable results in the three blasts of the order of 99.99 % of the passers-by with percentages of rate of boulders at the quarry of 0.01 %.
The analysis of the results shows a very close particle size distribution for the three blasts in both empirical and numerical methods with stable X50 values by the KuzRam model of 266 mm, and variable from 127.82 to 348.61 mm in the analysis by Split-Desktop software and the order of 134.13 mm to 197.75 in the numerical analysis by WipFrag software.
The percentage of boulders indicated by the numerical analysis of the muckpile confirms the results obtained with the KuzRam model but with a greater precision.
The analysis of the particle size distribution for the two image processing software's, gives a similar result of 100 % passing in the third blast. Therefore, based on the above results, and to assess the efficiency of the blasts, a new factor for the evaluation of the quality of fragmentation by blasting in the limestone quarries is introduced here as a fragmentation indicator:
where XKR – ideal medium size expected of the fragmented material by the KuzRam model, mm (X50 size of KuzRam); Xbm – medium fragmented muckpile size from particle distribution ana-lysis, mm.
The fragmentation indicator gives an idea of the fragmentation efficiency by comparing the produced fragment to the idealized size of the KuzRam model. Using the blast design parameters, explosive parameters, intact rock and joint properties, and the estimated ideal size obtained from the both Split-Desktop and WipFrag methods; through the photos processing captured in the muckpile. The FI seems to be more influenced by the rock mass structure, variable in the quarry. An FI value less than unity implies that the average fragment size obtained is larger than the ideal size while an FI that is greater than 1 shows a very efficient fragmentation with an average fragment size less than or equal to the ideal size. The value of FI would be above of 1 [45-47].
Table 1
Result of percentage passing for Split -Desktop, WipFrag and KuzRam analyses
|
Size, mm |
Passing, % |
||||||
|
Split-Desktop |
WipFrag |
KuzRam |
|||||
|
Blast 1 |
Blast 2 |
Blast 3 |
Blast 1 |
Blast 2 |
Blast 3 |
||
|
0.00 |
00.00 |
00.00 |
00.00 |
00.00 |
00.00 |
00.00 |
00.00 |
|
2.00 |
0.37 |
0.02 |
4.77 |
00.00 |
00.00 |
00.00 |
00.00 |
|
4.75 |
0.85 |
0.06 |
7.80 |
00.00 |
00.00 |
6.06 |
00.10 |
|
6.35 |
1.12 |
0.09 |
9.20 |
00.00 |
0.03 |
6.06 |
00.10 |
|
9.53 |
1.65 |
0.17 |
11.58 |
0.06 |
0.03 |
6.68 |
00.20 |
|
12.70 |
2.17 |
0.27 |
13.63 |
0.17 |
0.11 |
7.48 |
00.40 |
|
19.05 |
3.19 |
0.52 |
17.14 |
0.40 |
0.37 |
9.24 |
00.80 |
|
25.40 |
4.19 |
0.81 |
20.16 |
1.03 |
1.08 |
11.48 |
1.30 |
|
50.80 |
8.12 |
2.42 |
29.75 |
7.57 |
7.77 |
21.63 |
4.10 |
|
101.60 |
15.71 |
7.21 |
43.79 |
29.10 |
27.96 |
40.11 |
12.60 |
|
152.40 |
23.12 |
13.66 |
54.83 |
47.05 |
41.92 |
55.55 |
23.60 |
|
203.20 |
30.27 |
20.78 |
64.30 |
57.90 |
51.33 |
65.98 |
35.50 |
|
254.00 |
37.41 |
30.11 |
73.69 |
6519 |
57.53 |
73.59 |
47.30 |
|
381.00 |
55.69 |
56.28 |
93.35 |
73.66 |
73.40 |
8879 |
72.00 |
|
635.00 |
80.93 |
82.94 |
100.00 |
85.45 |
88.41 |
100.00 |
95.20 |
|
1000.00 |
95.50 |
97.50 |
100.00 |
91.14 |
95.90 |
100.00 |
99.90 |
|
1271.00 |
100.00 |
100.00 |
100.00 |
100.00 |
100.00 |
100.00 |
100.00 |
In our study, based on direct observations that were made on the fragmented pile and the previous results given by the two methods (after blasting, one-third and two-thirds loading by the loader), we found that the results of the mean size fragment (X50) given by the image processing technique (Split-Desktop and WipFrag) are closer to reality than that given by the KuzRam model.
According to the results obtained from the fragmentation indicator, by the image processing technique shown in Table 2, we find that:
- In WipFrag analysis, all the fragmentation indicators given by the different blasts are greater than 1 (FI > 1), which implies that the mean size of the fragments is less than or equal to the ideal size, which confirms that the three blasts are very efficient fragmentation, with a maximum fragmentation indicator, given by the third blast (FI = 1.98).
- In Split-Desktop analysis, the values of the fragmentation indicator given by blasts 1 and 2 are less than 1 (FI = 1), which implies that the mean size of the fragments is greater than or equal to the ideal size, which confirms that the two blasts are not efficient fragmentations, while the value of the fragmentation indicator given by the third blast is greater than 1 (FI = 2.08).
Table 2
Fragmentation indicators in Split-Desktop and WipFrag analysis
|
Blast |
XKR, mm |
Xbm, mm |
FI |
||
|
Split-Desktop |
WipFrag |
Split-Desktop |
WipFrag |
||
|
|
|
|
|
|
|
|
1 |
266 |
339.69 |
166.22 |
0.78 |
1.6 |
|
2 |
266 |
348.61 |
197.75 |
0.76 |
1.34 |
|
3 |
266 |
127.82 |
134.13 |
2.08 |
1.98 |
In the light of all these results, we can conclude that blast 3 records the highest values of FI (2.08 and 1.98 respectively Split-Desktop and WipFrag) and is therefore considered as the most efficient fragmentation.
Conclusion
In this paper, we use the empirical method of the KuzRam model, and the numerical method of the digital imaging software’s Split-Desktop and WipFrag to study and compare the particle size distribution of the rock fragmented caused by the explosion in the limestone quarry of Ain El-Kebira. Three different explosions of the same design are analyzed and compared. The results of the Split-Desktop analysis gave similar values, with the maximum percentage of boulders equal to 4.5 %.
The WipFrag analyses are very close to each other by maximum percentage of boulders equals 8.86 % and the minor differences can be attributed largely to the usual heterogeneity of structural features and errors caused by the miners.
However, the particle size distribution predicted by the KuzRam model clearly shows a significant change from Split-Desktop and WipFrag and cannot reflect the true value obtained (the same value on all three blasts). The KuzRam model underestimates the size of the fragments, and the average fragment size predicted is less than the correct value for the three blasts studied. These differences can be attributed to the difference in the characteristics of the discontinuities that the model assumes to be uniformly distributed in the rock mass. Since the blast design and explosives used for the three blasts are the same, it can be concluded that these differences are caused by the usual changes in the structural properties of the rock mass, such as compressive strength, crack openings, joint fillings, and groundwater conditions.
The empirical method is very useful in mining for evaluation and preliminary analysis of blast design. In this research we used a new constant called fragmentation indicator was introduced to evaluate the fragmentation efficiency of explosives. It compares the ideal average fragment size to the actual average size obtained by blasting in a relative manner.
The KuzRam model gives only idealistic results due to variation in rock structural characteristics and blast geometry, explosive properties, rock factor, and physicochemical properties of rocks not accounted for by the model affect fragmentation quality.
Empirical fragmentation models do not always give correct answers, so it is important to improve the fragmentation measurement technique according to the general conditions of the quarry being studied. The results of analysis by the digital image processing method using the two software programs are very close to each other with minor differences can be attributed largely to the different structural characteristics of the rocks formation (homogeneity, cracking, joint dip, stratification etc.) and to technical errors in the blast design. This implies the effectiveness of the image processing technique.
References
- Fredj M., Hafsaoui A., Talhi K., Menacer K. Study of the powder factor in the surface bench blasting. Procedia Earth and Planetary Science. 2015. Vol. 15, p. 892-899. DOI: 10.1016/j.proeps.2015.08.142
- Rais K., Kara M., Hr Hadji R. et al. Original approach for the drilling process optimization in open cast mines; case study of Kef Essenoun open pit mine Northeast of Algeria. Mining Science. 2017. Vol. 24. DOI: 10.5277/msc172409
- Rezaeineshat A., Monjezi M., Mehrdanesh A., Khandelwal M. Optimization of blasting design in open pit limestone mines with the aim of reducing ground vibration using robust techniques. Geomechanics and Geophysics for Geo-Energy and Geo-Resources. 2020. Vol. 6. N 40. DOI: 10.1007/s40948-020-00164-y
- Phamotse K.M., Nhleko A.S. Determination of optimal fragmentation curves for a surface diamond mine. Journal of the Southern African Institute of Mining and Metallurgy. 2019. Vol. 119. N 7, p. 613-619. DOI: 10.17159/2411-9717/494/2019
- Hosseini M., Namvar Z.N. The Design of the Large Blastholes Pattern by Analyzing of Fragmentation of Blasted Rocks in Sarcheshmeh Copper Mine. Geotechnical and Geological Engineering. 2017. Vol. 35. N 1, p. 395-402. DOI: 10.1007/s10706-016-0115-6
- Bastami R., Bazzazi A.A., Shoormasti H.H., Ahangari K. Predicting and Minimizing The Blasting Cost In Limestone Mines Using a Combination of Gene Expression Programming and Particle Swarm Optimization. Archives of Mining Sciences. 2020. Vol. 65. N 4, p. 835-850. DOI: 10.24425/Ams.2020.135180
- Kulula M.I., Nashongo M.N., Akande J.M. Influence of Blasting Parameters and Density of Rocks on Blast Performance at Tschudi Mine, Tsumeb, Namibia. Journal of Minerals and Materials Characterization and Engineering. 2017. Vol. 5. N 6, p. 339-352. DOI: 10.4236/jmmce.2017.56028
- Mireku-Gyimah D., Boateng S.K. Selection of Blast Design for Kofi Pit C of Endeavour Mining Corporation, Mali. Ghana Mining Journal. 2018. Vol. 18. N 2, p. 30-36. DOI: 10.4314/gm.v18i2.4
- Fredj M., Hafsaoui A., Riheb H. et al. Back-analysis study on slope instability in an open pit mine (Algeria). Naukovyi Visnyk Natsionalnoho Hirnychoho Universytetu. 2020. Vol. 2, p. 24-29. DOI: 10.33271/nvngu/2020-2/024
- Borana S.L., Yadav S.K., Parihar S.K. Image Processing Analysis of Blast Fragmentation: A Case Study of Sandstone Mining Area of Jodhpur. International Journal of Research in Advent Technology. 2018. Vol. 6. N 10, p. 2584-2589. DOI: 10.13140/RG.2.2.24151.73120
- Agyei G., Owusu-Tweneboah M. A Comparative Analysis of Rock Fragmentation using Blast Prediction Results. Ghana Mining Journal. 2019. Vol. 19. N 1, p. 49-58. DOI: 10.4314/gm.v19i1.6
- Alenichev I.A., Rakhmanov R.A. Empirical regularities investigation of rock mass discharge by explosion on the free surface of a pit bench. Journal of Mining Institute. 2021. Vol. 249, p. 334-341. DOI: 10.31897/PMI.2021.3.2
- El Mekki A., Hadji R., Chemseddine F. Use of slope failures inventory and climatic data for landslide susceptibility, vulnerability, and risk mapping in souk Ahras region. Mining Science. 2017. Vol. 24, p. 237-249. DOI: 10.5277/msc172417
- Babaeian M., Ataei M., Sereshki F. et al. A new framework for evaluation of rock fragmentation in open pit mines. Journal of Rock Mechanics and Geotechnical Engineering. 2019. Vol. 11. Iss. 2, p. 325-336. DOI: 10.1016/j.jrmge.2018.11.006
- Djoudi M., Bensehamdi S., Fredj M. Study of blasting effect on bench stability. IOP Conference Series: Earth and Environmental Science. 2021. Vol. 833. N 012196. DOI: 10.1088/1755-1315/833/1/012196
- Salmi E.F., Sellers E.J. A review of the methods to incorporate the geological and geotechnical characteristics of rock masses in blastability assessments for selective blast design. Engineering Geology. 2021. Vol. 281. N 105970. DOI: 10.1016/j.enggeo.2020.105970
- Singh B.K., Mondal D., Shahid M. et al. Application of digital image analysis for monitoring the behavior of factors that control the rock fragmentation in opencast bench blasting: A case study conducted over four opencast coal mines of the Talcher Coalfields, India. Journal of Sustainable Mining. 2019. Vol. 18 Iss. 4, p. 247-256. DOI: 10.1016/j.jsm.2019.08.003
- Xie C., Nguyen H., Bui X-N. et al. Predicting rock size distribution in mine blasting using various novel soft computing models based on meta-heuristics and machine learning algorithms. Geoscience Frontiers. 2020. Vol. 12. Iss. 3. N 101108. DOI: 10.1016/j.gsf.2020.11.005
- Dhekne P.Y., Balakrishnan V., Jade R.K. Effect of Type of Explosive and Blast Hole Diameter on Boulder Count in Limestone Quarry Blasting. Geotechnical and Geological Engineering. 2020. Vol. 38, p. 4091-4097. DOI: 10.1007/s10706-020-01280-y
- Sereshki F., Hoseini S.M., Ataei M. Blast fragmentation analysis using image processing. International Journal of Mining and Geo-Engineering. 2016. Vol. 50. Iss. 2, p. 211-218. DOI: 10.22059/ijmge.2016.59831
- Siddiqui F.I., Ali Shah S.M., Behan M.Y. Measurement of Size Distribution of Blasted Rock Using Digital Image Processing. Journal of King Abdul-Aziz University Engineering Sciences. 2009. Vol. 20. Iss. 2, p. 81-93. DOI: 10.4197/Eng.20-2.4
- Sudhakar J., Adhikari G.R., Gupta R.N. Comparison of Fragmentation Measurements by Photographic and Image Analysis. Techniques Rock Mechanics and Rock Engineering. 2006. Vol. 39. Iss. 2, p. 159-168. DOI: 10.1007/s00603-005-0044-9
- Júlio de C.S., Andrêvhity da C.S., Suelen S.R. Analysis of Blasting Rocks Prediction and Rock Fragmentation Results Using Split-Desktop Software. Tecnologia em Metalurgia, Materiais e Mineração. 2018. Vol. 15. Iss. 1, p. 22-30. DOI: 10.4322/2176-1523.1234
- Tosun A. A modified WipFrag program for determining muckpile fragmentation. Journal of the Southern African Institute of Mining and Metallurgy. 2018. Vol. 118. N 10, p. 1113-1199. DOI: 10.17159/2411-9717/2018/v118n10a13
- Elahi AT., Hosseini M. Analysis of blasted rocks fragmentation using digital image processing (case study: limestone quarry of Abyek Cement Company). International Journal of Geo-Engineering. 2017. Vol. 8. N 16. DOI: 10.1186/ s40703-017-0053-z
- Menacer K., Hafsaoui A., Talhi K., Saadoun A. Study of the Influence Factorson Rock Blasting. Procedia Earth and Planetary Science. 2015. Vol. 15, p. 900-907. DOI: 10.1016/j.proeps.2015.08.143
- Shadabfar M., Gokdemir C., Zhou M. et al. Estimation of Damage Induced by Single-Hole Rock Blasting: A Review on Analytical, Numerical, and Experimental Solutions. Energies. 2021. Vol. 14. N 29, p. 1-24. DOI: 10.3390/en1 4010029
- Xiaohua Ding, Xiang Lu, Wei Zhou et al. Blasting Impact Simulation Test and Fragmentation Distribution Characteristics in an Open-Pit Mine. Shock and Vibration. 2019. Vol. 2019. N 4080274. DOI: 10.1155/2019/4080274
- Hu X., Qu S. A new approach for predicting bench blasting-induced ground vibrations: a case study. Journal of the Southern African Institute of Mining and Metallurgy. 2018. Vol. 118. N 5, p. 531-538. DOI: 10.17159/2411-9717/2018/v118n5a9
- Silva J.D., Amaya J.G., Basso F. Development of a predictive model of fragmentation using drilling and blasting data in open pit mining. Journal of the Southern African Institute of Mining and Metallurgy. 2017. Vol. 117. N 11. DOI: 10.17159/2411-9717/2017/v117n11a14
- Sereshki F., Hoseini S. M., Ataei M. Blast fragmentation analysis using image processing. International. Journal of Mining and Geo-Engineering. 2016. Vol. 50. N 2, p. 211-218. DOI: 10.22059/ijmge.2016.59831
- Jug J., Strelec S., Gazdek M., Kavur B. Fragment Size Distribution of Blasted Rock Mass. IOP Conference Series: Earth and Environmental Science. 2017. Vol. 95. N 042013. DOI: 10.1088/1755-1315/95/4/042013
- Cardu M., Coragliotto D., Oreste P. Analysis of predictor equations for determining the blast-induced vibration in rock blasting. International Journal of Mining Science and Technology. 2019. Vol. 29. Iss. 6, p. 905-915. DOI: 10.1016/j.ijmst.2019.02.009
- Karim Z., Hadji R., Et Hamed Y. GIS-based approaches for the landslide susceptibility prediction in Setif Region (NE Algeria). Geotechnical and Geological Engineering. 2019. Vol. 37, p. 359-374. DOI: 10.1007/s10706-018-0615-7
- Tamani F., Hadji R., Hamad A., Hamed Y. Integrating remotely sensed and GIS data for the detailed geological mapping in semi-arid regions: case of Youks les Bains Area, Tebessa Province, NE Algeria. Geotechnical and Geological Engineering. 2019. Vol. 37, p. 2903-2913. DOI: 10.1007/s10706-019-00807-2
- Zeqiri R.R., Riheb H., Karim Z. et al. Analysis of safety factor of security plates in the mine “Trepça” Stantërg. Mining Science. 2019. Vol. 26, p. 21-36. DOI: 10.37190/msc192602
- Leng Z., Fan Y., Gao Q., Hu Y. Evaluation and optimization of blasting approaches to reducing oversize boulders and toes in open-pit mine. International Journal of Mining Science and Technology. 2020. Vol. 30. Iss. 3, p. 373-380. DOI: 10.1016/j.ijmst.2020.03.010
- Baofu Duan, Hualin Xia, Xuxu Yang. Impacts of bench blasting vibration on the stability of the surrounding rock masses of roadways. Tunnelling Underground Space Technology. 2018. Vol. 71, p. 605-622. DOI: 10.1016/j.tust.2017.10.012
- Fredj M., Boukarm R., Saadoun A. et al. Distribution Analysis of Rock Fragments Size Based on the Digital Image Processing and the Kuz-Ram Model. Case of Jebel Medjounes Quarry. Aspects in Mining & Mineral Science. 2019. Vol. 2. Iss. 4. DOI: 10.31031/AMMS.2019.02.000545
- Zhang Z-X., Chi L-Y., Yi C. An empirical approach for predicting burden velocities in rock blasting. Journal of Rock Mechanics and Geotechnical Engineering. 2021. Vol. 13. Iss. 4, p. 767-773. DOI: 10.1016/j.jrmge.2021.04.004
- Mutinda E.K., Alunda B.O., Maina D.K., Kasomo R.M. Prediction of rock fragmentation using the Kuznetsov Cunningham-Ouchterlony model. Journal of the Southern African Institute of Mining and Metallurgy. 2021. Vol. 121. Iss. 3, p. 107-112. DOI: 10.17159/2411- 9717/1401/2021
- Lawal A.I. A new modification to the Kuz-Ram model using the fragment size predicted by image analysis. International Journal of Rock Mechanics and Mining Sciences. 2021. Vol. 138. Iss. 104595. DOI: 10.1016/j.ijrmms.2020.104595
- Ouchterlony F., Sanchidrián J.A. A review of development of better prediction equations for blast fragmentation. Journal of Rock Mechanics and Geotechnical Engineering. 2019. Vol. 11. Iss. 5, p. 1094-1109. DOI: 10.1016/j.jrmge.2019.03.001
- Maerz N.H., Palangio T.C., Franklin J.A. WipFrag image based granulometry system. Proceedings of the FRAGBLAST 5 Workshop on Measurement of Blast Fragmentation, Montreal, Quebec, Canada, 23-24 August 1996, p. 91-99. DOI: 10.1201/9780203747919-15
- Akbari M., Lashkaripour G., Yarahamdi B.A., Ghafoori M. Blastability evaluation for rock mass fragmentation in Iran central iron ore mines. International Journal of Mining Science and Technology. 2015. Vol. 25. Iss.1, p. 59-66. DOI: 10.1016/j.ijmst.2014.11.008
- Shehu S.A., Yusuf K.O., Hashim M.H.M. Comparative study of WipFrag image analysis and KuzRam empirical model in granite aggregate quarry and their application for blast fragmentation rating. Geomechanics and Geoengineering. 2020. Vol. 17. Iss. 1. DOI: 10.1080/17486025.2020.1720830
- Idowu K.A., Olaleye B.M., Saliu M.A. Application of Split-Desktop Image Analysis and Kuz- Ram Empirical Model for Evaluation of Blast Fragmentation Efficiency in a Typical Granite Quarry. Ghana Mining Journal. 2021 .Vol. 21. N 1, p. 45-52. DOI: 10.4314/gm.v21i1.5