
Application of resonance functions in estimating the parameters of interwell zones
- 1 — Ph.D. Associate Professor Ufa State Petroleum Technological University ▪ Orcid
- 2 — Ph.D., Dr.Sci. Professor Ufa State Petroleum Technological University
- 3 — Ph.D., Dr.Sci. Professor Ufa State Petroleum Technological University ▪ Orcid ▪ Elibrary ▪ Scopus ▪ ResearcherID
- 4 — Ph.D., Dr.Sci. Professor Ufa State Petroleum Technological University ▪ Orcid
- 5 — Ph.D. Associate Professor Branch of Ufa State Petroleum Technological University in Oktyabrskiy ▪ Orcid ▪ Elibrary ▪ Scopus ▪ ResearcherID

Abstract
It is shown that the use of force resonance leads to the effect of “shaking” the formation, followed by breaking up the film oil and involving it in the further filtration process. For the first time in oilfield geophysics, the concept of passive noise-metering method is justified for monitoring oil and gas deposit development by measuring the quality factor of the contours in the point areas of formation development channels in interwell zones. It is established that determining the depth of modulation for the reactive substitution parameter of the linear FDC chain is crucial not only for determining the parametric excitation in FDC attenuation systems, but also without attenuation in the metrological support for the analysis of petrophysical properties of rock samples from the wells. It is shown that based on the method of complex amplitudes (for formation pressure current, differential flow rates, impedance), different families of resonance curves can be plotted: displacement amplitudes (for differential flow rates on the piezocapacity of the studied formation section), velocities (amplitudes of formation pressure current) and accelerations (amplitudes of differential flow rates on the linear piezoinductivity of the FDC section). The use of predicted permeability and porosity properties of the reservoir with its continuous regulation leads to increased accuracy of isolation in each subsequent sub-cycle of new segment formation in the FDC trajectories, which contributes to a more complete development of productive hydrocarbon deposits and increases the reliability of prediction for development indicators.
None
Introduction
One of the most efficient formation stimulation methods is waterflooding of productive horizons [1-3]. However, the efficiency of this method is not high enough and in some cases it can be negative [4, 5], which reflects a wide variety of deposits by geological structure [6, 8]. In this regard, investigations have been conducted, which refer to the field of fluid mechanics of oil recovery with increased indices of productive formation recovery by contours of its operating objects volume, developed with artificial waterflooding [9-11]. At the same time, the oil recovery factor (ORF) of a formation is largely determined by reliability and accuracy of predicting its parameters [12-14]. The Fetkovich palette method [15] and its variants: Blassingeme, Agarwal – Gardner, NPI and others are the most acceptable for predicting [16-18]. They are based on geological and geophysical data on the results of investigations of flow rate and pressure in injection (IW) and production (PW) wells [19-21]. However, their inherent low metrological capabilities of current formation parameters prediction should be taken into account. All these methods by their measurement capabilities refer to the class of indicator methods, as their reduced errors exceed permissible values (δ > 10 %) both in steady-state and non-steady-state hydrocarbon recovery modes [22-24].
For this case, the problem of predicting formation permeability and porosity properties (PPP) under steady-state conditions is determinable. At the same time, the ORF for profitably operating fields is 0.35 [25-27]. In general, the essence of investigating the predictable parameters is to determine the parameters of wave resonances. Their most demonstrative results were obtained in electrical, acoustic and other types of systems with concentrated parameters of control objects. However, the technological processes of, for example, adjacent petrochemical industries, are difficult to implement.
For the first time, Russian scientists (A.G.Butkovsky, E.Ya.Rapoport and others) substantiated directions for research of systems with distributed parameters. However, their modelling results refer only to available measurements of parameters of zonal sections (segments) of control objects. Conditions for modelling of formation operation with spatially distributed coordinates on the basis of electromechanical and hydraulic analogies are significantly violated in non-stationary mode of oil extraction [28-30].
The problems aggravate when modelling the formation performance based on more advanced hyperbolic equations instead of the previously used parabolic equations [31-33]. This is particularly noticeable in the implementation of meta-technology of hard-to-recover hydrocarbons production (HRH), when the operation object is subjected to extreme regulation [4, 16, 34]. Thus, adequate results are obtained in dimensionless formation values when modelling and solving Cauchy problem due to implementation of HRH meta-technology. In this case, stability and quality conditions of fluid mechanics of oil recovery can be obtained in computational form based on the mathematical apparatus of wave resonance [35-37].
Based on mentioned conditions, the aim of the work is to increase reliability and accuracy of predicting the parameters of remote interwell formation zones with extreme regulation of the wave resonance function in the process of increasing the oil recovery factor.
Methodology
Achievement of the generalized aim for the most complete formation development is ensured by numerical modelling and solution of two types of problems. The first one implies the use of a hyperbolic type hydromechanics model of oil displacement [34] in modelling the chain structure based on the parameters of hydroresistivity Rh of the flow tube, piezoinductivity in piezoconductance (Lh ≡ F(η)) and piezocapacity (Сh ≡ F(σoil.res)) in oil saturation of the formation section, with the addition of average results for petrophysics in metrological support of previous and intermediate stages of oil and gas deposits development (ODD).
The solution of the second problem is connected with determining the parameters of remote interwell zones by applying the principle of autonomy, which was first realized by using a new meta-technology of HRH production [38-40]. The essence of its implementation consists in combining oil displacement, investigation and isolating modes of areas in the formation development channel (FDC) with fulfillment of conditions: Р od.min < Р od.r < Рod.max< Рinv < Рis < Рhydr. These values are shown in Fig.1 as formation pressure maintenance: Рinv - investigation; maximum Рod.max, rated Рod.r and minimum Рod.min values during oil displacement; Рhydr - the value of hydraulic fracturing pressure.
In epures E1 and E2 (Fig.1), isolation pressure Рis is not used conditionally, since it is applied only in operations of isolation of worn-out FDC sections with a value less than hydraulic fracturing pressure. The investigation pressure Рinv is selected for the hard mode of formation operation, the elastic mode of which is used as the oil displacement mode.
The upper epure E1 shows conditionally the operation of estimated delivery time τrinvi for portion of tracer markers under formation pressure Рinv to the estimated point i (i=¯1,n‾) in controlled area of interwell zone. After that, a transition to oil displacement mode under pressure Р od.r is made at calculated time τrod i.
Epure E2 shows the practical results of point i investigation in the FDC over time τprinvi and delay τdel during transient formation. At the completion of tracer markers delivery to a FDC given point from booster pumping equipment in surface conditions the formation pressure maintenance is reduced from Рinv to Рod.r.
Series of points 1, 2, 3 and 4 are formed at the tops of the transient processes under formation conditions (from the IW near-bottomhole zone side). This reflects the dynamics of the practical result for evolutionary development of the single i fluctuation Fpri at pressures with maximum five-point and minimum six-point values of amplitude. After formation of the transient process in the hard formation mode (between Рinv and Рop.max), the fluctuation Fpri is firstly produced with its further transition to the elastic mode, as depicted in the example of attenuation of the amplitudes to the minimum defined point 6.
Fig.1. Time diagrams of transient processes in FDC
Each fluctuation Fpri is characterized by different lengths (or slope) of forward (ascending branch) and back (descending branch) fronts of transient processes during current prediction of residual oil saturation σoil.res and piezoconductance η linear values [15, 29, 41]. In terms of hydraulic shock theory, such localization of fronts of each fluctuation is characterized as amplitude of pulsations smoothing (“slumping”) in the disturbed interwell FDC area at continuous changes. All this causes determination of variable parameters of the FDC trajectories in the form of linear hydraulic resistance Rh, piezoinductivity Lh and piezocapacity Сh.
If the current parameters of steady-state investigation τrinvi and oil displacement τrod i processes can be predicted in the solutions of hyperbolic equations according to the chain FDC scheme, then in non-steady-state transient processes of the formation additional parameters can be predicted according to the localized autonomous oscillator scheme.
From the point of view of electrohydromechanical analogies, the method of complex amplitudes is the most appropriate for this research problem. The equation of motion for the oscillator can be expressed as:
where P – pressure in the tube of current lines at the developed formation; ℘ – the difference in potential fluid flow rates between the injection and production wells; ω¯ – frequency of the excitable oscillations.
When solving equation (1) by the method of complex amplitudes (for pressure in FDC current tube Р = Ре jω¯t), we obtain Р =℘ /Z, Zh = Rh + j(ω¯Lh - 1/ω¯Ch), which is complex resistance of oscillator on line FDC section. For formation pressure modulus in formation current tube will be:
To find the maximum formation pressure in the current tube of the formation, the condition Р0max = ℘/R must be met when ω¯Lh= 1/ω¯Ch (at ω¯ = ω0)
Based on the conditions obtained, normalized resonance curves for formation pressure can be found in the form of a functional:
where P0max – maximum formation pressure; θ0 = ω0L/R – quality factor of the resonant circuit; γ = ω¯/ω0 – coefficient of resonant frequencies in the ratio of the forced circular frequency ω¯ to the natural ω0 frequency of the resonant circuit (oscillator) of the investigated area in the remote FDC zone.
Figure 2 shows series of normalized resonance curves for the formation pressure in the linear current tube of the FDC when their quality factors θ0 = 1; 2; 10 are depicted.
Resonance of the flow rate drops as tension on the piezocapacity θ0℘ is obtained at a lower natural frequency ω0 with respect to the circular frequency ω¯. This is achieved under (2) at γ2=1-1/2θ20. In contrast, the flow rate drops as tension on the piezocapacity θ0℘ are obtained at a higher natural frequency ω0 with respect to the circular frequency ω¯ at γ2=1-1/2θ20 .
Presented resonance curves correspond to the results of investigations on deteriorated areas in the remote zone of the formation. Therefore, they are obtained with unambiguous symmetry of resonances for an oscillator with the following parameters: Lh = const; Ch = const; Rh = const; and only the values of the frequencies of excited oscillations are variable (ω¯ = var).
Fig.2. Interpretation of normalized resonance curves for different quality factors of autonomous FDC oscillators
It is of practical interest to determine resonance dependencies when one of the energy-consuming linear parameters of piezocapacity or piezoinductivity in the investigated FDC segment changes: Lh = var (or Ch = var) at P = const. For example, determining the parameters at the critical point of the investigated FDC area by calculating the values of piezoconductance. In this case, normalized resonance curves in the form of current functional for formation pressure when changing natural frequency of the circuit can be found in analogy (2):
where θ0 = ω¯Lh/Rh – quality factor of a resonant circuit at a constant forced oscillation frequency ω¯.
Figure 3 shows the family of resonance curves at changing of natural frequency of autonomous FDC oscillators for quality factors θ0 = 1; 3; 10. Thus, changing of one of reactive resistances (Lh) leads to changing of natural frequency of oscillator ω0.
This problem is considered in terms of the sensitivity threshold for optimal oil recovery. The solution to this problem is to a large extent reduced to the study of parametric resonance of remote areas in the interwell zones. At the same time,
theory of oscillations considers the modulation depth of piezocapacity Ch or piezoinductivity Lh as the basic calculation values for this case.
By analogy with electrical oscillation systems, the depth of modulation for the piezocapa-city as a function of residual oil saturation can be defined as:
and the depth of modulation for the piezoinductivity as a function of the piezoconductance of the controlled remote area of the formation can be expressed as:
where the increment of piezocapacity ΔCh (or piezoinductivity ΔLh) is many times less than its no-minal value ΔCh << C0h (or ΔLh << L0h).
If the energy input exceeds the losses, then there is an increase in the system oscillation:
where d – logarithmic decrement of oscillation attenuation in the circuit.
In general, the description of parametric resonance for all systems is done using a differential equation in variable states, a particular form of which is the Mathieu equation:
where ₰ – changes (in the second derivative) of the system state to characterize it in the phase plane; ω02 – squared values of the resonance frequency of the system; m – the depth of modulation for the resulting parametric resonance. In this case, the solution of the Mathieu equation (7) is reduced to determining not only the modulation depth m, but also the value regions of the frequency ratio 2ω0/ω¯.
Russian scientists A.A.Andronov and M.A.Leontovich calculated these ranges of values for systems without attenuation (necessary for determining the petrophysical properties of the rock sample) and with attenuation (providing for determination of FDC linear PPP) based on the following equations:
The results of the calculations can be explained in the form of graphs (Fig.4), which show that the tops of the parametric instability regions rise in the presence of losses in the system. In the case of a conservative system, there is a non-attenuated complex process outside these regions, and in the case of a dissipative system there is a attenuated oscillation process. At the boundary of these regions a balance of energy is observed.
Fig.3. Family of resonance curves at changing of natural frequency of autonomous FDC oscillators for quality factors 1; 3; 10
Fig.4. Areas of parametric excitation of autonomous FDC oscillators for the system without attenuation (a) and with attenuation (b)
In the same regions the width of the instability region is smaller for dissipative than for conservative oscillatory system. As the number of the instability region increases, due to a rarer energy input into the system (ω¯ = 2ω/n at n = 1, 2, 3…) to obtain the same width of the excitation region one must increase the modulation depth of the reactive parameter m.
Thus, the obtained values of parametric excitation without attenuation (Fig.4, a) can serve as a basis for petrophysical determination of wave properties for rock samples parameters at metrological support of investigations, and with attenuation for determining parameters of the studied FDC segments. Combined use of force and parametric resonance methods provides reliable prediction of parameters for separate regions of interwell distant zones.
Discussion of the results
In the late stages of ODD, formation ORF values are conditioned by a small increase [42, 43]. Therefore, for oscillators at different points I in FDC between IW and PW, linear parameters Rh ≃ const and Ch ≃ const. The depleted regions of the interwell zones are characterized by variable values of piezoconductance, i.e. the linear piezoinductivity Lh ≃ var.
Figure 5 shows E1 and E2 epures of the results for interwell investigations in spatial formation geometry (E1) and the determination of piezoconductance values (E2).
The basis of instrumentation for the considered investigations is a complex well equipment installed in the intervals of IW and PW perforation. It consists of well pressure, temperature, flow rate and watercut transducers together with passive noise-metering and gamma equipment for tracer mar-kers control.
As a result of the FDC parameters investigation using quality factor diagrams (see Fig.2, 3), the deteriorated areas of the interwell zones are determined based on the force resonance techniques with identification of areas A, B and C.
When the formation is investigated in the later stages of deposit development, spatial and temporal coordinates are determined in parametric resonance to determine the isolation points of the FDC segments by determining their piezoconductance. As a result, regions of different piezoconductance are identified on the E2 epure to determine further isolation operations of the segments in the functioning trajectories of the l FDC.
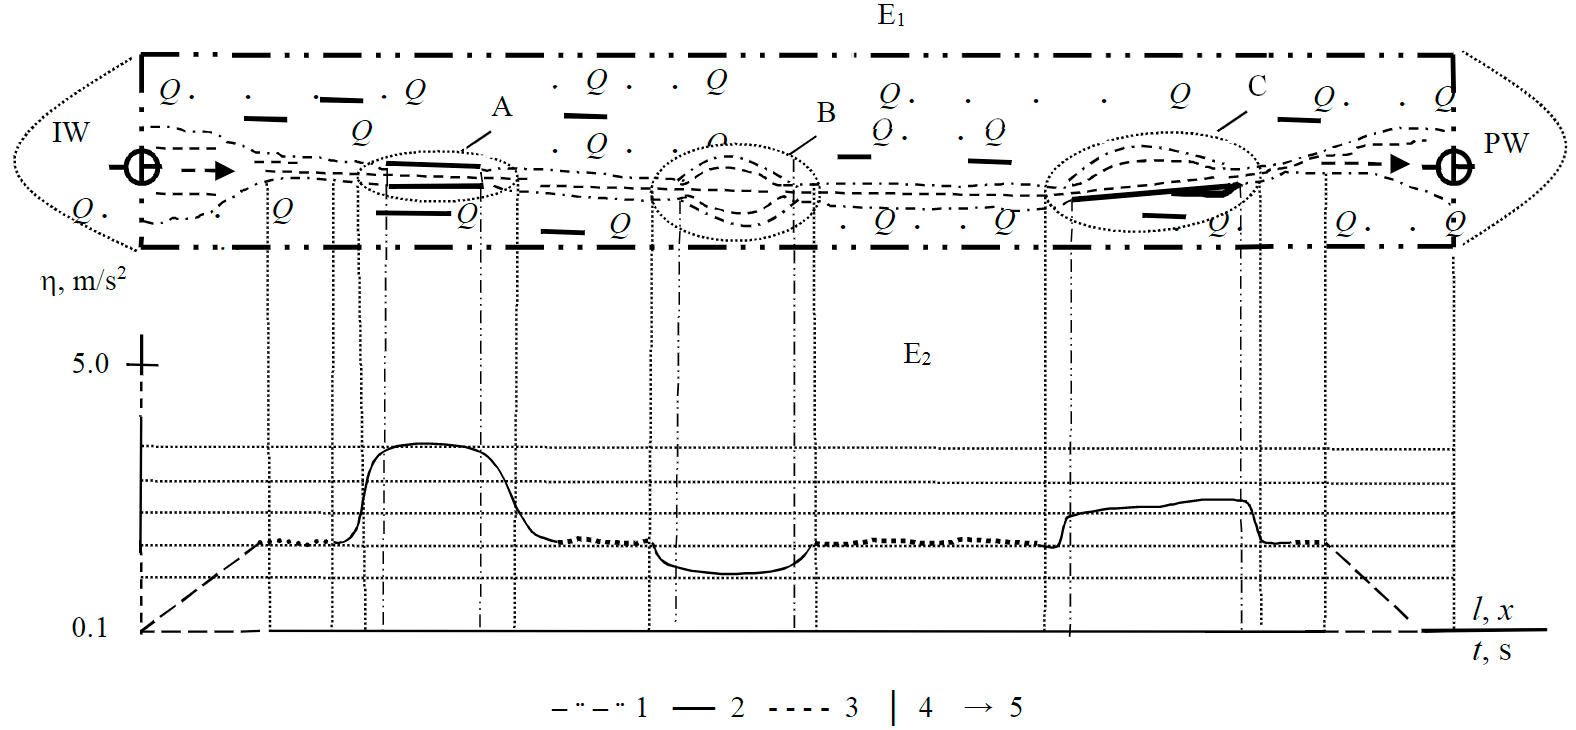
Fig.5. Epures of results for the investigations of interwell zones (Q – residual oil saturation) 1 – production object contour; 2 – carbonate inclusions; 3 – working agent (water) phase; 4 – sandstone rock; 5 – fluid flow direction
Conclusion
The use of force resonance leads to the effect of “shaking” the formation, followed by breaking up the film oil and involving it in the further filtration process. This necessitates control of quality factor in the point area of the remote FDC zone when excited, as well as additional implementation of parametric resonance conditions.
For the first time in oilfield geophysics, the concept of passive noise-metering method is justified for monitoring ODD by measuring the quality factor of the contours in the point areas of interwell zones. Application of measurements for slowly changing amplitude-frequency spectrum during the “slumping” of the resonance region in the study area is also justified for the first time.
Parametric excitation of oscillations in the controlled FDC region is possible only by changing one of the energy-intensive linear parameters of piezocapacity Ch as a function of oil saturation or piezoinductivity Lh as a function of piezoconductance with terrigenous, clay and carbonate rocks of productive formations.
Determining the depth of modulation for the reactive substitution parameter of the linear FDC chain is crucial not only for determining the parametric excitation in FDC attenuation systems, but also without attenuation in the metrological support for the analysis of petrophysical properties of rock samples.
Based on the method of complex amplitudes (for formation pressure current, differential flow rates, impedance), different families of resonance curves can be plotted: displacement amplitudes (for differential flow rates on the piezocapacity of the studied formation section), velocities (amplitudes of formation pressure current) and accelerations (amplitudes of differential flow rates on the linear piezoinductivity of the FDC section).
References
- Sergeev V.L., Dong Van Hoang, Khagay D.E., Ignatenko A.V. Diagnostic Criteria for Identification of Filtration Flows during Horizontal Well Tests. Bulletin of the Tomsk Polytechnic University. Geo Assets Engineering. Vol. 331. N 2, p. 181-187 (in Russian). DOI: 10.18799/24131830/2020/2/2504
- Mukhametshin V.V., Kuleshova L.S. On Uncertainty Level Reductionin Managing Waterflooding of the Deposits with Hard yo Extract Reserves. Bulletin of the Tomsk Polytechnic University. Geo Assets Engineering. 2020. Vol. 331. N 5, p. 140-146 (in Russian). DOI: 10.18799/24131830/2020/5/2644
- Yartiev A.F., Khakimzyanov I.N., Petrov V.N., Idiyatullina Z.S. Improving the technologies for developing oil reserves from heterogeneous and complex reservoirs in the Republic of Tatarstan. Kazan: Ikhlas, 2016, p. 191 (in Russian).
- Kurbanova G.Ya., Guseva D.N. The application of hydrodynamic impact methods to optimize the development system at various stages of waterflooding. Neft'. Gaz. Novatsii. 2015. N 12, p. 76-79 (in Russian).
- Van Thang Nguyen, Rogachev M.K., Aleksandrov A.N. A new approach to improving efficiency of gas-lift wells in the conditions of the formation of organic wax deposits in the dragon field. Journal of Petroleum Exploration and Production Technology. 2020. Vol. 10. Iss. 8, p. 663-3672. DOI: 10.1007/s13202-020-00976-4
- Mukhametshin V.S., Khakimzyanov I.N. Features of grouping low-producing oil deposits in carbonate reservoirs for the rational use of resources within the Ural-Volga region. Journal of Mining Institute. 2021. Vol. 252, p. 896-907. DOI: 10.31897/PMI.2021.6.11
- Krivoshchekov S.N., Kochnev A.A., Ravelev K.A. Development of an algorithm for determining the technological parameters of acid composition injection during treatment of the near-bottomhole zone, taking into account economic efficiency. Journal of Mining Institute. 2021. Vol. 250, p. 587-595. DOI: 10.31897/PMI.2021.4.12
- Dvoynikov M.V., Kuchin V.N., Mintzaev M.S. Development of viscoelastic systems and technologies for isolating water-bearing horizons with abnormal formation pressures during oil and gas wells drilling. Journal of Mining Institute. 2021. Vol. 247, p. 57-65. DOI: 10.31897/PMI.2021.1.7
- Aziz K., Settari A. Petroleum Reservoir Simulation. Calgary, Alberta: Blitzprinr Lod., 2002, p. 477.
- Tongwen Jiang, Wei Yao, Xiongwei Sun et al. Evalution of anisotropic permeability of fractured sandstones subjected to true-triaxial stresses during reservoir depletion. Journal of Petroleum Science and Engineering. 2020. Vol. 200. N 108251.DOI: 10.1016/j.petrol.2020.108251
- Izotova V., Petrov D., Pankratova K., Pospehov G. Research of acoustic characteristics and physical and mechanical properties of quaternary soils. Engineering and Mining Geophysics. Conference Proceedings. 2020. Vol. 2020, p. 1-7.DOI: 10.3997/2214-4609.202051130
- Rogachev M.K., Mukhametshin V.V., Kuleshova L.S. Improving the efficiency of using resource base of liquid hydrocarbons in Jurassic deposits of Western Siberia. Journal of Mining Institute. 2019. Vol. 240, p. 711-715. DOI: 10.31897/PMI.2019.6.711
- Mukhametshin V.V., Kuleshova L.S. Justification of Low-Productive Oil Deposits Flooding Systems in the Conditions of Limited Information Amount. SOCAR Procеedings. 2019. N 2, p. 16-22. DOI: 10.5510/OGP20190200384
- Kashnikov Y.A., Ashikhmin S.G., Kukhtinskii A.E., Shustov D.V. The relationship of fracture toughness coefficients and geophysical characteristics of rocks of hydrocarbon deposits. Journal of Mining Institute. 2020. Vol. 241, p. 83-90. DOI: 10.31897/PMI.2020.1.83
- Fetkovich M.J., Vienot M.E., Bradley M.D., Kiesov U.G. Decline Curve Analysis Using Type Curves – Case Histories. SPE Form Evaluation. 1987. Vol. 2. Iss. 4, p. 637-656. DOI: 10.2118/13169-PA
- Blassingeme T.A., Johnston J.L., Lee W.J. Type-Curve Analysis Using the Pressure Integral Method. SPE California Regional Meeting held, 5-7 April 1989, Hakerafieidi California. SPE 18799, p. 525-543. DOI: 10.2118/18799-MS
- Mardashov D.V. Development of blocking compositions with a bridging agent for oil well killing in conditions of abnormally low formation pressure and carbonate reservoir rocks. Journal of Mining Institute. 2021. Vol. 251, p. 617-626. DOI: 10.31897/PMI.2021.5.6
- Mardashov D.V., Rogachev M.K., Zeigman Yu.V., Mukhametshin V.V. Well Killing Technology before Workover Operation in Complicated Conditions. Energies. 2021. Vol. 14. Iss. 3. N 654. DOI: 10.3390/en14030654
- Zakharov L.А., Martyushev D.А., Ponomareva I.N. Predicting dynamic formation pressure using artificial intelligence methods. Journal of Mining Institute. 2022. Vol. 253, p. 23-32. DOI: 10.31897/PMI.2022.11
- Dvoynikov M.V., Budovskaya M.E. Development of a hydrocarbon completion system for wells with low bottomhole temperatures for conditions of oil and gas fields in Eastern Siberia. Journal of Mining Institute. 2022. Vol. 253, p. 12-22. DOI: 10.31897/PMI.2022.4
- Grigorev G.S., Salishchev M.V., Senchina N.P. On the applicability of electromagnetic monitoring of hydraulic fracturing. Journal of Mining Institute. 2021. Vol. 250, p. 492-500. DOI: 10.31897/PMI.2021.4.2
- Elesin A.V., Kadyrova A.Sh., Nikiforov A.I. Definition of the reservoir permeability field according to pressure measurements on wells with the use of spline function. Georesursy. 2018. Vol. 20. N 2, p. 102-107. DOI: 10.18599/grs.2018.2.102-107
- Kozyrev N.D., Vishnyakov A.Yu., Putilov I.S. Assessment of the Uncertainty Parameters Influence on the Development Indicators Forecasting. Perm Journal of Petroleum and Mining Engineering. 2020. Vol. 20. N 4, p. 356-268 (in Russian). DOI: 10.15593/2712-8008/2020.4.5
- Prischepa O.M., Borovikov I.S., Nefedov Y.V. et al. Modeling of conditions for the formation of hydrocarbon accumulation zones in the northwestern regions of the timan-pechora basin. Geomodel 2021 – 23th Conference on Oil and Gas Geological Exploration and Development, 6-10 September 2021, Gelendzhik, Russia. European Association of Geoscientists & Engineers, 2021. Vol. 2021, p. 1-5. DOI: 10.3997/2214-4609.202157097
- Andreev A.V., Mukhametshin V.Sh., Kotenev Yu.A. Predicting the productivity of deposits in carbonate reservoirs with hard-to-recover reserves. Nauchnye trudy NIPI Neftegaz GNKAR. 2016. N 3, p. 40-45 (in Russian). DOI: 10.5510/OGP20160300287
- Mason H.E., Smith M.M., Carroll S.A. Calibration of NMR porosity to estimate permeability in carbonate reservoirs. International Journal of Greenhouse Gas Control. 2019. Vol. 87, p. 19-26. DOI: 10.1016/j.ijggc.2019.05.008
- Decheng Zhang, Ranjith P.G., Perera M.S.A., Zhang C.P. Influences of test method and loading history on permeability of tight reservoir rocks. Energy. 2020. Vol. 195. N 116902. DOI: 10.1016/j.energy.2020.116902
- Cholovskiy I.P., Ivanova M.M., Bragin Yu.I. Oil and gas field geology of hydrocarbon deposits. Moscow: Al'yans, 2015, p. 680 (in Russian).
- Rabaev R.U., Chibisov A.V., Kotenev A.Yu. Mathematical Modelling of Carbonate Reservoir Dissolution and Prediction of the Controlled Hydrochloric Acid Treatment Efficiency. SOCAR Proceedings. 2021. N 2, p. 40-46. DOI: 10.5510/OGP20210200494
- Khakimzyanov I.N., Mukhametshin V.Sh., Bakhtizin R.N., Sheshdirov R.I. Determination of Well Spacing Volumetric Factor for Assessment of Final Oil Recovery in Reservoirs Developed By Horizontal Wells. SOCAR Procеedings. 2021. N 2, p. 47-53. DOI: 10.5510/OGP20210200495
- Crichlow H.B. Modern reservoir engineering – a simulation approach. New Jersey: Prentice-Hall Inc., 1977, p. 354.
- Yermekov R.I., Merkulov V.P., Chernova O.S., Korovin M.O. Features of permeability anisotropy accounting in the hydrodynamic model. Journal of Mining Institute. 2020. Vol. 243, p. 299-304. DOI: 10.31897/PMI.2020.3.299
- Batalov S.A., Andreev V.E., Lobankov V.M., Mukhametshin V.Sh. Numerical simulation of oil formation with regulated disturbances. Oil recovery quality simulation. Journal of Physics: Conference Series. 2019. Vol. 1333. Iss. 3. N 032006. DOI: 10.1088/1742-6596/1333/3/032006
- Batalov S.A. Modeling of the Initial Parameters in the Adjustment of an Oil Recovery Process Control System. Part 2. Determination of Limits on the Vectors of the State Variables and Disturbances. Chemical and Petroleum Engineering. Vol. 52. Iss. 7, p. 452-459. DOI: 10.1007/s10556-016-0213-6
- Butikov E.I. Parametric resonance. Komp'yuternye instrumenty v obrazovanii. 2009. N 3, p. 18-36 (in Russian).
- Zejgman J.V., Mukhametshin V.Sh., Khafizov A.R., Kharina S.B. Prospects of Application of Multi-Functional Well Killing Fluids in Carbonate Reservoirs. SOCAR Procеedings. 2016. N 3, p. 33-39 (In Russian) DOI: 10.5510/OGP20160300286
- Kochetkov A.V., Fattakhov I.G., Mukhametshin V.V. et al. Mathematical model of linear and non-linear proppant concentration increase during hydraulic fracturing – a solution for sequential injection of a number of proppant types. Journal of Mining Institute. 2022. Vol. 254, p. 210-216. DOI: 10.31897/PMI.2022.10
- Yakupov R.F., Mukhametshin V.Sh., Khakimzyanov I.N., Trofimov V.E. Optimization of reserve production from water oil zones of D3ps horizon of Shkapovsky oil field by means of horizontal wells. Georesursy. 2019. Vol. 21. N 3, p. 55-61. DOI: 10.18599/grs.2019.3.55-61
- Davydova A.E., Shchurenko A.A., Dadakin N.M. Optimization of Carbonate Reservoir Well Testing. Perm Journal of Petroleum and Mining Engineering. 2018. Vol. 17. N 2, p. 123-135 (in Russian). DOI: 10.15593/2224-9923/2018.2.3
- Pippard A. The physics of vibration. England, Cambridge: Cambridge university press, 1989, p. 263.
- Korotenko V.A., Grachev S.I., Kushakova N.P., Mulyavin S.F. Assessment of the Influence of Water Saturation and Capillary Pressure Gradients on Size Formation of Two-Phase Filtration Zone in Compressed Low-Permeable Reservoir. Journal of Mining Institute. 2020. Vol. 245, p. 569-581. DOI: 10.31897/PMI.2020.5.9
- Mukhametshin V.V. Oil Production Facilities Management Improving Using the Analogy Method. SOCAR Proceedings. 2020. N 4, p. 42-50 (in Russian). DOI: 10.5510/OGP20200400464
- Yakupov R.F., Mukhametshin V.Sh., Tyncherov K.T. Filtration model of oil coning in a bottom water-drive reservoir. Periodico Tche Quimica. 2018. Vol. 15. Iss. 30, p. 725-733.