Analysis of project organization specifics in small-scale LNG production
- 1 — Ph.D. Saint petersburg Mining University Saint Petersburg Mining University ▪ Orcid ▪ Elibrary ▪ Scopus ▪ ResearcherID
- 2 — Dr.Habil. Director Luzin Institute for Economic Studies, Kola Science Center of the Russian Academy of Sciences

Abstract
Gas industry plays an important role in the global energy sector, and in the coming decades amountsof natural gas production will only increase. One of the fastest growing trends in gas industry is the production of liquefiednatural gas (LNG), which is associated with the necessity to organize flexible systems of gas supply to the regions,remote from gas extraction sites. Industrial structure of LNG production includes projects, belonging to several different groups depending to their scale, in particular, small-scale production (SSLNG), cumulative production capacityof which is approximately 10 % from the industry-wide one. Economic aspects of implementing such projects remainunderexplored, which does not allow to draw objective conclusions regarding the prospects of their implementationin particular regions.This paper contains a review of publications, devoted to SSLNG project studies, aimed at identifying specifics oftheir organization compared to projects of greater scale. The results demonstrate that the majority of internationalcompanies classify projects as SSLNG, if their annual production capacity is below 0.5 million tonnes per annum.Specific capital costs, as well as implementation timelines of such projects, are several times lower than those of projects with greater production capacity, which reduces their risks and minimizes barriers to market entry. Furthermore,SSLNG is the most decentralized subsector in gas industry, aiming to cover the market due to a growing numberof projects, not their specific production capacity. These specific features define significant prospects of SSLNGdevelopment in Russia, both in the context of energy supply to remote regions and diversification of export deliveries.
None
Introduction. Presently there are numerous alternative scenarios of energy development, both in particular countries and worldwide [19, 25]. Practically in all of these scenarios the share of natural gas in the global energy mix is expected to increase [26], which is explained by its environmental and economic characteristics [34, 44], as well as by significant abundance of its reserves in different regions of the world (Table 1); in the last decade their increment reached 0.2 billion m3 (from 1.7 to 1.9 billion m3).
Table 1
Geographical distribution of proven reserves of fuel and energy resources by the end of 2018 [13]
| Resource | North America | South and Central America |
Europe | CIS countries | Middle East and Africa |
Asia Pacific | Total |
| Oil, billion t | 35,4 | 51,1 | 1,9 | 19,6 | 129,8 | 6,3 | 244,1 |
| Natural gas, billion m3 | 13,9 | 8,2 | 3,9 | 62,8 | 89,9 | 18,1 | 196,9 |
| Coal, billion t | 258 | 14 | 134,6 | 188,6 | 14,4 | 444,9 | 1054,8 |
One of the fastest growing trends in gas industry is the production of liquefied natural gas (LNG) (Fig.1). This is explained by the flexibility of logistic schemes [21], which can be developed on its basis and, in particular, by the possibility of its delivery to the points of consumption, remote from gas production regions [38, 50].
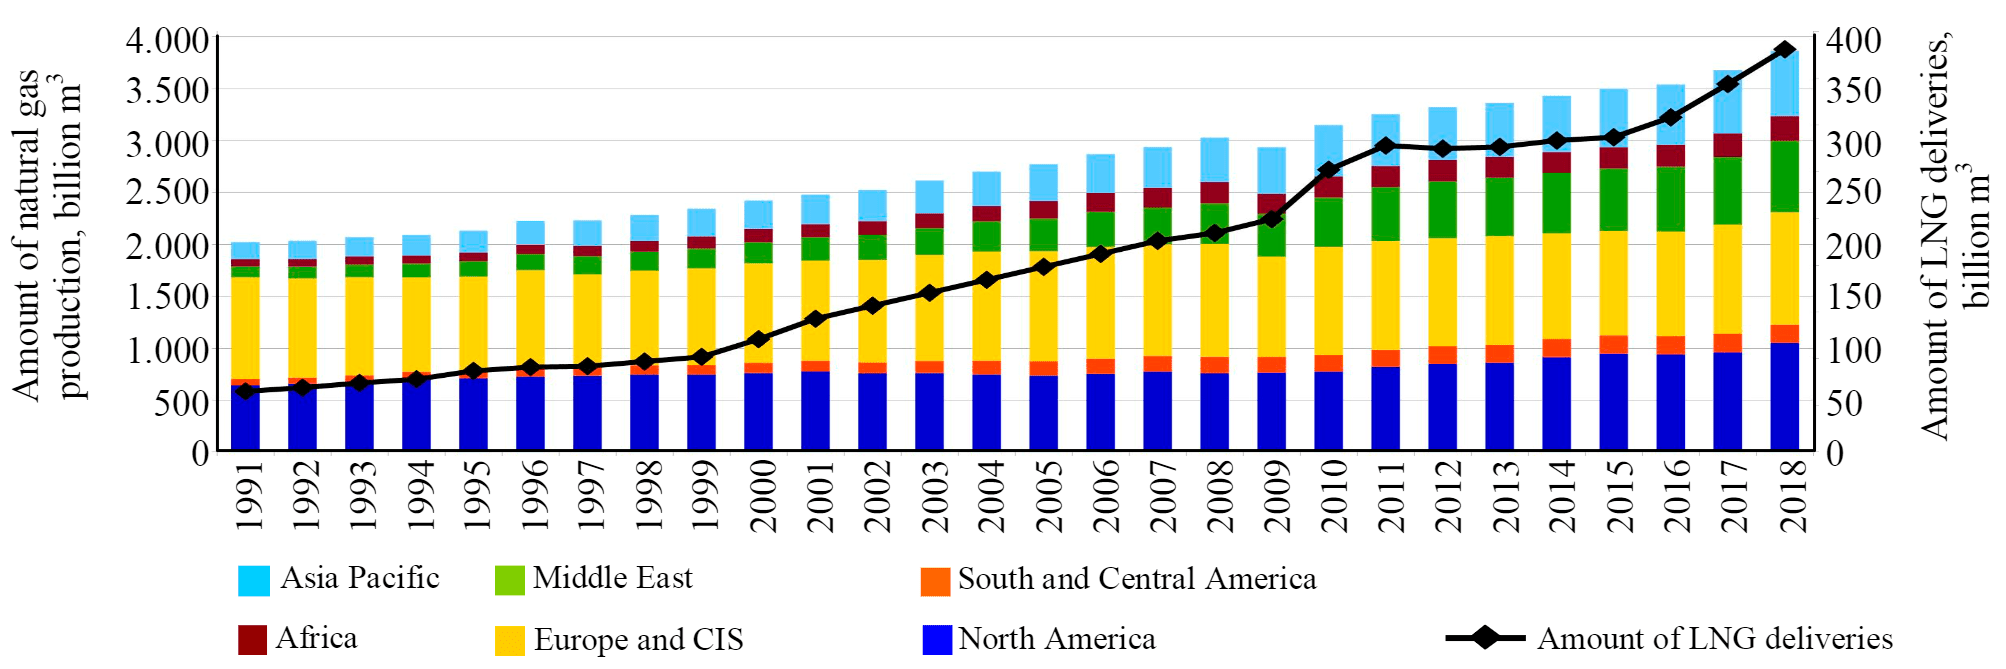
Over the course of 28 years, amounts of natural gas production doubled (from 2,026.8 billion m3 in 1991 to 3,867.9 billion m3 in 2018). The highest growth rates are accounted for by the countries in the Middle East (658.3 %), Africa (329.1 %) and Asia Pacific (385.4 %). At the same time, the average annual growth rate of LNG sector (23.68 %) is much higher than the growth rate of natural gas production as a whole (6.8 %), which is associated with active expansion of LNG supply geography in the years 2001-2018 [37].
In the course of extensive production development, industrial structure of LNG was divided into segments according to production capacities of such projects: small-scale (SS), mid-scale (MS) and large-scale (LS) ones. Regardless of common performance principles, technologies [41, 42], the methods and goals of organizing such production facilities differ from each other [5, 48]. Moreover, the state of knowledge on economic aspects of performance varies significantly for the projects of different scale.
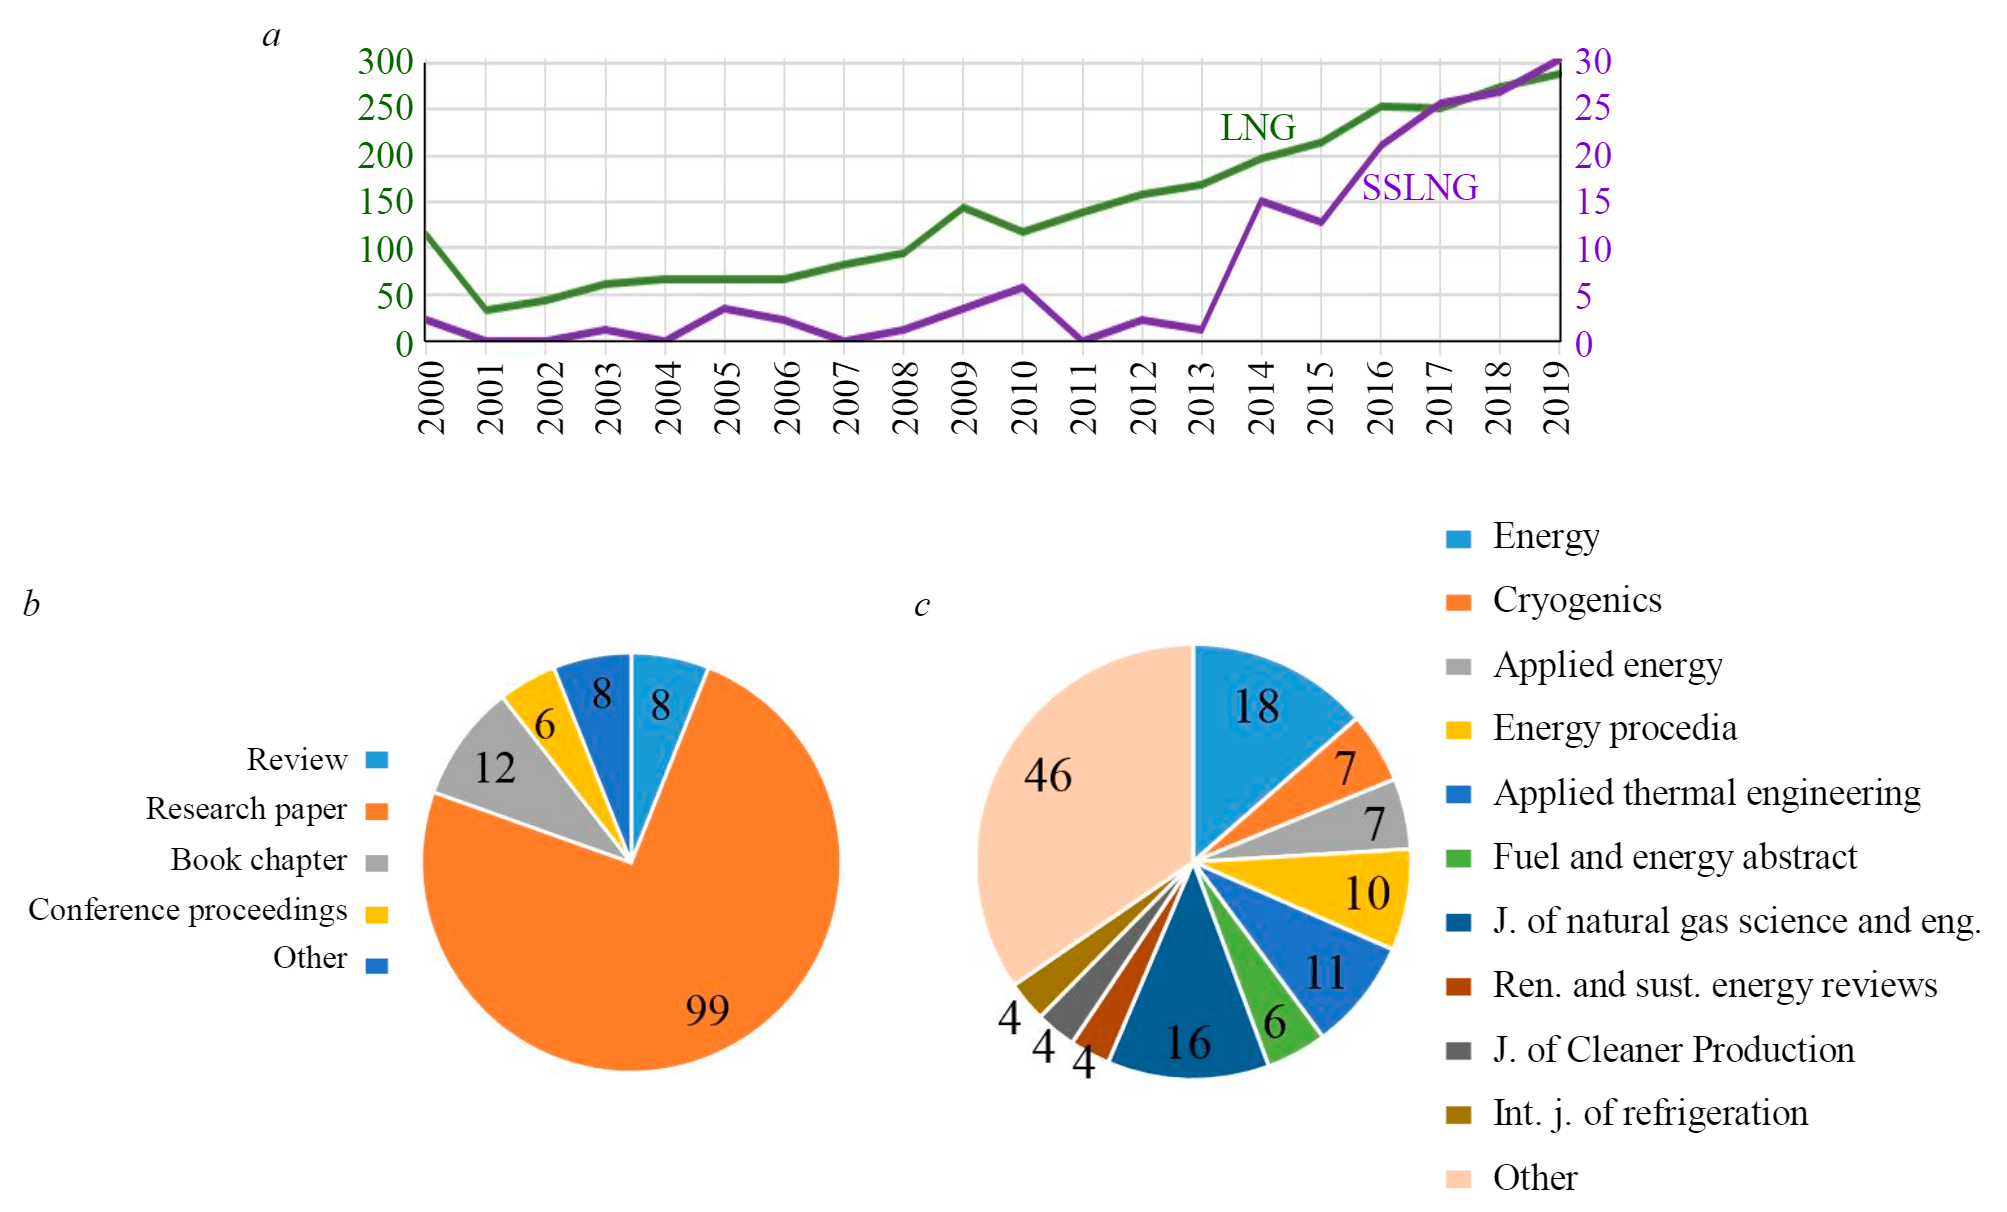
Problem Statement. In the global literature, there is a large number of publications devoted to LNG studies [33]. However, as shown by the analysis of sciencedirect.com database, only a minor fraction of those aim at studying SSLNG. The search for relevant papers was carried out using two fields: “Title, abstract or author-specified keywords” for the term “LNG” and “Find articles with these terms” for “small scale LNG”. The use of different fields is explained by the presence of the term “LNG” in a large number of publications (over 30 thousand), devoted, among other things, to general energy issues (when using the field “Find articles with these terms” in the search).
Analysis demonstrated that more than 2,800 papers were devoted to LNG sector, and SSLNG accounted for only 133 of them (Fig.2). One of the reasons behind the lack of attention to such projects from the scientific community, politicians and public is their small production capacities, because of which they are simply left unnoticed in the presence of large-scale projects [27]. However, their increasing significance is obvious, as evidenced by the rapid growth of publications in this field in 2014-2019 (85 % from the total number of publications).
Increased attention to SSLNG is largely associated with the growing necessity to organize flexible decentralized systems of energy supply [43], required, in particular, for the development of remote territories (e.g., Arctic regions) [14, 31], which have no access to the main gas pipeline. Environmental issues also played an important role, for instance, the general trend of reducing carbon intensity of transport fuel [22], including tightening of requirements for sulphur content in the marine fuel [28, 51].
Despite the growing number of publications in the last five years, it can be stated that for a significant number of development problems in the SSLNG sector no solution has been found so far [15]. This is also true for economic problems, as the majority of existing research papers are written in the field of engineering sciences [24] and do not address organization specifics of such projects. The main goal of this study is to analyze organization specifics of SSLNG production and supply chains (PSCs), which, according to Linde Group estimates [39] account for around 10 % of the global LNG production
Methodology. This study presents results of analysis on organization specifics of SSLNG projects. The analysis was carried out in several stages:
1. One of the paramount questions in the analysis of SSLNG PSCs is the estimation of their threshold production capacity; it is this factor that defines organization specifics of such projects and the state of their coverage in the global literature. There is no unified approach to estimating production capacity boundaries of LNG projects in order to classify them according to their scale; in the global literature there are such terms as “small-to-mid scale” and “mid-to-large scale”, which create even more ambiguity. The paper presents a comparative analysis of standpoints of the researchers and international companies on this issue to enable clear definition of production capacities for SSLNG projects.
2. Basing on the study of analytics, international company reviews and research papers, the boundaries and contents of intermediate PSC stages were identified for each scale group of LNG projects. Authors held the position that the starting point of these chains was delivery of natural gas to the liquefaction plant, and the endpoint was either regasification process or consumption of nonregasified LNG by the end user. A theoretically allowable situation, when LNG is regasified and after some time repeatedly gasified, is considered as a combination of several supply chains.
3. In the global literature there is practically no statistical information on the economic characteristics of SSLNG projects. Within the scope of this study, authors generalized and compared open access data on the costs of the end product, obtained in SSLNG projects, which was either electric energy or energy, expressed in British thermal units.
Moreover, a brief characteristic of the most developed SSLNG markets was provided, along with the main directions of SSLNG use and growth prospects of product markets, which allowed to make a conclusion about the relevance and development prospects of such projects in Russia.
Results and discussion. Production capacity estimation for SSLNG projects. Up to the present day, there is no generally accepted grading of production capacities; however, some standpoints of large international companies can be distinguished (Table 2). The list of intervals, presented in the Table, can be non-exhaustive, but it includes the standpoints of the largest international companies, the operations of which are directly associated with LNG sector.
Table 2
Approaches to estimating the interval of SSLNG production capacity
| Company | Interval of SSLNG production capacity, Mtpa |
| International Gas Union [29] Asia-Pacific Economic Cooperation [49] Chiyoda corporation [16] |
Up to 1 |
| TGE Gas Engineering [53] Linde [39] Gazprom Export [40] |
Up to 0,5 |
| PetroChina Natural Gas Marketing [56] | 0,1-0,5 |
| World Bank Group [41] Energy Resources Group [7] GOST R 55892-2013* GEA engineering [20] |
Below 0,2 - micro LNG; 0,2-1,0 - SSLNG 0,02-0,7 0,08-0,085 (below 10 t/h) 0,01-0,3 |
*GOST R 55892-2013. Objects of low-tonnage liquefied natural gas production and consumption. General technical requirements. Мoscow: Standartinform, 2019.
Superficial consideration implies that the most accepted standpoint is LNG production capacity up to 1 million tonnes per annum (Mtpa). However, it should be noted that a certain share of the companies rely on the standpoint of International Gas Union, when justifying this interval of SSLNG capacities.
The second most frequently cited interval – LNG capacity up to 0.5 Mtpa – is based on the expertise of large international companies in the implementation (examination) of SSLNG projects. Other approaches are encountered only once each and no justification for them is found in the given sources. Hence, taking into account significant variation of production capacities in different sources, in this study authors understand SSLNG in terms of a standpoint based on the expertise of companies, implementing such projects – i.e., the LNG production capacity of less than 0.5 Mtpa.
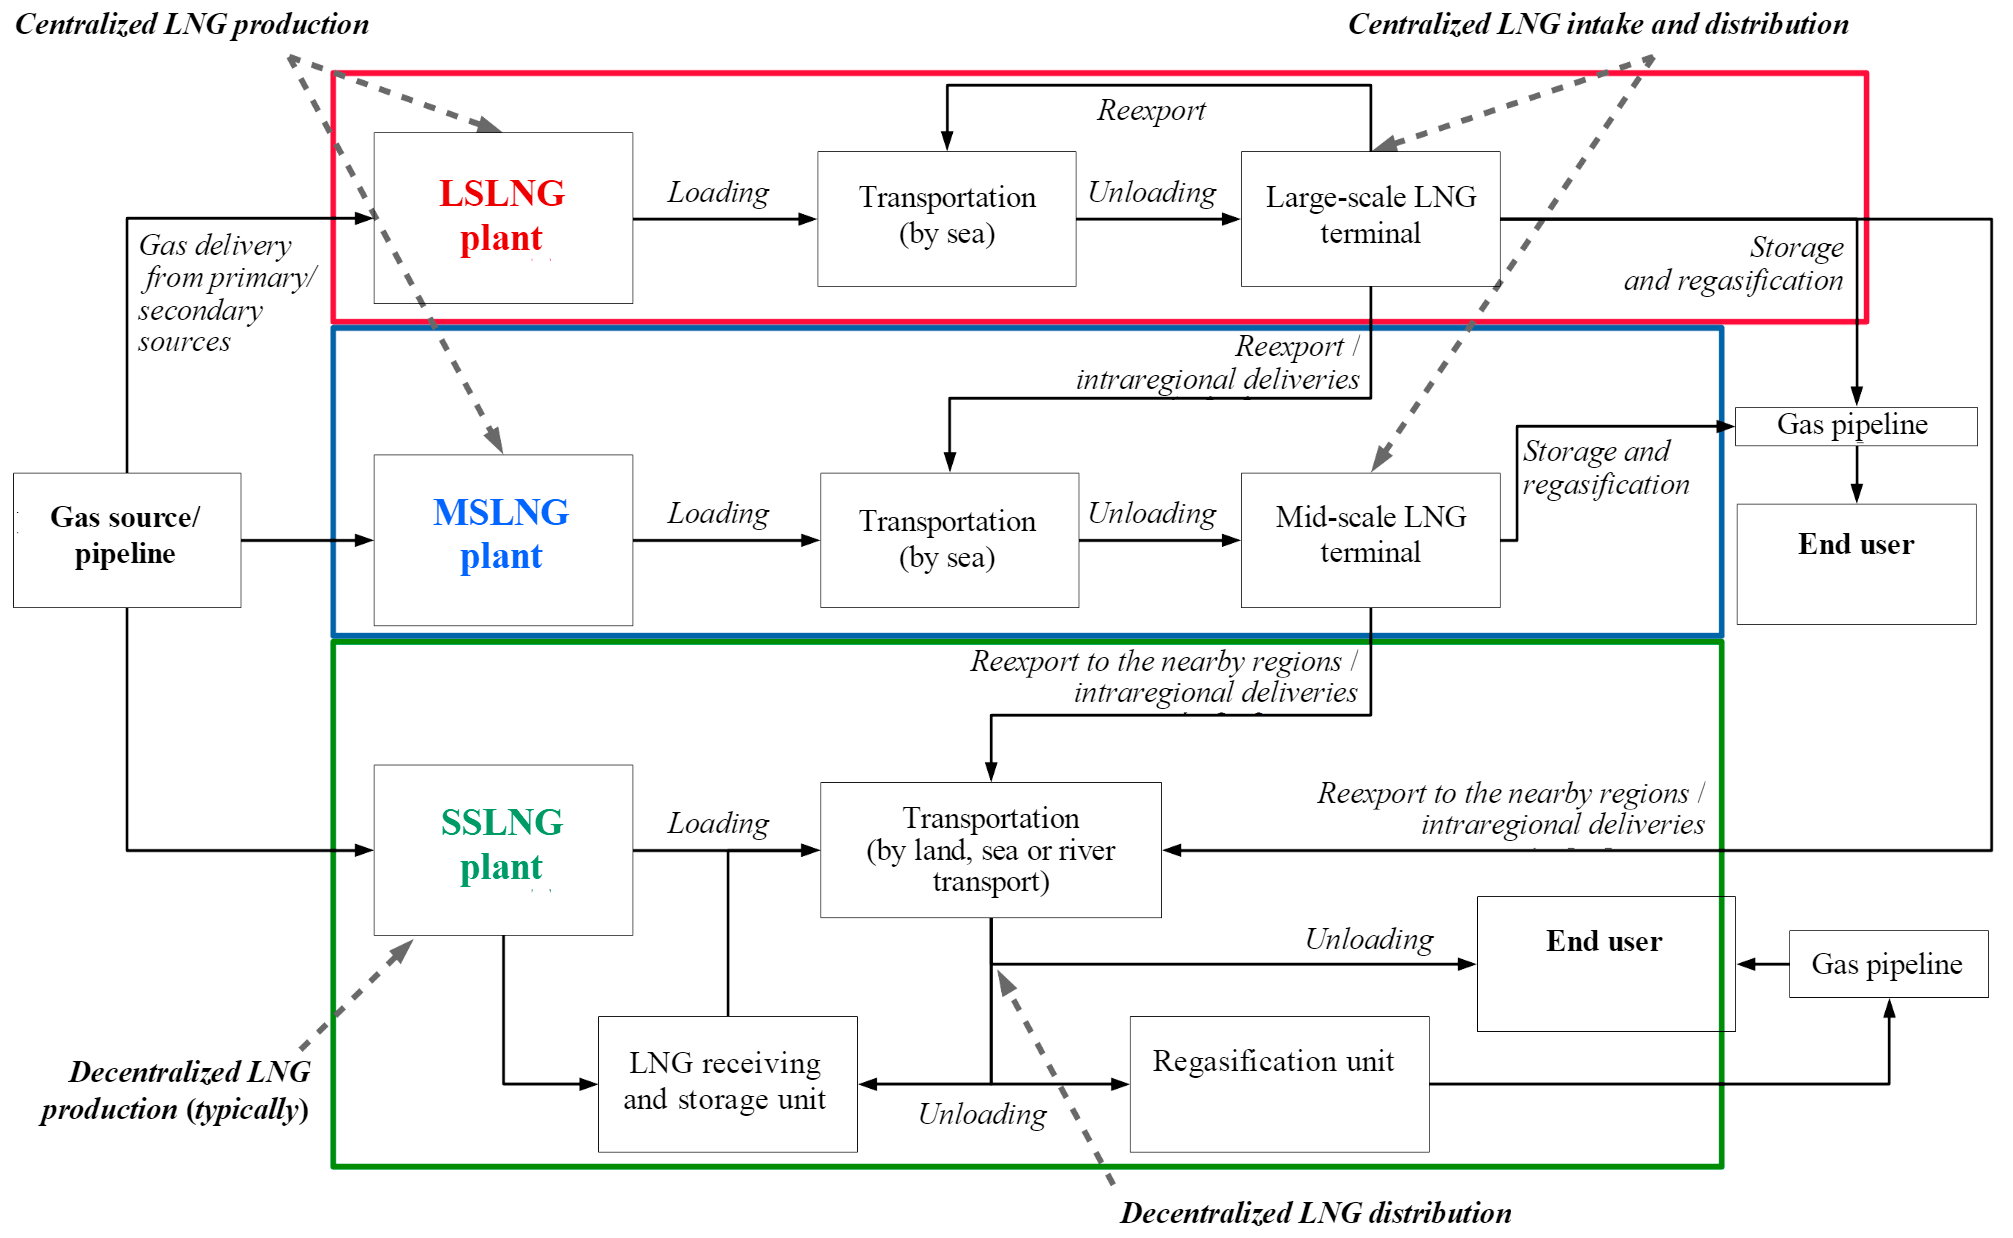
Specifics of SSLNG production and supply chains. Despite the fact that SS-, MS- and LSLNG are parts of the same sector, they have different organizational principles. Taken as a whole, SSLNG PSCs are regarded as a way to decentralize pipeline gas systems. However, their detailed consideration allows to draw a conclusion that LS- and MSLNG are centralized systems of gas delivery, as they imply a concentration of production capacities for liquefaction and regasification in one place (Fig.3 [20]. Such projects are aimed at expanding production capacity in order to obtain incremental financial effect due to production scale.
The key feature of SSLNG projects is their decentralized character, expressed in increasing the number of production facilities, not specific production capacity. The flexibility of SSLNG projects is expressed in the possibility to use different modes of transportation and focus on specific consumer demands in the region of project implementation [28]. Notably, SSLNG projects may also include portable regasification units, which allows to use them for implementation of short-term remote-access projects.
When implementing SSLNG projects taking into account regional specifics, there is an important and practically unexplored in the global literature problem of finding ways to organize effective interaction with stakeholders, which would allow to reduce the risks and implementation costs [55]. Approaches, designed for MS- and LSLNG projects, cannot be applied because of differences in the lineup of stakeholders.
Implementation costs of SSLNG projects. One of the main driving forces for the development of any project in the energy sector is its ability to produce cost competitive outputs [36]. In the global literature such estimates for SSLNG projects are scarce [54]. Table 3 contains a review of scientific and practical studies that estimate the costs of SSLNG project implementation.
From Table 3 it can be seen that the cost of 1 kWh of electric energy, produced from SSLNG, can range from 0.02 to 0.26 USD. Considering that in Russia electricity prices vary from 0.015 USD/kWh (Irkutsk region) to 0.124 USD/kWh (Chukotka AO and Kamchatka Krai) with the maximum number of values in the interval from 0.04 to 0.07 USD/kWh, implementation of SSLNG projects in order to organize decentralized energy supply can be economically efficient for certain regions. Implementation timeline for such projects is typically less than three years; the use of facilities for cold energy utilization may increase the payback period to 4.24-5.85 years [6]. On the other hand, MS- and LSLNG projects take no less than five years to reach payback period.
A report by World Bank [41] emphasizes that average cost estimations of such projects, based on production capacities of the plant or other technological parameters, are approximate due to significant differences in the utilized liquefaction technologies, the costs of which can take up around 40 % of total specific expenses [35]. Such estimates become more complicated due to the absence of statistical information on the projects with LNG capacity below 0.5 Mtpa. The costs of SSLNG projects, which are a part of the global gas market, are highly dependent on a wide range of macroeconomic and political factors [4, 47]; in particular, they are directly influenced by current prices of oil [47] and other energy resources.
Main directions of SSLNG use. Currently the most developed SSLNG networks are located in the US and China. As of 2015, 68 small-scale LNG plants with capacity 20-470 tonnes/day (in total – 7.75 million tonnes/day) were in operation in the US, with the goal of covering peak energy loads [41]. More than 50 of them were launched even before 2000, the first plant was established in 1940s with the capacity of 0.002 Mtpa [5]. New small-scale plants, launched in the last decades, apart from covering peak loads, are intended to supply LNG to gas stations to sell it as motor fuel. LNG capacity of such plants is no less than 440 thousand tonnes per annum (tpa).
Table 3
Review of scientific and practical studies on the estimation of SSLNG implementation costs
| Source | Summary of energy production costs |
| Conceptual model of PSC optimization by using SSLNG for deliveries to the end user [46] | 10-12 USD/MMBTU* |
| Cost estimation of energy production from SSLNG of different capacities: 77/154/428 tpa [45] | 49/60-66/78 USD/MMBTU (166/203-225/264 USD/МWh) |
| Estimation of economic effect from the use of SSLNG instead of oil products in electricity generation, 4 tpa [49] | 53 USD/MMBTU (180 USD/МВт∙ч) |
| Modeling of LNG costs for the implementation of Blue Corridor in Brazil (0.71-0.91 Mtpa [17] | 6,69-12,24 USD/MMBTU |
| Modeling of the costs of electricity generation from SSLNG with multimodal transportation (ships and trailers) in Finland [32] | 8,8-24 EUR/MMBTU (30-82 EUR/MWh) depending on transportation distance and natural gas price |
| Example of cost calculations for generating 1 MMBTU of energy from SSLNG for the conditions of the Caribbean islands (in 2015 prices): 50/100/500 tpa [15] | Natural gas price – 3,45/3,45/3,45 USD/MMBTU Liquefication – 3,5/3,5/3,5 USD/MMBTU Transportation (by sea and by land) – 4,8/4,2/2,5 USD/MMBTU Regasification – 1,2/0,85/0,5 USD/MMBTU Power plant costs – 0,3/0,25/0,2 USD/MMBTU Total: 13,25/12,25/10,15 USD/MMBTU |
| In 2015 prices [41] | |
| Transportation by the land | |
| 50 tpa | Distance 0-250 miles – 6,16 USD/MMBTU Distance 750-1000 miles – 9,66 USD/MMBTU |
| 15 tpa | Distance 0-250 miles – 8,12 USD/MMBTU Distance 750-1000 miles – 11,62 USD/MMBTU |
| Transportation by sea | |
| 50 tpa | Distance 55-150 nautical miles (nm) – 6,84 USD/MMBTU Distance 550-850 nm – 7,84 USD/MMBTU |
| 15 tpa | Distance 55-150 nm – 9.05 USD/MMBTU Distance 550-850 nm – 10,05 USD/MMBTU |
*British thermal unit (BTU) = 27.05 m3 of natural gas = 293 kWh of electricity.
In China there are around 120 operating SSLNG plants with total annual capacity 16 Mtpa, besides that there are plants at different stages of planning and construction with total capacity 19.2 Mtpa [41]. Taking into account vast territory of the country, the distance of trailer transportation can reach 3.5 thousand km. The main applications for LNG in China are energy production in remote regions, as well as LNG use as bunker and motor fuel. According to [56], specific capital costs per 1 tonne of SSLNG plant capacity in China reaches 240-500 USD, which is a relatively low indicator (in Russia it is around 1,000 USD/tonne [1]). Average operating costs amount to less than 1.5 USD/MMBTU, which is also a relatively low value.
Hence, presently three key directions of SSLNG use can be highlighted: electricity generation, in particular, covering the demands for supplemental energy resources during the peaks of energy consumption; motor fuel; bunkering fuel. By 2030, total LNG consumption in the energy sector, including its use as bunker and motor fuel, will reach around 112.7 billion tonnes of oil equivalent (citing “IHIS Markеt Energy outlook 2040”) [2]. Demand for SSLNG for similar purposes by 2030 can reach more than 90 Mtpa [9]. Taken as a whole, the growth of SSLNG consumption in the coming decade can reach around 6 % per year [30].
Conclusions. SSLNG is a relatively new sector and a partially isolated segment in gas industry, which has its own specifics of production organization, key players on the market and a growing role in satisfying energy demands of the population. The role of SSLNG in the global energy sector is extremely underestimated and underexplored. Only in 2018, SSLNG terminals dispatched over 17.68 million tonnes by trailers and no less than 1.5 million tonnes by small marine vessels [8]; by 2030 total SSLNG capacity can exceed 100 Mtpa [49].
Advantages of SSLNG over larger-scale projects are in shorter implementation timelines and lower specific capital costs, which reduces the risks of their implementation, as well as minimizes the barriers to entry into the market and serves as a positive factor for promoting competition. Besides, SSLNG is to a great extent a more decentralized subsector of LNG production than MSand LSLNG, therefore, implementation of such projects can become one of the factors that increase energy security of the regions [3, 8].
For Russia SSLNG development is associated with the opportunity to organize a system of decentralized gas supply to remote regions that have no access to clean energy resources. Moreover, there are significant prospects in the field of LNG use as bunker and motor fuel, the markets for which grew rapidly in the last decade. Already today, the largest Russian gas companies have ambitious plans for developing gas distribution networks based on SSLNG [18].
Besides that, geographical location of Russia is its strategic advantage in the implementation of SSLNG projects for diversification of raw materials export, which allow to create a flexible supply system without engaging into long-lasting and capital-intensive processes of gas pipeline construction [23]. For example, there are certain prospects of export deliveries into European countries, considering ambitious plans of constructing “blue corridors” on their territory. Construction of smallscale LNG capacities can also be of interest in the context of “Power of Siberia” project implementation, as in China a certain share of natural gas will be distributed as LNG, including SSLNG. However, justification of such options requires a complex and multidimensional estimation of potential effects from the implementation of such projects [37].
References
- Klimentev A., Mitronova T., Sobko A. Opportunities and Prospects of Small-Scale LNG Development in Russia. Energeticheskii tsentr Moskovskoi shkoly upravleniya SKOLKOVO, 2018. URL: https://energy.skolkovo.ru/downloads/documents/SEneC/Research/SKOLKOVO_EneC_2018.07.23.pdf (date of access 20.10.2019).
- Konoplyanik A.A., Sergayeva A.A. Small-scale LNG: New opportunities for Russian gas in Europe. Gas Industry Magazine. 2019. Vol. 787. N 7, p. 42-54 (in Russian).
- Ulanov V.L., Ulanova E.Y. Impact of External Factors on National Energy Security. Journal of Mining Institute. 2019.Vol. 238, p. 474-480. DOI: 10.31897/PMI.2019.4.474
- Cherepovitsyn A.E., Larichkin F.D., Vorobiev A.G. et al. Economical prospects of advancement in liquefied natural gasproduction. Gornyi Zhurnal. 2018. N 2, p. 59-64. DOI: 10.17580/gzh.2018.02.09
- Adotti C. Small Scale Whole Sale LNG // 26th World Gas Conference, 1-5 June 2015, Paris, France. URL: http://members.igu.org/old/IGU%20Events/wgc/wgc-2015/committee-reports-with-tnematic-sessions/thematic-sessions/ts-pgc-d-3-challenges-andopportunities-of-small-scale-lng/c-adotti-ts-pgc-d-3-final-presentation.pdf (date of access 19.01.2020).
- Kanbur B.B., Xiang L., Dubey S., Choo F.H., Duan F. A micro cogeneration system with LNG cold utilization-part 1: energetic, economic and environmental analyses. Energy Procedia. 2017. Vol. 105, p. 1902-1909. DOI: 10.1016/J.EGYPRO.2017.03.558
- Barclay M. Mini-to-Medium Scale LNG – A Profitable & Environmentally Sustainable Solution for Flared or Stranded Gas //Presentation at Flaring Reduction and Gas Utilization Forum, 2015. URL: https://slideplayer.com/slide/4194572/ (date of access19.01.2020).
- Birol F. Global Gas Security Review // IEA, 2019. URL: https://www.iea.org/reports/global-gas-security-review-2019 (dateof access 20.10.2019).
- Biscardini G., Schmill R., Del A. Maestro Small going big. Why small-scale LNG may by the next big wave. LNG Industry.2018. URL: https://www.lngindustry.com/small-scale-lng/22082018/small-going-big-why-small-scale-lng-might-be-the-next-big-wave/(date of access 20.10.2019).
- BNEF. Global LNG Outlook 2017. London, UK, 2017. URL: https://globallnghub.com/wp-content/uploads/attach_451.pdf (date of access 20.10.2019).
- BP: Statistical Review of World Energy – 2002 edition. URL: https://griequity.com/resources/industryandissues/Energy/bp2002statisticalreview.pdf (date of access 19.01.2020).
- BP: Statistical Review of World Energy – 2008 edition. URL: http://eleceng.dit.ie/kgaughan/notes/DT015%20Energy%20Supply/Student%20Links/BP_Statistical_Review_of_World_Energy_June_2008_Slide_Transcript.pdf (date of access 19.01.2020).
- BP: Statistical Review of World Energy – 2019 edition. URL: https://www.bp.com/content/dam/bp/business-sites/en/global/corporate/pdfs/energy-economics/statistical-review/bp-stats-review-2019-full-report.pdf (date of access 19.01.2020).
- Carayannis E., Ilinova A., Chanysheva A. Russian Arctic Offshore Oil and Gas Projects: Methodological Framework forEvaluating Their Prospects. Journal of the Knowledge Economy. 2019, p. 1-27. DOI: 10.1007/s13132-019-00602-7
- Chambers R. Small-Scale LNG Supply Chains. Confronting the Diseconomies of Small-Scale LNG. Report at World GasConference, 2015, Paris, France. URL: https://gie.eu/index.php/gie-publications/presentations/ (date of access 20.10.2019).
- Chiyoda Corporation: Official website. URL: https://www.chiyodacorp.com/en/service/lng/mid-small-scale-lng/ (date ofaccess 20.10.2019).
- Mouette D., Machado P.G., Fraga D., Peyerl D., Borges R.R., Brito T.L.F., dos Santos E.M. Costs and emissions assessment of a Blue Corridor in a Brazilian reality: The use of liquefied natural gas in the transport sector. Science of the Total Environment. 2019. Vol. 668, p. 1104-116. DOI: 10.1016/j.scitotenv.2019.02.255
- Evseeva O.O., Cherepovitsyn A.E. An approach to assessment of sustainability of the large-scale Russian liquefied naturalgas project. Topical Issues of Rational Use of Natural Resources. 2019. Vol. 2, p. 608-614.
- Global energy perspective 2019: Reference Case. McKinsey & Company, January 2019. URL: https://www.mckinsey.com/~/media/McKinsey/Industries/Oil%20and%20Gas/Our%20Insights/Global%20Energy%20Perspective%202019/McKinsey-EnergyInsights-Global-Energy-Perspective-2019_Reference-Case-Summary.ashx (date of access 19.01.2020).
- GEA Engineering: Official website. URL: https://www.gea.com/en/solutions/small-scale-lng-solutions.jsp (date of access20.10.2019).
- Global Gas & LNG outlook to 2035-2019 edition. URL: https://www.mckinsey.com/industries/oil-and-gas/our-insights/global-gas-and-lng-outlook-to-2035 (date of access 19.01.2020).
- Hagos D.A., Ahlgren E.O. Well-to-wheel assessment of natural gas vehicles and their fuel supply infrastructures–Perspectives on gas in transport in Denmark. Transportation Research Part D: Transport and Environment. 2018. Vol. 65, p. 14-35.DOI: 10.1016/j.trd.2018.07.018
- Henderson J. Global LNG Outlook. The Oxford Institute for Energy Studies, 2017. URL: https://www.imemo.ru/files/File/ru/conf/2017/13042017/13042017-PRZ-HEN.pdf (date of access 20.10.2019).
- He T., Karimi I.A., Ju Y. Review on the design and optimization of natural gas liquefaction processes for onshore andoffshore applications. Chemical Engineering Research and Design. 2018. Vol. 132, p. 89-114. DOI: 10.1016/j.cherd.2018.01.002
- IEA Gas 2018. Analysis and Forecasts to 2023. Gas Market Report. IEA, 2018.URL: https://iea.blob.core.windows.net/assets/c956c307-f104-41f4-9300-ff245bece93e/English-Gas-2018-ES.pdf (date of access19.01.2020).
- IEE. Outlook 2019: Energy transition and a thorny path for 3E challenges // The 430th Forum on Research Work, 15 October 2018, Tokyo, Japan. URL: https://eneken.ieej.or.jp/data/8123.pdf (date of access 19.01.2020).
- IGU. World LNG Report–2013 Edition. International Gas Union. 2013. URL: https://www.igu.org/sites/default/files/nodepage-field_file/IGU%20-%20World%20LNG%20Report%20-%202013%20Edition.pdf (date of access 19.01.2020).
- IGU. LNG as Fuel. 2012-2015 Triennium Work Report. International Gas Union. 2015. URL: https://www.igu.org/sites/default/files/node-page-field_file/LNGasFuel.pdf (date of access 19.01.2020).
- IGU. Small Scale LNG. 2012-2015 Triennium Work Report. International Gas Union. 2015. URL: https://www.igu.org/sites/ default/files/node-page-field_file/SmallScaleLNG.pdf (date of access 19.01.2020).
- IGU. World LNG Report – 2019 Edition. International Gas Union. 2019. URL: https://www.igu.org/sites/default/files/node-news_item-field_file/IGU%20Annual%20Report%202019_23%20loresfinal.pdf (date of access 20.10.2019).
- Ilinova A., Chanysheva A. Algorithm for assessing the prospects of offshore oil and gas projects in the Arctic. EnergyReports. 2020. Vol. 6, p. 504-509. DOI: 10.1016/j.egyr.2019.11.110
- Jokinen R., Pettersson F., Saxén H. An MILP model for optimization of a small-scale LNG supply chain along a coastline.Applied Energy. 2015. Vol. 138, p. 423-431. DOI: 10.1016/j.apenergy.2014.10.039
- Khan M.S., Karimi I.A., Wood D.A. Retrospective and future perspective of natural gas liquefaction and optimization technologies contributing to efficient LNG supply: A review. Journal of Natural Gas Science and Engineering. 2017. Vol. 45, p. 165-188.DOI: 10.1016/j.jngse.2017.04.035
- Kramer M. The Role of Natural Gas in the Energy Transition // Report at 27th World Gas Conference, 2019, Washington,USA. URL: https://www.igu.org/sites/default/files/6%20-%20WFES%20Decarbonisation%20160117%20Marcel%20Kramer.pdf (dateof access 19.01.2020).
- Lim W., Choi K., Moon I. Current Status and Perspectives of Liquefied Natural Gas (LNG) Plant Design. Industrial &Engineering Chemistry Research. 2013. Vol. 52. Iss. 9, p. 3065-3088. DOI: 10.1021/ie302877g
- Litvinenko V.S., Sergeev I.B. Innovations as a Factor in the Development of the Natural Resources Sector. Studies on RussianEconomic Development. 2019. Vol. 30. Iss. 6, p. 637-645. DOI: 10.1134/S107570071906011X
- Litvinenko V. The Role of Hydrocarbons in the Global Energy Agenda: The Focus on Liquefied Natural Gas. Resources.2020. Vol. 9. Iss. 5. N 59. DOI: 10.3390/resources9050059
- LNG Market Trends and Their Implications. Technology report. IEA, 2019. URL: https://www.iea.org/reports/lng-markettrends-and-their-implications (date of access 19.01.2020).
- LNG Technology: Optimised solutions for small- to world-scale plants. Linde Group, 2018. URL: http://www.lindeengineering.ru/ru/images/LNG-technology-small-to-world-scale-plants-2019_tcm480-4577.pdf (date of access 19.01.2020).
- Maynitskiy I. The Evolution of Small-Scale LNG Markets: The View from Gazprom Export. Small Scale LNG Forum,22-23 October 2012, Istanbul, Turkey. URL: http://www.gazpromexport.com/files/22_10_2012_-_Evolution_of_Small-Scale_LNG117.pdf (date of access 19.01.2020).
- Mini and Micro LNG for Commercialization of Small Volumes of Associated Gas. Tractebel Engineering, 2015.URL: https://openknowledge.worldbank.org/handle/10986/25919 (date of access 19.01.2020).
- Ancona M.A., Bianchi M., Branchini L., De Pascale A., Melino F., Mormile M., Palella M. On-site LNG productionat filling stations. Applied Thermal Engineering. 2018. Vol. 137, p. 142-153. DOI: 10.1016/j.applthermaleng.2018.03.079
- Pedraza J.M. Current Status and Perspective in the Use of Natural Gas for Electricity Generation in the North AmericaRegion. Conventional Energy in North America. 2019, p. 155-209. DOI: 10.1016/B978-0-12-814889-1.00003-6
- Powell J.B. Natural Gas Utilization: Current Status and Opportunities. Catalysis Today, 2019.DOI: 10.1016/j.cattod.2019.10.024
- Punnonen K. Small and Medium size LNG for Power Production. Vaasa: Wärtsilä Finland Oy, 2013.URL: https://www.wartsila.com/docs/default-source/oil-gas-documents/white-paper-o-ogi-2013-lng-power-production.pdf (date ofaccess 20.10.2019).
- Regan T. Small scale LNG: Emerging technologies for small scale grids. Presentation to ESI Thinktank Roundtable,27 October 2017, Singapore. URL: https://esi.nus.edu.sg/docs/default-source/doc/smallscale-lng---esi-roundtable.pdf?sfvrsn=2(date of access 19.01.2020).
- Sharples J. LNG supply chains and the development of LNG as a shipping fuel in Northern Europe. Oxford Institute forEnergy Studies, 2019, p. 60. DOI: 10.26889/9781784671266
- Steuer C. Outlook for competitive LNG supply. Oxford Institute for Energy Studies, 2019, p. 44.DOI: 10.26889/9781784671310
- Small-scale LNG in Asia-Pacific. APEC Energy Group, 2019. URL: https://www.apec.org/-/media/APEC/Publications/2019/9/Small-scale-LNG-in-Asia-Pacific/219_EWG_Small-scale-LNG-in-Asia-Pacific.pdf (date of access 19.01.2020).
- Tcvetkov P., Cherepovitsyn A., Makhovikov A. Economic assessment of heat and power generation from small-scaleliquefied natural gas in Russia. Energy Reports. 2020. Vol. 6, p. 391-402. DOI: 10.1016/j.egyr.2019.11.093
- Savard C., Nikulina A., Mécemmène C., Mokhova E. The Electrification of Ships Using the Northern Sea Route: An Approach.Journal of Open Innovation: Technology, Market, and Complexity. 2020. Vol. 6. Iss. 1, p. 13. DOI: 10.3390/joitmc6010013
- The LNG Industry GIIGNL Annual Report 2019. GIIGNL, 2019. URL: https://giignl.org/sites/default/files/PUBLIC_AREA/Publications/giignl_annual_report_2019-compressed.pdf (date of access 20.10.2019).
- TGE Gas Engineering: Official website. URL: https://www.tge-gas.com (date of access 20.10.2019).
- Voronov V.A., Ruzmanov A.Y. Energy-efficient small-scale liquefied natural gas production technology for gas distribution stations. Topical Issues of Rational Use of Natural Resources. 2019. Vol. 2, p. 901-906.
- Wittermans F. Small Scale LNG Needs Cooperation in the Value Chain. Report at World Gas Conference. Paris, France,2015. URL: https://gie.eu/index.php/gie-publications/presentations/ (date of access 20.10.2019).
- Wei L. A Look at the Development Trend of Liquefaction Technology from China’s LNG Plants. Report at InternationalBusiness Congress, 29 January 2019, Duisburg, Germany. URL: https://www.international-bc-online.org/wp-content/uploads/2019/02/8.-CNPC-ENG-1.pdf (date of access 19.01.2020).