
Search of the Nash equilibrium for a system of two interconnected raw materials and products markets
- 1 — Postgraduate Student Skolkovo Institute of Science and Technology ▪ Orcid
- 2 — Ph.D. Senior Lecturer Skolkovo Institute of Science and Technology ▪ Orcid
Abstract
A new model of an integrated economic system is investigated which consists of two markets – raw materials and products interconnected by selling and processing raw materials into products. When the markets reach an equilibrium state, this model allows estimating the commodity flows and the economic efficiency of each producer of raw materials or products taking into account the market conditions. With such a structure of interconnected commodity markets, producers in the raw materials market are buyers of raw materials, and in the products market – sellers. Due to this feature of the market system the demand function for raw materials is set implicitly, and the standard methods for searching the equilibrium seem ineffective for this problem. In order to find an equilibrium state for the presented structure of interconnected commodity markets, an algorithm for searching the Nash equilibrium was developed, which takes into account the desire of each market player to maximize profits considering the market conditions and the behaviour of competitors. By applying the methods of game theory and economic modelling, this research provides insight into competitive dynamics and strategic interactions both between players within a single commodity market in terms of competition, and between the markets proper in terms of formation of interconnected pricing. The results have practical significance for developing the market and investment strategies for the companies from real sectors of economy, production modernization programs, and optimization of government subsidy programs.
None
Introduction
The search for new approaches to optimizing market strategies in the context of an unstable geopolitical situation and growing systemic changes in the world is a pressing issue. One way to investigate the effects of using a particular market strategy is to determine the market state at which the Nash equilibrium is achieved. The Nash equilibrium is a state of the economic system at which none of participants in the economic process can increase profits by changing the strategy unilaterally.
The article considers the search for the Nash equilibrium in the system of two markets of raw materials and products interconnected through processing of raw materials into products with added value. The study of the Nash equilibrium in such markets has important practical applications. For example, understanding the equilibrium states can help in optimizing production modernization programs, increasing the efficiency of the market strategy, and substantiating government regulation policy. This research is also particularly relevant given the unstable nature of the mineral resources and fuel and energy complex markets, where strategic interactions between producers, consumers, and regulators can significantly affect the overall state of the market. Thus, the impetus for this study was the need to develop reliable algorithms capable of finding the Nash equilibrium in complex market systems.
The theme of searching the Nash equilibrium was actively investigated for a long time in different professional fields. Thus, finding the Nash equilibrium in an imperfect market is important for the operation of an electric grid with a deregulated market [1]. With growth of the number of renewable energy sources, it becomes more difficult to find the Nash equilibrium that could solve the problem of uncertainty of renewable energy sources [2]. Different solutions to this issue were proposed in order to maximize the profit of players in non-cooperative games [3]. Article [4] investigates the dynamic model of international “business-to-business” transactions where buyers and sellers search for an equilibrium state in the supply – demand system, where the probability of a match depends on both individual and joint search efforts. Article [5] investigates the dynamics of a coordinated monopoly with established, risk-neutral companies and conditions under which new competitors can enter the market; and article [6] focuses on development of a game model for finding pricing solutions in a competitive supply chain consisting of the dominant producer that produces a single short shelf-life product and two retailers that are forced to operate under conditions of a nonlinear demand function. Article [7] proposes a method for finding an equilibrium state of the market based on an auction, which applies game theory methods with incomplete information about a non-cooperative environment. Article [8] proposes a perfect competitive market model, where prices are determined by the breakeven point conditions. Article [9] takes into account the factors of optimal bidding strategies in markets with a significant share of renewable energy sources. Investigation [10] presents a hierarchical distributed reinforcement learning (HNDRL) framework for finding the Nash equilibria in bidding strategies in imperfect electricity markets. In addition to the Nash equilibrium, the researchers sometimes consider competitive equilibrium in the context of market optimization. For example, [11] investigates differences between the Nash equilibrium and competitive equilibrium in the context of electricity markets. Some articles propose more complex models of market equilibrium, for example, publication [12] presents a study of pure Nash equilibria in a quantum game that goes beyond the classical bimatrix game. And material [13] analyses the Nash – Stackelberg game approach for analysing strategic interactions in stable energy systems. Article [14] considers analytical and functional problems of understanding the impact of voluntary renewable energy markets. The authors emphasize the lack of rigorous empirical data and appropriate statistical methods for identifying these impacts.
Modern research also often employs the methods of game theory used to study the interrelations of strategic behaviour of rational market participants, which is usually analysed using equilibrium programming models. Equilibrium models in markets can be classified as Cournot models (for modelling quantities) [15], Stackelberg models (combining quantities and prices) [16], agent-based models [17], etc.
Some articles also consider expanded market systems. Thus, article [5] investigates the dynamics of a coordinated monopoly with established, risk-neutral companies, and article [18] shows that in the prisoner’s dilemma the first best outcome is achievable, but cannot be interpreted as the Nash equilibrium. In the “tipping” game only the second best outcome is attainable, but there is the Nash equilibrium that is strictly preferable to the one in the prisoner’s dilemma. Article [19] uses game theory to consider the strategic consequences of a rapid energy transition, and article [20] examines the application of the game theory to long-term energy planning. Article [21] considers the application of the game theory to modelling the behaviour of stock market participants. The use of the game theory methods and the Nash equilibrium search algorithms are studied in the context of not only modelling the economic systems, as clearly shown in article [22]. At the same time, regional markets are often considered in economic models. Article [23] presents a generalized Nash game model for describing competitive relations between centralized and local energy markets, and article [24] demonstrates a comparative analysis of the Nash equilibrium and sequential equilibrium in the context of regional energy markets. At the same time, article [25] examines a market-affecting game involving risk-averse investors.
Some articles, for instance [26], consider the study of the game theory methods in which players do not have full information about the true probability distribution, but they need to make a decision before the events in question occur. Other studies consider complex market systems comprising multiple products chains consisting of raw materials suppliers, service providers, production integrators, and consumers. Then, the equilibrium model for decision makers at all levels is established by a variational inequality, as shown in [27]. Some works also consider the influence of market participants’ behaviour on pricing [28], and investigate a network of agricultural products supply chains [29], for which a generalized Nash equilibrium model with stochastic parameters is established among the companies producing fresh produce. This model is then transformed into a mixed system using the Karush – Kuhn – Tucker conditions. Sometimes the researchers further complicate the problem by considering not only equilibrium, but also the so-called Nash bargaining problems. Thus, in article [30] a non-cooperative trading model is proposed, which expands the Rubinstein model.
Exact and approximation algorithms for different types of games were proposed from different perspectives. More recently, a number of articles appeared advancing these fundamental approximation concepts to find the Nash equilibrium. On the other hand, empirical studies of the Nash equilibrium approximation are quite rare even for two players [31]. Publications also consider continuous games, in which each player has a continuous action space. In this case, the solution concept called a local Nash equilibrium characterizes a strategy in which no player can gain a greater positive effect by deviating from the local neighbourhood of his strategy. Some authors consider complex market systems with oligopolistic pricing mechanisms in supply chains. However, the existing mechanism of sequential pricing does not fully take into account constraints such as the volume of companies’ procurements and information about changes in each parameter, which leads to a separation of the pricing mechanism from the real market [32]. However, there is another problem associated with convergence of complex systems, especially when game theory methods are used to study not only the economy, but, for example, to model the interacting biological and social systems. If the system is not configured to achieve the equilibrium, its behaviour can be unpredictable [33]. The researchers also sometimes consider the Bayesian equilibrium [34] which is a generalization of the Nash equilibrium in mixed strategies.
Based on the above analysis, it can be concluded that most of scientific works, one way or another touching upon the topic of the Nash equilibrium in different markets, mainly consider energy markets, and to a lesser extent, commodity markets. At the same time, questions of finding the equilibrium in interconnected markets of raw materials and products are encountered much less frequently, which emphasizes the relevance of this work.
The scientific novelty and purpose of the work is to create an algorithm for finding the Nash equilibria in two interconnected markets of raw materials and products (together – goods). This market system is characterized by the following features:
- several players participate in the products market and the raw materials market;
- products producers in the raw materials market are buyers of raw materials, and in the products market they are sellers;
- products buyers explicitly set the demand function for the products which is determined by the Cournot model;
- the demand function in the raw materials market is implicitly set taking into account the market conditions in the products market;
- a non-cooperative game is considered for each market;
- transfer of raw materials and products from the seller to the buyer occurs within the framework of single intermarket exchanges that store the entire volume of produced goods, i.e. the sellers cannot choose which buyer they sell the goods to and in what quantity;
- specific operating expenses per commodity unit for each market player are constant and include all possible expenses that the players bear within the framework of their operational activities, including production costs, logistics, taxes, and other expenses.
Methods
Problem statement. A non-cooperative game is considered in which some players participate in both markets: consumers of raw materials in one market are producers of products in the other market. As a consequence, the demand function in the raw materials market is set implicitly, and standard methods of equilibrium search reduced to one market are not efficient in application to the presented problem. Let us consider the general mathematical formulation of the problem for finding the Nash equilibrium in each market. Players in each market seek to maximize their profits:
where Pij is the profit of each player, c.u.; i = 1, 2 are market indices (1 – products market, 2 – raw materials market); j = 1, 2, 3 …Si – players’ indices in each market (Si – total number of players in each i-th market); xij – total quantity of goods sold by the j-th player in the i-th market; R+ – a set of non-negative real numbers.
The profit of each player is calculated from the difference between the revenue received from the sale of goods and the operating costs incurred:
where Rij is the revenue of each player received from the sale of goods, c.u.; Cij – total operating costs of each player, c.u.
The revenue of each player is calculated from the product of total quantity of goods of each type sold and the cost of these goods in the market, which depends on demand function in the corresponding market:
where pricei (Qi) is the demand function for the goods in the i-th market; Qi – total quantity of the product produced in the i-th market.
The demand function in the products market is set in explicit form:
where a is coefficient of the demand function in the products market, c.u.; Q1 – total amount of products produced by the players, , units.
The demand function in the products market price2 (Q2) is set in implicit form.
Total operating expenses of producers depend on the specific operating costs as well as the cost of raw materials in the raw materials market. Given that the quantity of products is proportional to the amount of raw materials consumed for each player, total operating costs of producers are determined from the formula:
where с1j are specific operating costs for producing a unit of output, c.u. /units; u – coefficient of raw materials conversion into products describing the number of raw materials units required to produce one unit of output; price2 (Q2) – demand function for raw materials; Q2 – total amount of raw materials purchased by producers at the raw materials market, units; x1j – volume of output produced by each player in the products market, units.
Total costs incurred by raw materials producers are determined from formula:
where c2j are specific operating costs for the production of a unit of raw materials, c.u./units; x2j – volume of raw materials produced by each player in the raw materials market, units.
Proposed solution. The algorithm for finding an equilibrium state between interconnected raw materials and products markets looks as follows:
- To set the demand function in the products market explicitly.
- To set the unit production costs for each player in all markets.
- To approximate the demand function in the raw materials market:
a) to search for the Nash equilibrium for the products market for each set value of the raw materials cost; to set the raw materials cost in a certain range with N points;
b) to approximate the demand function in the raw materials market using the least squares method based on the resulting set of values of the demand volume for raw materials and the cost of raw materials. - To implement the Nash equilibrium search for the raw materials market taking into account the obtained demand function in the raw materials market. To calculate the values of the raw materials market parameters (total volume of produced raw materials and their specific cost) at which the Nash equilibrium is achieved.
- To perform the Nash equilibrium search for the products market considering the obtained specific cost of raw materials. To calculate the value of the produced products volume.
- The equilibrium state between the interconnected markets of raw materials and products is considered to be achieved when the production volumes of raw materials and products obtained as a result of implementing the proposed algorithm converge.
To find the Nash equilibrium for each market, it is proposed to use the tatonnement method, which implies that each player within the corresponding market and according to the conditions of non-cooperative game seeks to maximize the profit, taking into account the known historical data on market strategies of competitors. To solve the problem of maximizing the profit of each player, the SciPy library of algorithms for scientific and engineering computations was used. The Nelder – Mead simplex method was applied as an optimization method. Block diagram of the described algorithm is shown in Fig.1.
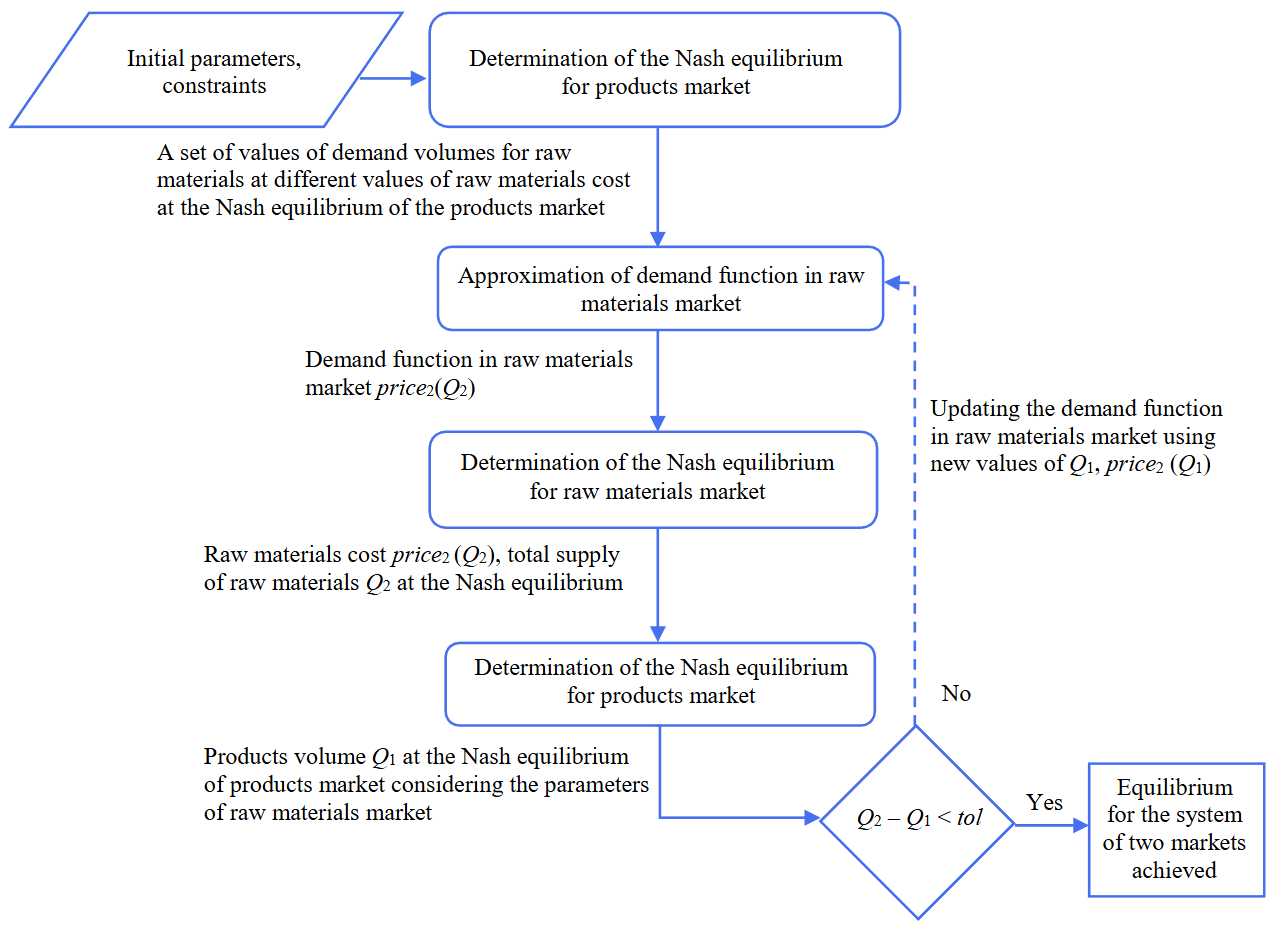
Fig.1. Algorithm for finding an equilibrium state between interconnected markets of raw materials and products
Numerical experiment. Let us apply the proposed algorithm to find an equilibrium state between interconnected markets of raw materials and products. For clarity, we assume that the raw material is crude oil, and the product is oil product. Thus, we take u = 1. We set the initial values of parameters (Table 1). We randomly select the specific operating costs for production of a commodity unit for producers of oil and oil products from the ranges c1j ∈ [60, 160], c2j ∈ [20, 160]. We designate this set of values of initial parameters as market scenario N 1.
Table 1
Initial parameter values for market scenario N 1
|
Parameter |
Value |
|
Coefficient of demand function in the products market (oil products) a, c.u. Specific operating costs for production of a commodity unit, c.u./units |
200,000 |
|
Producer of products (oil products) 1 с11 |
25 |
|
Producer of products (oil products) 2 с12 |
40 |
|
Producer of products (oil products) 3 с13 |
80 |
|
Producer of products (oil products) 4 с14 |
120 |
|
Producer of products (oil products) 5 с15 |
160 |
|
Raw materials (oil) producer 1 с21 |
110 |
|
Raw materials (oil) producer 2 с22 |
135 |
|
Raw materials (oil) producer 3 с23 |
80 |
|
Raw materials (oil) producer 4 с24 |
105 |
|
Raw materials (oil) producer 5 с25 |
120 |
Let us consider the results of each step of the algorithm:
1. Let us explicitly set the demand function in oil products market in accordance with formula (1):
2. For each player, we will set the values of specific operating costs for production (Table 1).
3. We will approximate the demand function in the oil market using the least squares method:
a) we will set the range of oil cost values with the number of points N = 50:
The results of searching the Nash equilibrium in oil products market by tatonnement method, taking into account the selected points in the given range of oil price values, are presented in Table 2;
b) we will approximate the demand function in the oil market by the least squares method, taking into account the values in Table 2. Let us assume that the demand function has the form of a fourth-degree polynomial, since a fourth-degree polynomial achieves the best value of the determination coefficient within the framework of this numerical experiment (R2 = 0.99904 for a fourth-degree polynomial; R2 = 0.97498 for a third-degree polynomial; R2 = 0.85784 for a hyperbola):
where Q2 is total volume of oil produced by the players, units, .
As a result, the following values of coefficients of the demand function in the oil market were obtained for market scenario N 1: А = 1.72·10–11; В = –1.50·10–7; С = 4.95·10–4; D = –7.55·10–1; E = 4.79·102.
Table 2
Results of calculating the volumes of demand for oil at different specific costs of oil for market scenario N 1
|
Parameter |
Value |
||||
|
Specific cost of oil, c.u./units |
0.00 |
3.06 |
6.12 |
9.18 |
12.24 |
|
Volume of demand for oil, units |
3076.61 |
2811.84 |
2589.01 |
2398.94 |
2234.90 |
|
Specific cost of oil, c.u./units |
15.31 |
18.37 |
21.43 |
24.49 |
27.55 |
|
Volume of demand for oil, units |
2095.14 |
1998.98 |
1911.26 |
1830.92 |
1757.06 |
|
Specific cost of oil, c.u./units |
30.61 |
33.67 |
36.73 |
39.80 |
42.86 |
|
Volume of demand for oil, units |
1688.92 |
1625.88 |
1567.37 |
1512.93 |
1462.14 |
|
Specific cost of oil, c.u./units |
45.92 |
48.98 |
52.04 |
55.10 |
58.16 |
|
Volume of demand for oil, units |
1414.65 |
1370.15 |
1328.36 |
1289.05 |
1252.00 |
|
Specific cost of oil, c.u./units |
61.22 |
64.29 |
67.35 |
70.41 |
73.47 |
|
Volume of demand for oil, units |
1217.01 |
1183.93 |
1152.60 |
1122.89 |
1094.67 |
|
Specific cost of oil, c.u./units |
76.53 |
79.59 |
82.65 |
85.71 |
88.78 |
|
Volume of demand for oil, units |
1067.83 |
1042.27 |
1017.92 |
994.67 |
972.46 |
|
Specific cost of oil, c.u./units |
91.84 |
94.90 |
97.96 |
101.02 |
104.08 |
|
Volume of demand for oil, units |
951.23 |
930.90 |
913.47 |
896.75 |
880.64 |
|
Specific cost of oil, c.u./units |
107.14 |
110.20 |
113.27 |
116.33 |
119.39 |
|
Volume of demand for oil, units |
865.09 |
850.08 |
835.58 |
821.57 |
808.03 |
|
Specific cost of oil, c.u./units |
122.45 |
125.51 |
128.57 |
131.63 |
134.69 |
|
Volume of demand for oil, units |
794.92 |
782.23 |
769.94 |
758.03 |
746.48 |
|
Specific cost of oil, c.u./units |
137.76 |
140.82 |
143.88 |
146.94 |
150.00 |
|
Volume of demand for oil, units |
735.28 |
724.41 |
713.85 |
703.60 |
693.64 |
Low values of A and B coefficients of the fourth-degree polynomial are explained by the fact that values of the function argument (total volume of oil) reach several thousand units. Let us display the calculated values of the specific cost of oil and the corresponding volume of demand for oil from Table 2 as well as the approximated function of demand for oil (Fig.2).
4. As a result of calculating the Nash equilibrium for the oil market, taking into account the approximated demand function, we obtain the value of specific cost of oil at the Nash equilibrium of oil market price2 (Q2)=146.39 c.u./units.
5. Let us search the Nash equilibrium for oil products market, taking into account the value of specific cost of oil calculated in step 4. Fig.3 shows the graphs of a change in profit for each producer of oil and oil products at each step of the search for the Nash equilibrium in the corresponding market. The values of market parameters of the players upon reaching the Nash equilibrium in each market are shown in Table 3.
Based on the presented results (Fig.3, Table 3), the following conclusions can be drawn:
- Difference between the final values of the volumes of produced oil and oil products is negli-gibly small, which allows asserting that an equilibrium state was achieved between the interconnected markets of raw materials and products in one iteration of the algorithm.
- In the given market conditions, oil products producer 5 appeared to be uncompetitive due to high operating costs compared to other producers, which led to a decrease in its production volume and, accordingly, profit to zero. At the same time, oil products producer 1 with the most efficient production and the lowest operating costs, took the leading position in the market both in production volume and profit. This observation confirms the ability of the algorithm to reflect market dynamics that correspond to the given market conditions.
- Tatonnement method shows rapid convergence: the Nash equilibrium for the oil market was achieved in 53 iterations, and the Nash equilibrium for oil products market – in 26 iterations.
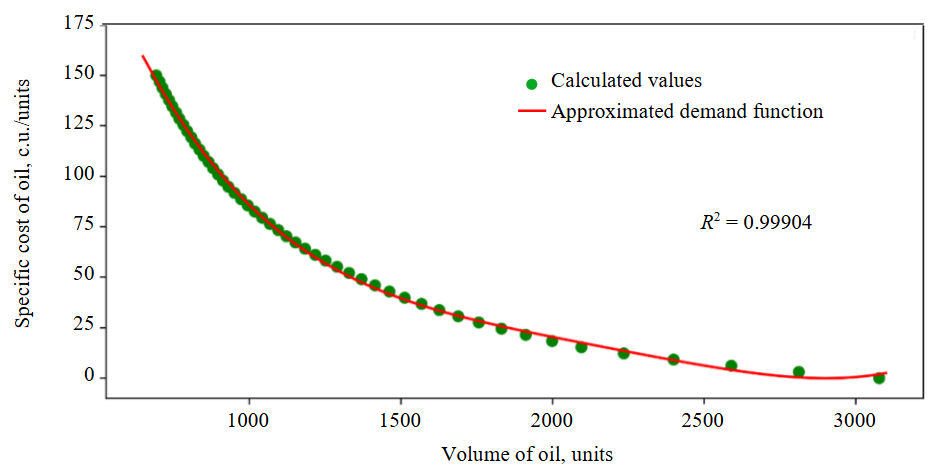
Fig.2. Result of approximating the demand function in oil market for market scenario N 1
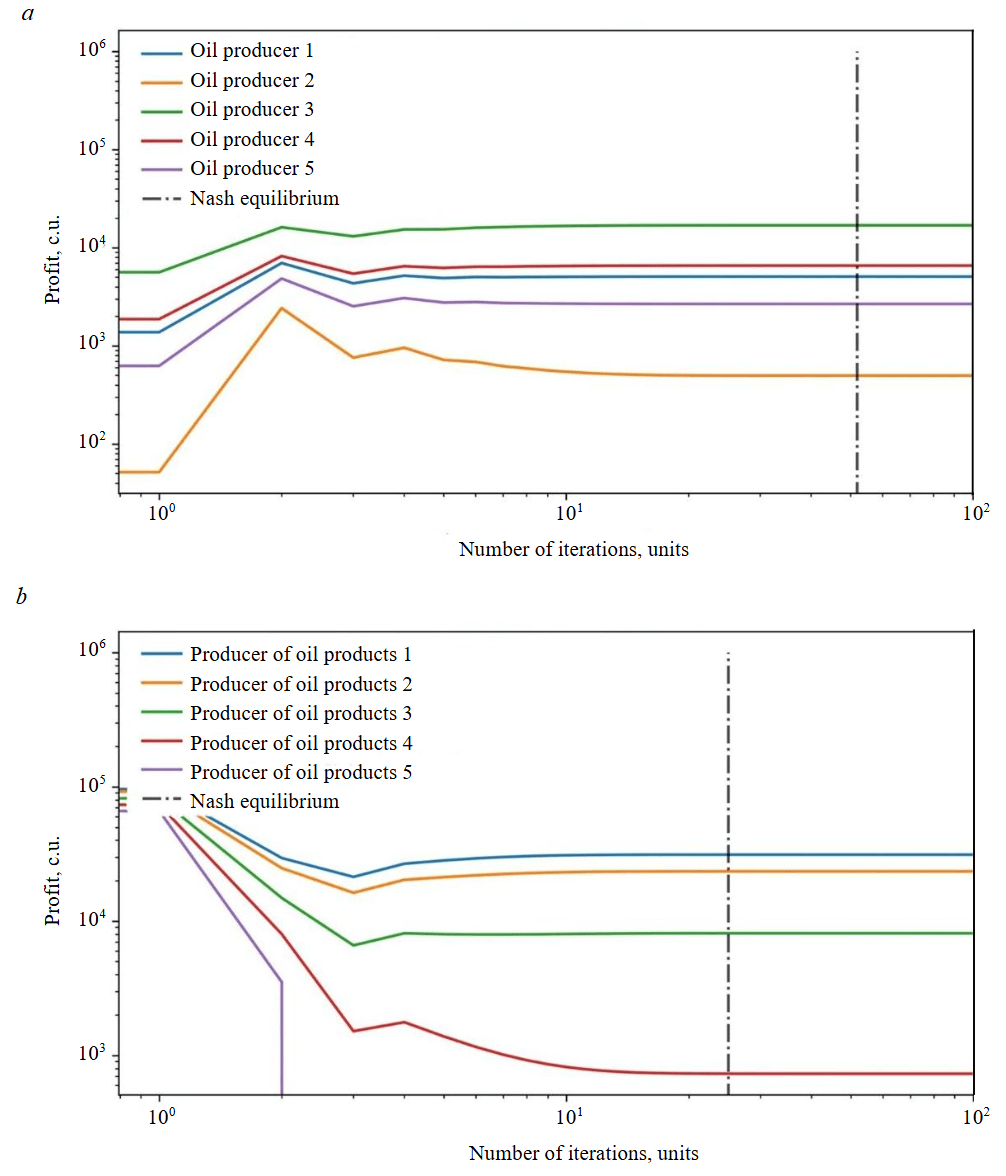
Fig.3. Results of search for the Nash equilibrium for oil – raw materials market (a) and oil products – products market (b) for market scenario N 1
Table 3
Market parameters of players in oil market and oil products market at reaching the Nash equilibrium for market scenario N 1
|
Parameter |
Value |
||||
|
Player’s index |
|||||
|
1 |
2 |
3 |
4 |
5 |
|
|
Raw materials market |
|||||
|
Profit, c.u. |
5076.98 | 497.58 | 16,897.09 | 6567.85 | 2670.24 |
|
Volume of oil produced, units |
139.50 |
43.67 | 254.50 | 158.67 | 101.17 |
|
Volume of oil produced (total), units |
697.52 |
||||
|
Specific cost of oil, c.u./units |
146.39 | ||||
| Products market | |||||
|
Profit, c.u. |
31,282.49 | 23,472.85 | 8120.71 | 730.16 |
0.00 |
|
Volume of produced oil products, units |
278.97 | 241.65 | 142.13 | 42.65 |
0.00 |
|
Volume of produced oil products (total), units |
705.41 |
||||
|
Specific cost of oil products, c.u./units |
283.52 | ||||
When approximating the demand function for raw materials with a hyperbola as a result of applying the algorithm, the volume of oil was Q2 = 640.73 units, the volume of oil products was Q1 = 736.19 units, and the determination coefficient was R2 = 0.85784. Such a difference between the final values of volumes does not allow speaking about achieving the equilibrium state between the interconnected markets of raw materials and products. The accuracy of the approximation of the demand function for raw materials directly affects the search for the final state of equilibrium of the market system.
For demonstrating the practical significance of the proposed approach, let us consider a situation where producer of oil products (products) 5 optimized its production, which led to a reduction in specific operating costs by 20 %: с15 = 128 c.u./units. Let us designate this set of values of initial parameters as market scenario N 2.
For market scenario N 2, we will perform all steps of the algorithm for searching the equilibrium state between two interconnected oil and oil products markets. The results of calculating the volumes of demand for oil at different specific cost of oil are presented in Table 4. In Fig.4, we will indicate the result of approximating the demand function in the oil market. Values of coefficients of the demand function in the oil market for market scenario N 2: А = 1.83·10–11; В = –1.59·10–7; С = 5.18·10–4; D = –7.82·10–1; Е = 4.91·102. Results of the search of the Nash equilibrium in oil and oil products markets are shown in Fig.5; the final market parameters of the players in oil and oil products market upon reaching the Nash equilibrium were demonstrated in Table 5.
Table 4
Results of calculating the volumes of demand for oil at different specific cost of oil for market scenario N 2
|
Parameter |
Value |
||||
|
Specific cost of oil, c.u./units |
0.00 |
3.06 |
6.12 |
9.18 |
12.24 |
|
Volume of demand for oil, units |
3076.65 |
2811.83 |
2589.01 |
2398.89 |
2234.88 |
|
Specific cost of oil, c.u./units |
15.31 |
18.37 |
21.43 |
24.49 |
27.55 |
|
Volume of demand for oil, units |
2095.15 |
1998.98 |
1911.26 |
1830.92 |
1757.06 |
|
Specific cost of oil, c.u./units |
30.61 |
33.67 |
36.73 |
39.80 |
42.86 |
|
Volume of demand for oil, units |
1688.93 |
1625.88 |
1567.37 |
1512.93 |
1462.14 |
|
Specific cost of oil, c.u./units |
45.92 |
48.98 |
52.04 |
55.10 |
58.16 |
|
Volume of demand for oil, units |
1414.65 |
1370.15 |
1328.36 |
1289.05 |
1252.00 |
|
Specific cost of oil, c.u./units |
61.22 |
64.29 |
67.35 |
70.41 |
73.47 |
|
Volume of demand for oil, units |
1217.01 |
1183.93 |
1152.60 |
1122.89 |
1094.66 |
|
Specific cost of oil, c.u./units |
76.53 |
79.59 |
82.65 |
85.71 |
88.78 |
|
Volume of demand for oil, units |
1067.83 |
1042.28 |
1017.92 |
994.67 |
972.46 |
|
Specific cost of oil, c.u./units |
91.84 |
94.90 |
97.96 |
101.02 |
104.08 |
|
Volume of demand for oil, units |
951.23 |
930.90 |
913.47 |
896.75 |
880.63 |
|
Specific cost of oil, c.u./units |
107.14 |
110.20 |
113.27 |
116.33 |
119.39 |
|
Volume of demand for oil, units |
865.09 |
850.08 |
835.58 |
821.57 |
808.13 |
|
Specific cost of oil, c.u./units |
122.45 |
125.51 |
128.57 |
131.63 |
134.69 |
|
Volume of demand for oil, units |
795.83 |
783.89 |
772.31 |
761.06 |
750.14 |
|
Specific cost of oil, c.u./units |
137.76 |
140.82 |
143.88 |
146.94 |
150.00 |
|
Volume of demand for oil, units |
739.52 |
729.21 |
719.17 |
709.41 |
699.91 |
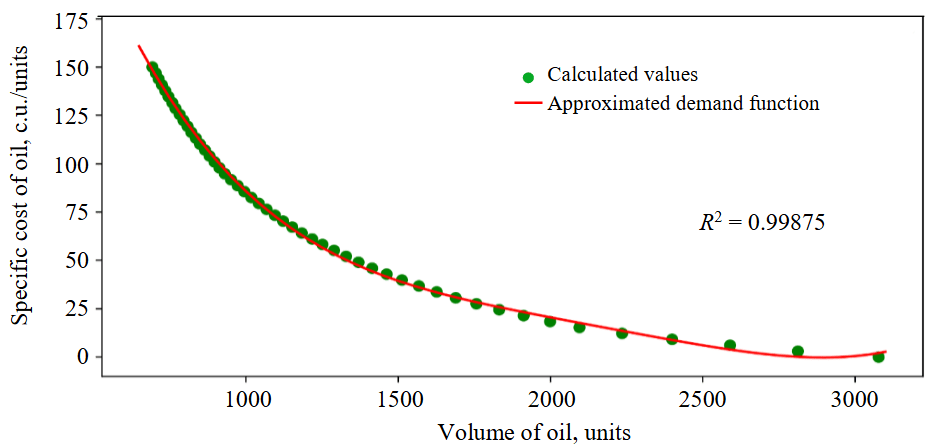
Fig.4. Result of approximating the demand function in oil market for market scenario N 2
Based on presented results (Fig.5, Table 5), the following conclusions can be made:
- Difference between final values of the volumes of produced oil and oil products is negligible, which allows asserting that an equilibrium state was reached between the interconnected markets of raw materials and products in one iteration of the algorithm.
- A decrease in specific operating costs of producer of oil products 5 led to an increase in its competitiveness, which allowed it to restore economically viable production, take a share of the market and resume receiving the economic profit. This result once again demonstrates the ability of the algorithm to reflect market dynamics at the set market structure and characteristics of each player.
- Tatonnement method shows a rapid convergence: the Nash equilibrium for oil market was attained in 79 iterations, and the Nash equilibrium for oil products market in 52 iterations.
Let us also consider the situation when the markets are represented by an unequal number of producers of raw materials and products: three producers of oil products and seven producers of oil (scenario N 3). Let us perform all the steps of the algorithm for finding an equilibrium state between two interconnected markets of oil and oil products. Let us take the values from Table 1 as the initial values for the market scenario. In this case, the markets will include producers of oil products with indices j = 1, 2, 3 (see Table 1), and new oil producers j = 6, 7 with specific operating costs с26 = 90 c.u./units, с27 = 75 c.u./units, correspondingly, will join oil producers with indices j = 1, 2, 3, 4, 5.
As a result of applying the algorithm, the volume of produced oil was Q2 = 792.18 units, and the volume of produced oil products was Q1 = 787.47 units. Difference between the final values of volumes of produced oil and oil products is negligibly small, which allows talking about achieving an equilibrium state between the interconnected markets of raw materials and products in one iteration of the algorithm, and also demonstrates a possibility of its application to market systems with unequal number of players in the markets of raw materials and products.
Table 5
Table 5Market parameters of players in oil and oil products market at reaching the Nash equilibrium for market scenario N 2
|
Name of parameter |
Value |
||||
|
Player’s index |
|||||
|
1 |
2 |
3 |
4 |
5 |
|
|
Raw materials market |
|||||
|
Profit, c.u. |
5194.07 | 557.69 | 16,956.02 | 6684.83 | 2776.04 |
|
Volume of oil produced, units. |
139.68 |
45.77 | 252.38 | 158.47 | 102.12 |
|
Volume of oil produced (total), units |
698.42 |
||||
|
Specific cost of oil, c.u./units |
147.18 | ||||
| Products market | |||||
|
Profit, c.u. |
30,406.85 | 22,682.49 | 7608.08 | 568.42 |
124.66 |
|
Volume of produced oil products, units |
276.31 | 238.65 | 138.21 | 37.78 |
17.69 |
|
Volume of produced oil products (total), units |
708.64 |
||||
|
Specific cost of oil products, c.u./units |
282.23 | ||||
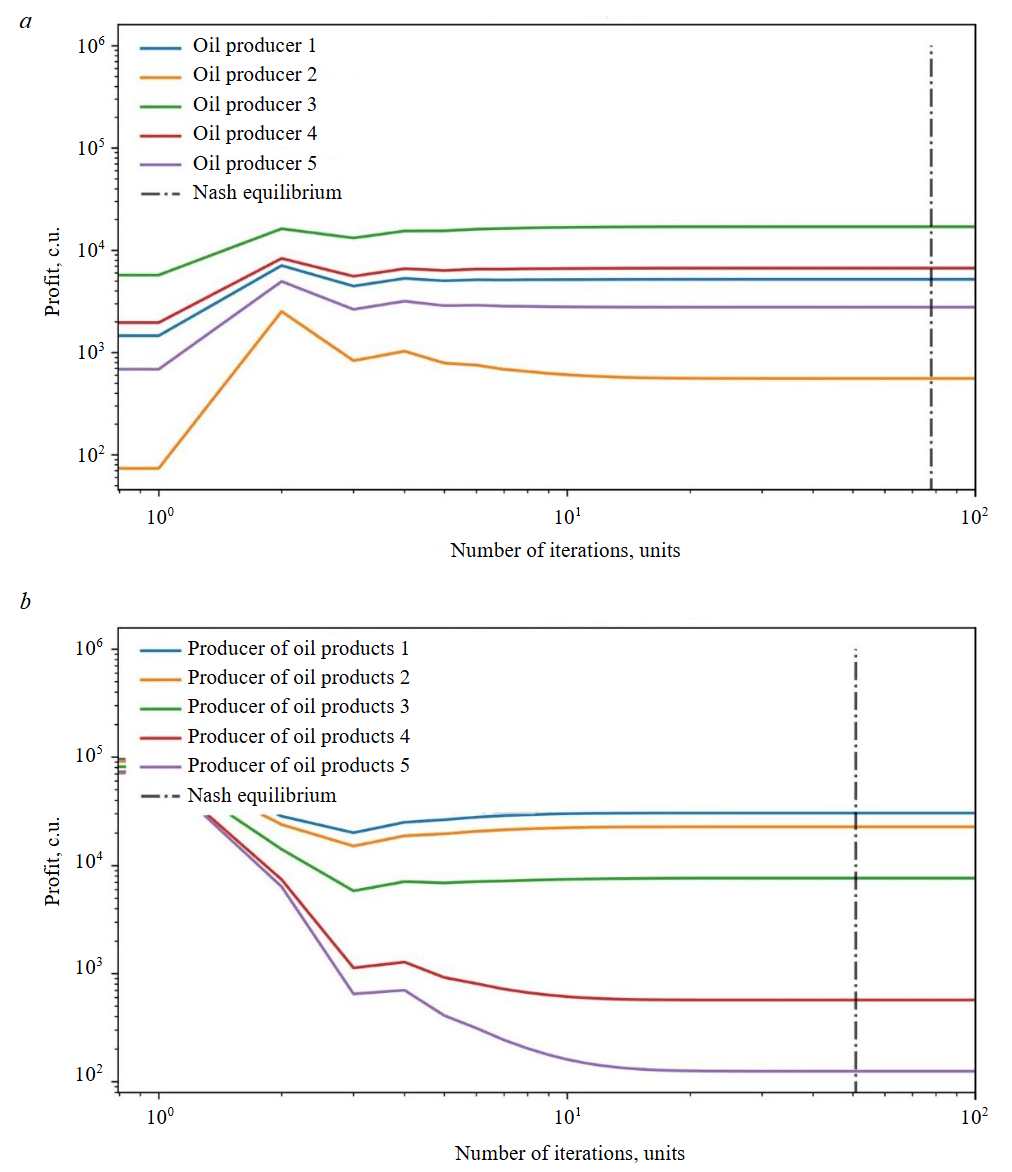
Fig.5. Results of search for the Nash equilibrium for oil – raw materials market (a) and oil products – products market (b) for market scenario N 2
Results
Despite the implicit form of the demand function in raw materials market as well as the complexity of the market system, which consists in participation of producers in both markets at once, the proposed algorithm, which includes the use of the tatonnement method to find the Nash equilibrium for each market and an approach to approximating the demand function, successfully demonstrated its ability to search for an equilibrium state in a system of two interconnected raw materials and products markets. At the same time, the numerical experiments presented in the work demonstrated the following:
- Market dynamics and final position of players in the markets correspond to the set market conditions.
- The proposed algorithm does not lead to instability of the system, despite the complex interaction of markets and players.
- Numerical experiments demonstrate rapid convergence of the proposed algorithm.
- Approach to approximating the demand function in the raw materials market is accurate enough to solve the problem.
Conclusion
The search for an equilibrium state between the interconnected markets of raw materials and products is an important applied task, especially in cases where the markets of strategic goods related to the mineral and raw materials and fuel and energy complexes are considered, which, among other things, can depend not only on the complex market conditions, but also be influenced by external regulatory bodies and geopolitical changes.
The results of numerical experiments at different market scenarios demonstrated the practical significance of the algorithm for optimizing the market strategies of players, planning different measures to improve market competitiveness and production efficiency, and reducing operating costs. The proposed algorithm also allows analysing changes in the system of two interconnected markets as a whole – assessing the influence of markets on each other when the conditions change in one of them.
As a further step, it is proposed to introduce into the algorithm the possibility of taking into account additional factors that can influence the final equilibrium state of the market system, such as carbon regulation, logistics, and various infrastructure risks. This improvement will allow for a more accurate consideration of the features of the complex situation at the market of strategic goods that relate to the mineral and raw materials and fuel and energy complexes. Thus, management decisions that determine the market strategies of the players will be more efficient.
References
- Nan Shang, Yi Ding, Wenqi Cui. Review of Market Power Assessment and Mitigation in Reshaping of Power Systems. Journal of Modern Power Systems and Clean Energy. 2022. Vol. 10, p. 1067-1084.
- Jian-jian Shen, Chun-tian Cheng, Ze-bin Jia et al. Impacts, challenges and suggestions of the electricity market for hydro-dominated power systems in China. Renewable Energy. 2022. Vol. 187, p. 743-759. DOI: 10.1016/j.renene.2022.01.089
- Sharifi R., Anvari-Moghaddam A., Fathi S.H., Vahidinasab V. A bi-level model for strategic bidding of a price-maker retailer with flexible demands in day-ahead electricity market. International Journal of Electrical Power & Energy Systems. 2020. Vol. 121. N 106065. DOI: 10.1016/j.ijepes.2020.106065
- Eaton J., Jinkins D., Tybout J.R., Daniel Xu. Two-Sided Search in International Markets. National Bureau of Economic Research Working Paper Series, 2022. N 29684.
- Forrest J.Y.-L., Buttermore J., Wajda T.A. At Nash equilibrium when new market competitions appear? Kybernetes. 2017. Vol. 46. Iss. 2, p. 256-271. DOI: 10.1108/K-11-2016-0311
- Rajabi N., Mozafari M., Naimi-Sadigh A. Bi-level pricing and inventory strategies for perishable products in a competitive supply chain. RAIRO – Operations Research. 2021. Vol. 55. N 4, p. 2395-2412. DOI: 10.1051/ro/2021106
- Nezarat A., Dastghaibifard G.H. Efficient Nash Equilibrium Resource Allocation Based on Game Theory Mechanism in Cloud Computing by Using Auction. PLOS ONE. 2015. Vol. 10 (10). N e0138424. DOI: 10.1371/journal.pone.0138424
- Azevedo E.M., Gottlieb D. Perfect Competition in Markets with Adverse Selection. Econometrica. 2017. Vol. 85. Iss. 1, p. 67-105. DOI: 10.3982/ECTA13434
- Xiu Ji, Cong Li, Dexin Li, Chenglong Qi. Bidding Strategy of Two-Layer Optimization Model for Electricity Market Considering Renewable Energy Based on Deep Reinforcement Learning. Electronics. 2022. Vol. 11. Iss. 19. N 3107. DOI: 10.3390/electronics11193107
- Liying Yu, Peng Wang, Zhe Chen et al. Finding Nash equilibrium based on reinforcement learning for bidding strategy and distri-buted algorithm for ISO in imperfect electricity market. Applied Energy. 2023. Vol. 350. N 121704. DOI: 10.1016/j.apenergy.2023.121704
- Haibing Wang, Jian Deng, Chengmin Wang et al. Comparing Competition Equilibrium with Nash Equilibrium in Electric Power Market. CSEE Journal of Power and Energy Systems. 2018. Vol. 4. N 3, p. 299-304. DOI: 10.17775/CSEEJPES.2015.01140
- Frąckiewicz P., Szopa M., Makowski M., Piotrowski E. Nash Equilibria of Quantum Games in the Special Two-Parameter Strategy Space. Applied Sciences. 2022. Vol. 12. Iss. 22. N 11530. DOI: 10.3390/app122211530
- Zhenxing Lei, Mingbo Liu, Zhijun Shen et al. A Nash–Stackelberg game approach to analyze strategic bidding for multiple DER aggregators in electricity markets. Sustainable Energy, Grids and Networks. 2023. Vol. 35. N 101111. DOI: 10.1016/j.segan.2023.101111
- O’Shaughnessy E., Sumner J. The need for better insights into voluntary renewable energy markets. Frontiers in Sustainable Energy Policy. 2023. Vol. 2. N 1174427. DOI: 10.3389/fsuep.2023.1174427
- Acemoglu D., Kakhbod A., Ozdaglar A. Competition in Electricity Markets with Renewable Energy Sources. The Energy Journal. 2017. Vol. 38. Suppl. 1, p. 137-155. DOI: 10.5547/01956574.38.SI1.dace
- Yujing Huang, Yudong Wang, Nian Liu. A two-stage energy management for heat-electricity integrated energy system considering dynamic pricing of Stackelberg game and operation strategy optimization. Energy. 2022. Vol. 244. Part A. N 122576. DOI: 10.1016/j.energy.2021.122576
- Yanchang Liang, Chunlin Guo, Zhaohao Ding, Huichun Hua. Agent-Based Modeling in Electricity Market Using Deep Deterministic Policy Gradient Algorithm. IEEE Transactions on Power Systems. 2020. Vol. 35. Iss. 6, p. 4180-4192. DOI: 10.1109/TPWRS.2020.2999536
- Barrett S., Dannenberg A. Tipping Versus Cooperating to Supply a Public Good. Journal of the European Economic Association. 2017. Vol. 15. Iss. 4, p. 910-941. DOI: 10.1093/jeea/jvw022
- Yujiao Liu, Yan Li, Yiping Rong et al. Benefit allocation of electricity–gas–heat–hydrogen integrated energy system based on Shapley value. Clean Energy. 2023. Vol. 7. Iss. 6, p. 1381-1390. DOI: 10.1093/ce/zkad062
- Pfeifer A., Feijoo F., Duić N. Fast energy transition as a best strategy for all? The nash equilibrium of long-term energy planning strategies in coupled power markets. Energy. 2023. Vol. 284. N 129109. DOI: 10.1016/j.energy.2023.129109
- Hannafey K. Modeling the Stock Market Through Game Theory: Thesis submitted in partial fulfillment of the requirements for Honors in Mathematical Science. Georgia Southern University, 2021. N 590, p. 35.
- Samuelson L. Game Theory in Economics and Beyond. Journal of Economic Perspectives. 2016. Vol. 30. N 4, p. 107-130.
- Dong Xie, Mingbo Liu, Lixin Xu, Wentian Lu. Generalized Nash equilibrium analysis of transmission and distribution coordination in coexistence of centralized and local markets. International Journal of Electrical Power & Energy Systems. 2022. Vol. 137. N 107762. DOI: 10.1016/j.ijepes.2021.107762
- Michelacakis N.J. Nash versus consistent equilibrium: A comparative perspective on a mixed duopoly location model of spatial price discrimination with delegation. Regional Science and Urban Economics. 2023. Vol. 99. N 103860. DOI: 10.1016/j.regsciurbeco.2022.103860
- Xiangge Luo, Schied A. Nash Equilibrium for Risk-Averse Investors in a Market Impact Game with Transient Price Impact. Market Microstructure and Liquidity. 2019. Vol. 5. N 01n04. N 2050001. DOI: 10.1142/S238262662050001X
- Yongchao Liu, Huifu Xu, Shu-Jung Sunny Yang, Jin Zhang. Distributionally robust equilibrium for continuous games: Nash and Stackelberg models. European Journal of Operational Research. 2018. Vol. 265. Iss. 2, p. 631-643. DOI: 10.1016/j.ejor.2017.07.050
- Yongtao Peng, Dan Xu, Yaya Li, Kun Wang. A Product Service Supply Chain Network Equilibrium Model considering Capacity Constraints. Mathematical Problems in Engineering. 2020. Vol. 2020. Iss. 1. N 295072. DOI: 10.1155/2020/1295072
- Xiao Chen, Choi J.H., Larsen K., Seppi D.J. Price impact in Nash equilibria. Finance and Stochastics. 2023. Vol. 27. Iss. 2, p. 305-340. DOI: 10.1007/s00780-023-00499-w
- Pin-bo Chen, Gui-hua Lin, Weina Xu, Xide Zhu. Supply chain network equilibrium with outsourcing for fresh agricultural products under stochastic demands. IMA Journal of Management Mathematics. 2024. N dpae024. DOI: 10.1093/imaman/dpae024
- Collard-Wexler A., Gowrisankaran G., Lee R.S. “Nash-in-Nash” Bargaining: A Microfoundation for Applied Work. Journal of Political Economy. 2019. Vol. 127. N 1, p. 163-195. DOI: 10.1086/700729
- Zhaohua Chen, Xiaotie Deng, Wenhan Huang et al. On tightness of Tsaknakis-Spirakis descent methods for approximate Nash equilibria. Information and Computation. 2023. Vol. 293. N 105046. DOI: 10.1016/j.ic.2023.105046
- Huilin Yao, Rizhao Gong, Zhihui Yuan. Multi-Oligopoly Sequential Pricing Mechanisms and Their Game Analysis in Raw Material Supply Chains. Sustainability. 2022. Vol. 14. Iss. 23. N 16231. DOI: 10.3390/su142316231
- Pangallo M., Heinrich T., Farmer J.D. Best reply structure and equilibrium convergence in generic games. Science Advances. 2019. Vol. 5. Iss. 2. N eaat1328. DOI: 10.1126/sciadv.aat1328
- Bosshard V., Bünz B., Lubin B., Seuken S. Computing Bayes-Nash Equilibria in Combinatorial Auctions with Verification. Journal of Artificial Intelligence Research. 2020. Vol. 69, p. 531-570. DOI: 10.1613/jair.1.11525