Identification of subaerial taliks by geophysical methods in the middle part of the Lena River basin, Central Yakutia
- 1 — Ph.D., Dr.Sci. Leading Engineer VNIIOkeangeologia ▪ Orcid
- 2 — Ph.D. Associate Professor Saint Petersburg State University ▪ Orcid
- 3 — Leading Geophysicist GeophysPoisk LLC
- 4 — Student Saint Petersburg State University
- 5 — Ph.D. Leading Researcher Melnikov Permafrost Institute SB RAS ▪ Orcid
Abstract
In autumn 2023, comprehensive geophysical surveys were conducted in the experimental section of the Shestakovka River basin (Central Yakutia) to identify structural features of the near-surface part of the geological section, in particular permafrost rocks and talik zones. The work objectives included ground penetrating radar (GPR) studies and electrical resistivity survey. Drilling and well temperature logging data were used in the interpretation. The work is relevant due to the importance of studying the processes occurring in the cryolithic zone due to global climate change, and the novelty lies in clarifying the structure of the study area. The average permittivity of rocks across the section on the right and left banks of the river is 15.5 and 6.9, respectively. The differences are due to moisture saturation and the degree of soil freezing. The depth of the talik base on the right bank of the river is from 2 to 14 m with an average value of 6.1 m. On the left bank of the river, it varies from 3 to 7.1 m with an average value of 4.2 m. According to electrical exploration, the medium is a four-layer section. The upper layer about 2 m thick is the most heterogeneous in electrical resistivity and corresponds to seasonally frozen soils. The base of the underlying talik on the geoelectric section is traced at a depth of 4 to 7 m, which is consistent with drilling and GPR data. The third high-resistivity layer corresponds to permafrost rocks. The electrical resistivity in them increases by an order of magnitude compared to the talik zone and is about 2000 Ohm·m against the background of 100-270 Ohm·m. The underlying lower layer is characterized by a decrease in electrical resistivity to 220 Ohm·m, which may be associated with a change in the lithological composition or with the groundwater circulation.
The work was carried out with the financial support of a grant from the Russian Science Foundation and the Yakut Science Foundation under the project N 22-17-20040 “Subaerial and sublacustrine taliks in the continuous cryolithic zone of Eastern Siberia: origin, current state, and response to climate change”.
Introduction
The cryolithic zone covers approximately 65 % of the Russian Federation, occupying almost all of Siberia, and current global climate change causes its gradual degradation [1]. This results in adverse consequences [2], one of which is the activation of thermokarst and thermal erosion [3], which sometimes leads to significant soil subsidence [4, 5]. Even minor deformations associated with the expansion of water during freezing cause premature destruction of infrastructure – capital structures, roads, and railways [6, 7]. Another equally important question is a potential pandemic caused by the possible emergence of ancient bacteria that had previously been dormant [8, 9]. A comprehensive study of the cryolithic zone, including its gradual degradation due to climate change, is an urgent task facing world science [10, 11]. In this regard, temperature monitoring is necessary [12-14].
Taliks, an important part of the cryolithic zone, are rock masses in a thawed state that exist continuously for more than one year and are surrounded by permafrost [15, 16]. Interest in them is due, on the one hand, to a direct connection with changes in the cryolithic zone, and on the other hand, to the fact that they are the only ways of feeding and discharging groundwater. The distribution of taliks and their dynamics are studied little. However, the study of this phenomenon, understanding its development in modern conditions will allow us to better understand and predict the reaction of the cryolithic zone and the complex permafrost hydrogeological system to the ongoing changes in the natural environment.
The basis for studying the distribution of taliks, in addition to temperature monitoring in wells, are geophysical methods – GPR and electrical exploration. Their advantage is the effective study of the upper geological section over a large area without disturbing the ground cover continuity, which is important for preserving the tundra. GPR is actively used to detect, study, and map taliks of various genesis and configurations, while being the least labour-intensive geophysical technique [17-19]. The method is based on the differences in the permittivity of rocks in the frozen and thawed state. In addition, GPR has shown exceptional efficiency in engineering surveys in the polar regions [20]. Many studies demonstrate its great potential in studying the cryolithic zone [21-23]. GPR is applicable for assessing the depth of thawing and moisture volume of the seasonally thawed layer [24-26]. Electrical exploration methods have also proven their effectiveness for studying the cryolithic zone, in particular taliks [27-29], due to the contrasting differences in electrical resistivity between frozen and thawed rocks. Electrical exploration is actively used to monitor the development of frozen rock areas [17, 30].
The importance of studying the processes occurring in the cryolithic zone is reflected in the ”Strategy for the Development of the Arctic Zone of the Russian Federation and Ensuring National Security until 2035”, approved by the Decree of the President of the Russian Federation of 26.10.2020 N 645, as well as in the Resolution of the Government of the Russian Federation of 01.11.2023 N 1831 ”On Amendments to the Resolution of the Government of the Russian Federation of August 9, 2013 N 681”. The Resolution indicates the creation of “state background monitoring of the permafrost”. To implement the task, the Arctic and Antarctic Research Institute has developed a corresponding program and obtained the first significant results [31, 32].
The article presents the results of geophysical studies carried out in 2023 during field work in the Shestakovka River basin (Central Yakutia). They were conducted to identify the structural features of the near-surface part of the geological section – permafrost rocks and talik zones.
Study target
The experimental site Levaya Shestakovka of the Melnikov Permafrost Institute SB RAS occupies an area of about 1 km2 (Fig.1) and is in the Shestakovka River basin, a small left tributary of the Lena River, on a gentle slope of a denudation plain with absolute heights of 190-210 m. The climate is sharply continental and harsh, the average annual ambient air temperature is –9.5 °C, the average long-term temperature in January is –40.5 °C, and in July +19.1 °C [33].
According to published data, the upper section to a depth of 30 m is presented by loose sandy deposits with rare clay interlayers. On watersheds and slopes, sands are fine- and medium-grained. Their moisture volume content in the aeration zone does not exceed 2-8 % with a porosity of 33-35 %. Sandy deposits are usually covered by a topsoil consisting of moss, lichens, turf, and forest litter.
The layer thickness can reach 30 cm [33, 35]. Non-stationary frozen strata are present in the study area. Their thickness reaches half a kilometre; the temperature of rocks at a depth of 100 m ranges from –1.0 to –0.6 °C [15]. The thickness of the seasonally thawed layer varies from 0.5 m on marshes to 3 m on gentle slopes and watersheds covered with pine forest [36]. Recent studies have found a suprapermafrost subaerial aquifer talik 180-200 m wide and over 500 m long in the study area. According to geophysical data, its thickness reaches 20 m [35]. Thus, the area is very promising for studying taliks, and the presence of temperature monitoring wells (Fig.1) opens up great opportunities for verifying geophysical data and broad prospects for subsequent mathematical mo-delling [37-39].
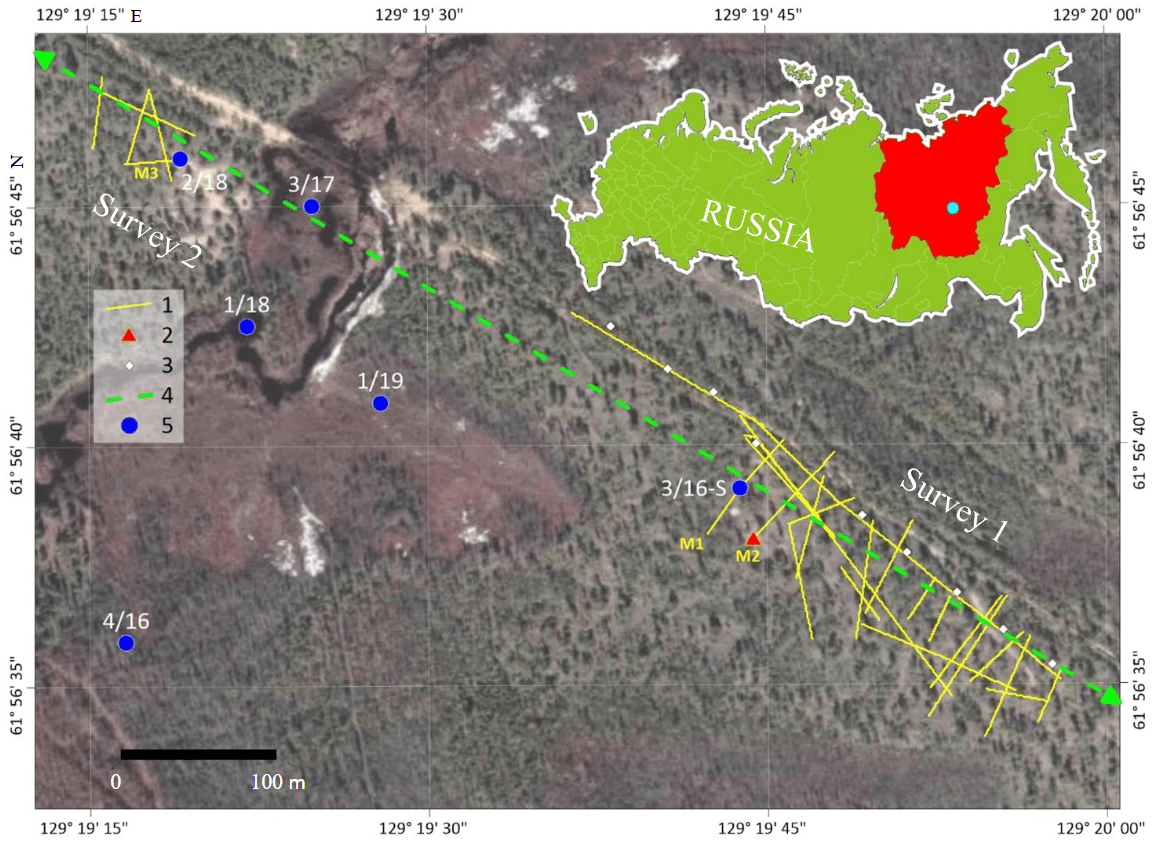
Fig.1. Layout of the work area at the Levaya Shestakovka site [34]
1 – GPR routes; 2 – CDP point; 3 – VES points; 4 – fragment of the electrical resistivity tomography line [35]; 5 – position of temperature monitoring wells
Methods
To solve the set task, integrated geophysical surveys were performed from 29 August to 4 September 2023, at the thawed rocks manifestation site in the Shestakovka River area: GPR profiling, common depth point (CDP), and vertical electric sounding (VES). The work layout is given in Fig.1 [34].
The GPR profiling was preceded by a CDP survey to determine the environmental kinematics and subsequent conversion of time sections to depth sections. The survey was performed by the OKO-2 GPR (LOGIS LLC, Russia) with AB-150 extendable antennas (central frequency 150 MHz) using the standard technique [34] described in [18]. The device design assumes the presence of a fibre-optic cable connecting both antennas. A 10 m long cable was used, which determined the maximum length of the arrangement. According to work experience, based on the equipment used, satisfactory results were achieved with a spacing step of 20 cm, i.e. 10 cm in each direction. The maximum distance between the antennas was 7.65 m. The work process is shown in Fig.2, a.
After completing the CDP stage, the team began GPR profiling, first on the right bank of the Shestakovka River, and then on the left one. The survey was performed by the Triton-M GPR (LOGIS LLC, Russia), with a central frequency of 100 MHz. The new Triton-M GPR was tested for the first time in permafrost conditions. The shape and structure of the antenna (an extendable flexible monoski) allow it to be moved along a forested surface and easily go around small obstacles. The advantages also include the absence of cables and other connections that significantly complicate work in the taiga and dense vegetation areas. The autonomous recording and control unit is connected to a laptop via Wi-Fi. After conducting several test routes, we found that the optimal scan for obtaining registered feature limits is 400 ns. The survey was carried out on foot, in a continuous mode at a constant pace. The spatial positioning was performed using the Garmin GPSMap64 satellite receiver (Garmin Ltd., USA). The route straightness was achieved by setting visible landmarks on the ground. A total of 29 GPR routes with a total length of 2.7 km were completed (see Fig.1). The execution is shown in Fig.2, b. The GPR data were processed using the standard methodology described in [22, 26, 35], in the GeoScan32 (LOGIS LLC, Russia) and Prism2 (Radar Systems, Inc., Latvia) software. As a result, the depths of the feature limits were obtained [34].
The 396 m long VES line passed along one of the GPR routes (see Fig.1), as well as along the geoelectric line completed in 2016 [35]. An SGD-EGC200 SKAT IV SGFP 420.00.00 geoelectrical transmitter and an SGD-EEM MEDUSA-B2 SGFP 221.00.00-02 geoelectrical receiver, version V2.18 (SibGeofizPribor SPC, Russia) were used. The measurements were performed by a four-electrode symmetrical AMNB array (Schlumberger array). Ten observation points with a step of 50 m were acquired on the VES line. The maximum spacings were 100 m, which ensured a sounding depth of approximately 20 m. The feeder line spacings (AB/2) were 1.5; 2; 3; 4; 6; 9; 11; 15; 20; 25; 30; 40 and 50 m. The spatial positioning of the route ends was performed using the Garmin GPSMap64 satellite receiver. The electrode spacings were set using a measuring geodetic tape. The electrical exploration process is shown in Fig.2, c. The VES data were processed in the ZondIP1d software (Zond Software LTD, Cyprus). As a result, we obtained the electrical resistance values, as well as the depths of the upper and lower limits of electrically homogeneous layers.
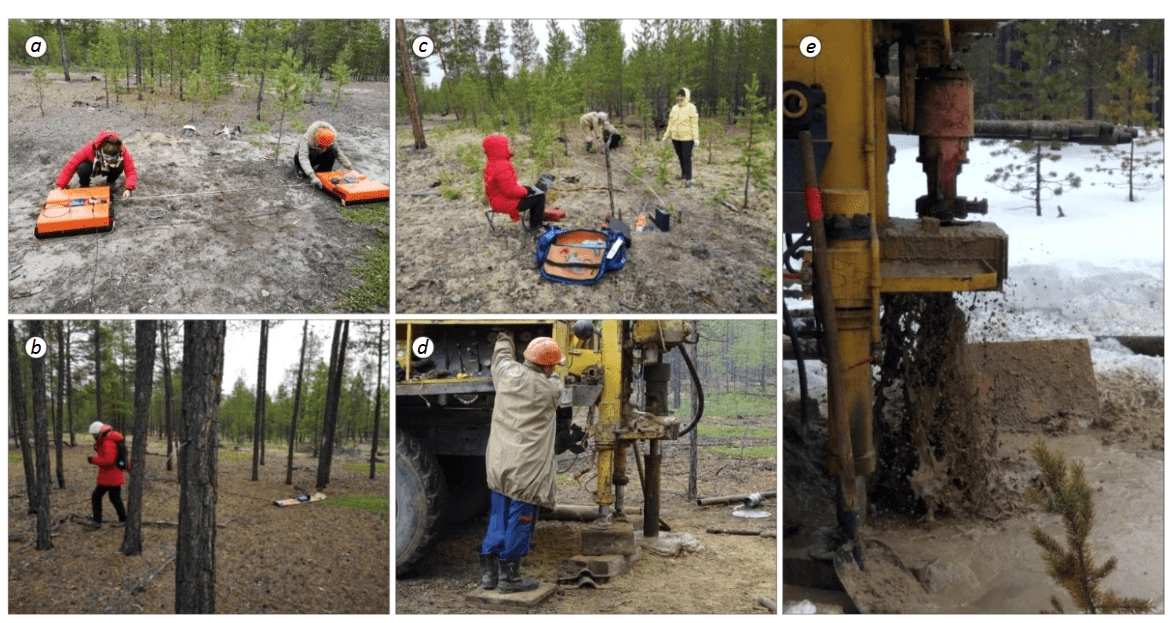
Fig.2. Progress of CDP (a), GPR (b), electrical exploration (c), drilling (d) and a fountain of water gushing from a drilled well (e)
Results
According to the recommendations [18] and experience of similar works, in order to obtain the highest quality results, CDP should be performed along a line with a near-horizontal occurrence of feature limits. It was most correct to arrange the works near well 3/16-S (see Fig.1) for subsequent comparison. However, the feature limits in the area have a quite uneven shape (Fig.3, a), so we were unable to obtain high-quality CDP data. The optimal place for the works was found 35 m from the well (see Fig.1). The GPR time section along the CDP line is shown in Fig.3, b. The lines are typical of this area.
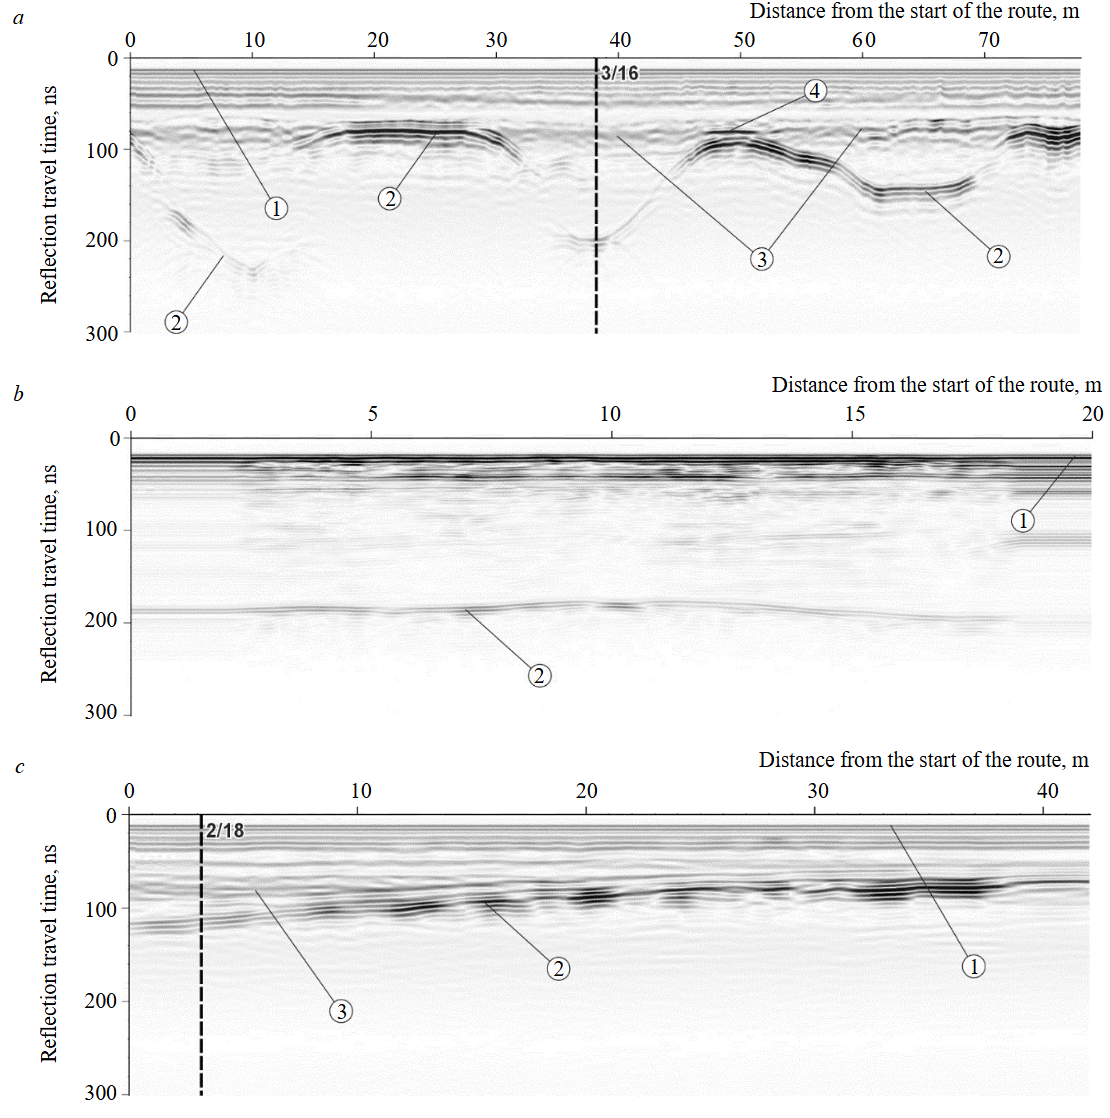
Fig.3. GPR time sections along lines M1 (a), M2 (b), M3 (c) (see Fig.1)
1 – direct wave; 2 – reflections from the talik base; 3 – reflections associated with the seasonally frozen layer; 4 – frozen fragments of sand deposits, or ice lenses; the vertical dotted lines show the position of temperature monitoring wells
Direct wave 1 and intense reflection 2 are clearly visible in the lines. The frozen sand deposits permittivity ranges from 2.5 to 5, depending on the ice content, and that of the same rocks in the thawed state ranges from 4 to 25, depending on the humidity [40]. According to field observations, the talik sand deposits humidity is 17-20 %, but may also exceed these values [16, 31]. Consequently, the reflection coefficient from the interface between permafrost rocks and talik is quite high, which is expressed by contrasting reflection 2 on the GPR time section.
In addition to reflections 1 and 2, the sections show a mostly nearhorizontal and low-intensity reflection 3, which may be associated with the limit of seasonally frozen rocks and the talik [16]. This thin layer, to 2 m, is characterized by relatively low humidity amounting to 5-7 % [20, 35]. Thus, the presence of a humidity gradient causes the appearance of interface 3. In some areas, it is complicated by contrasting reflections 4, which can probably be associated with frozen fragments of sandy deposits that did not have time to thaw during the warm summer months, or ice lenses. Their permittivity is significantly less than that of wet rocks of the talik [40]. If the said frozen fragments are thin, this leads to reverberation observed in the sections.
Based on the above, it is advisable to consider a two-layer medium in further estimations. Figure 4, a shows the observed CDP travel time curve obtained during field work, as well as the result of selecting a theoretical travel time curve. Data were processed in the author’s Gaea software within the framework of an inclined-layered medium model, the mathematical description of which is given in [41]. Travel time curves were selected for the interfaces between the seasonally thawed layer and talik 2, as well as talik and permafrost rocks 3. They correspond to effective values of permittivity of 10 and 63 in the depth range of 0-2.2 and 2.2-4.7 m (Fig.4, b). The ray path is given in Fig.4, c. At first glance, the permittivity value equal to 63 seems overestimated. However, the drilling results (see Fig.2, d) reveal a high water content of individual horizons. We reasonably assumed that the water content can vary greatly within the talik, which, in turn, will lead to a change in permittivity over a wide range of values.
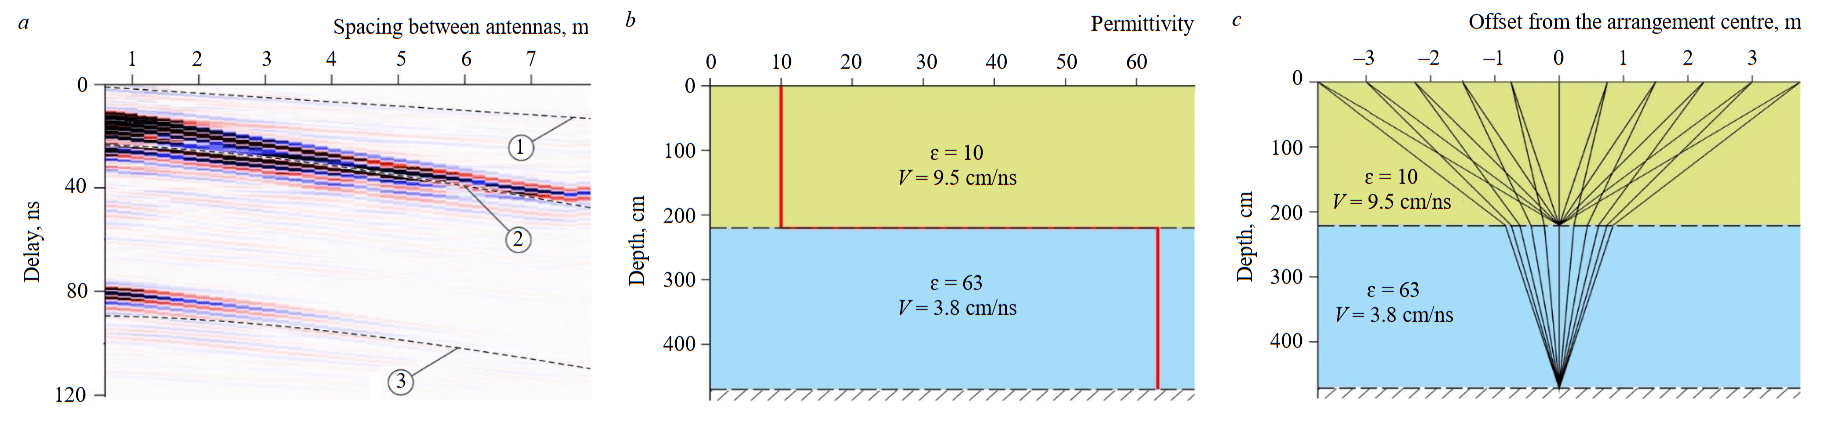
Fig.4. Results of CDP soundings: observed and theoretical travel time curves (a), dielectric model of the medium (b), ray path (c)
1 – direct wave; 2 – talik roof; 3 – talik base
The GPR time section (see Fig.3, a) shows the position of well 3/16-S, in which temperature monitoring has been carried out for many years [36]. If we proceed from the fact that reflection 2 is associated with the interface between the talik and permafrost, then its depth can also be determined from the temperature logging data at the date of profiling (3 September 2023). It will correspond to the phase transition temperature. The data show that the limit with permafrost is at a depth of 7.1 m. Therefore, the average permittivity of the medium along the section is 15.5. If we apply the CDP parameters, then the interface depth will be 5.3 m, which is almost one and a half times less. Due to significant discrepancies in the study, a permittivity value of 15.5 was adopted for both media.
During the GPR studies on the opposite (left) bank of the river, one of the routes passed near well 2/18 (see Fig.1). The GPR time section is shown in Fig.3, c. At the time of the work (15:00, 03.09.2023), according to temperature measurements, the interface was at a depth of 5.6 m. After similar estimations, a permittivity value of 6.9 was obtained, which was adopted for this survey.
The depth diagrams of the talik roof (i.e. the lower limit of the seasonally frozen layer) and its base for both surveys are shown in Fig.5. They are constructed in Surfer 23.3 mapping software (Golden Software Inc., USA). Gridding was made by the Inverse Distance method with an averaging radius of 18 m and a cell size of 5×5 m. The grid error was determined as the standard deviation N of measurements zi from the grid values at the same point:
For the first survey of the talik roof, σ is ±0.1 and ±0.6 m for its base. For the second survey, σ for both the talik roof and base is ±0.1 m.
The most suitable conditions for performing VES are media with near-horizontal feature limits. However, since the authors sought to conduct comprehensive studies, this line passed along one of the longest GPR routes, as well as in the immediate vicinity of previous electrical resistivity tomography line [35] (see Fig.1). The VES data in the form of a block model of the electrical resistivity distribution are combined with the GPR section to better see the correlation (Fig.6, a). Figure 6, b shows the same block model plotted on the geoelectric section obtained by the electrical resistivity tomography [35].
Discussion
We should note that it was impossible to select theoretical travel time curves well. Therefore, Fig.4, a presents the most acceptable case. The reasons for this are in the dielectric anisotropy of the medium, since even a small change in its humidity leads to significant variations. This is confirmed by theoretical computations. There is a dependence of sand deposits permittivity ε˜ on humidity ω, evaluated based on the Looyenga formula [42] for a two-component medium, while it is assumed that water inclusions have a spherical shape:
where εw and εsk are the permittivities of water and dry sand (skeleton), εsk ≈ 4 [39].
The permittivity of water depends to a large extent on temperature. In the seasonally thawed layer, it varies within very wide limits from the phase transition temperature at the top of the talik to one close to the ambient air temperature and can reach 15 °C or more in the near-surface part [33, 35, 36]. In [43], it is provided an empirical relationship between the permittivity of water and its temperature θ:
Similar values can be obtained using the Chernyak empirical formula [44]:
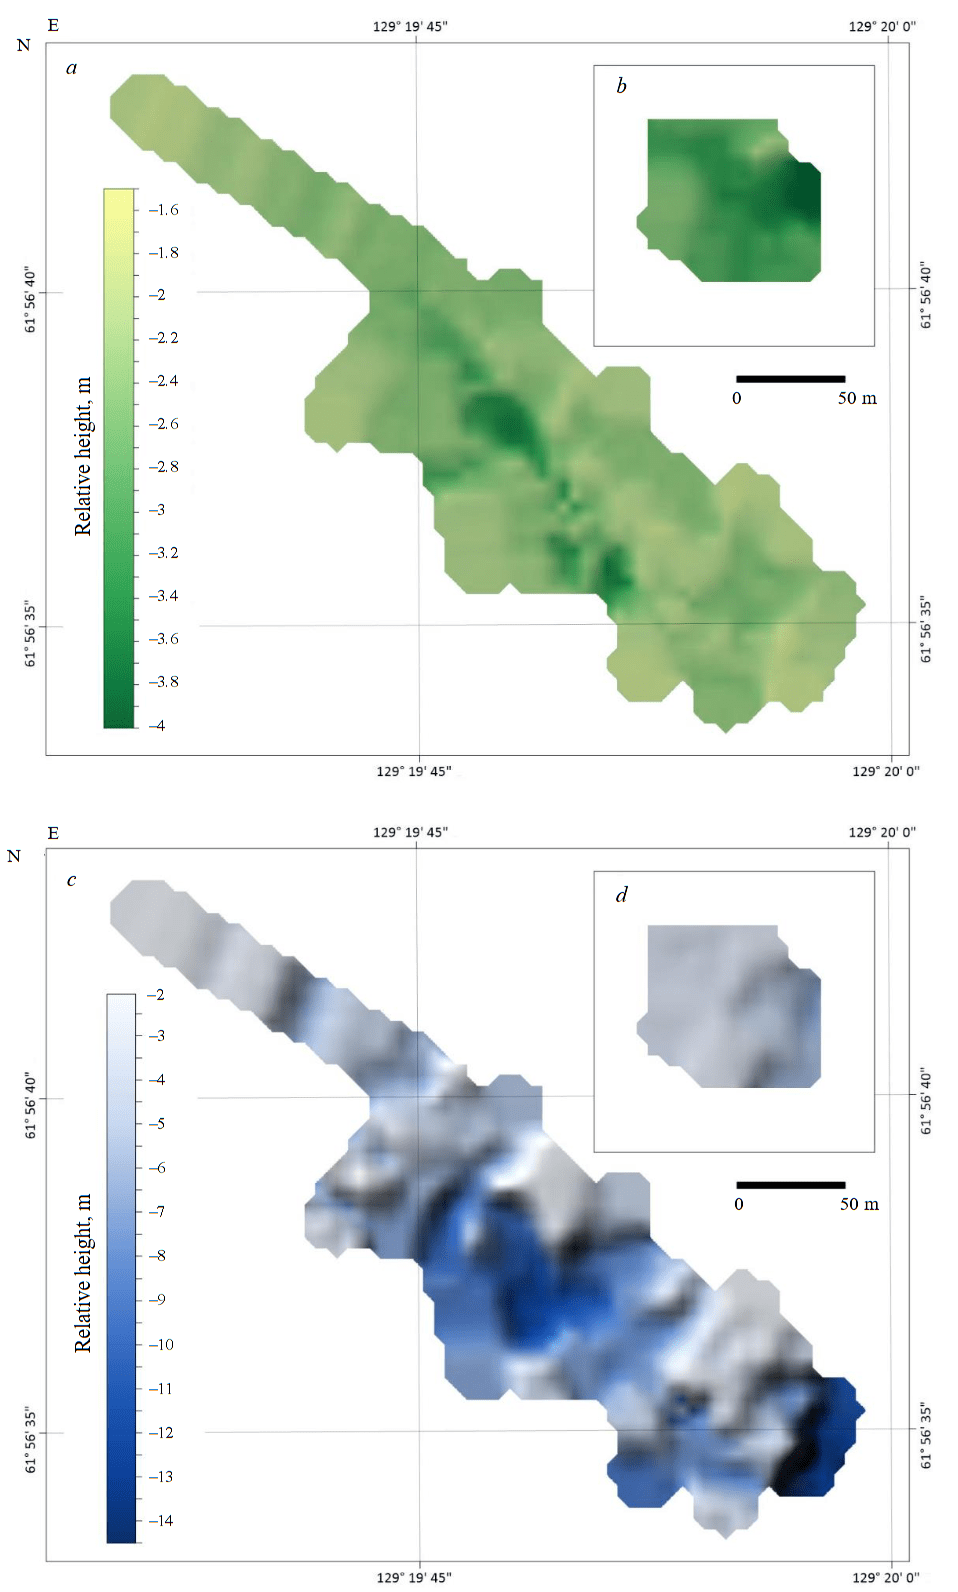
Fig.5. Relative height of the talik roof position on the right (a) and left (b) banks of the Shestakovka River, as well as its base on the right (c) and left (d) banks [34]
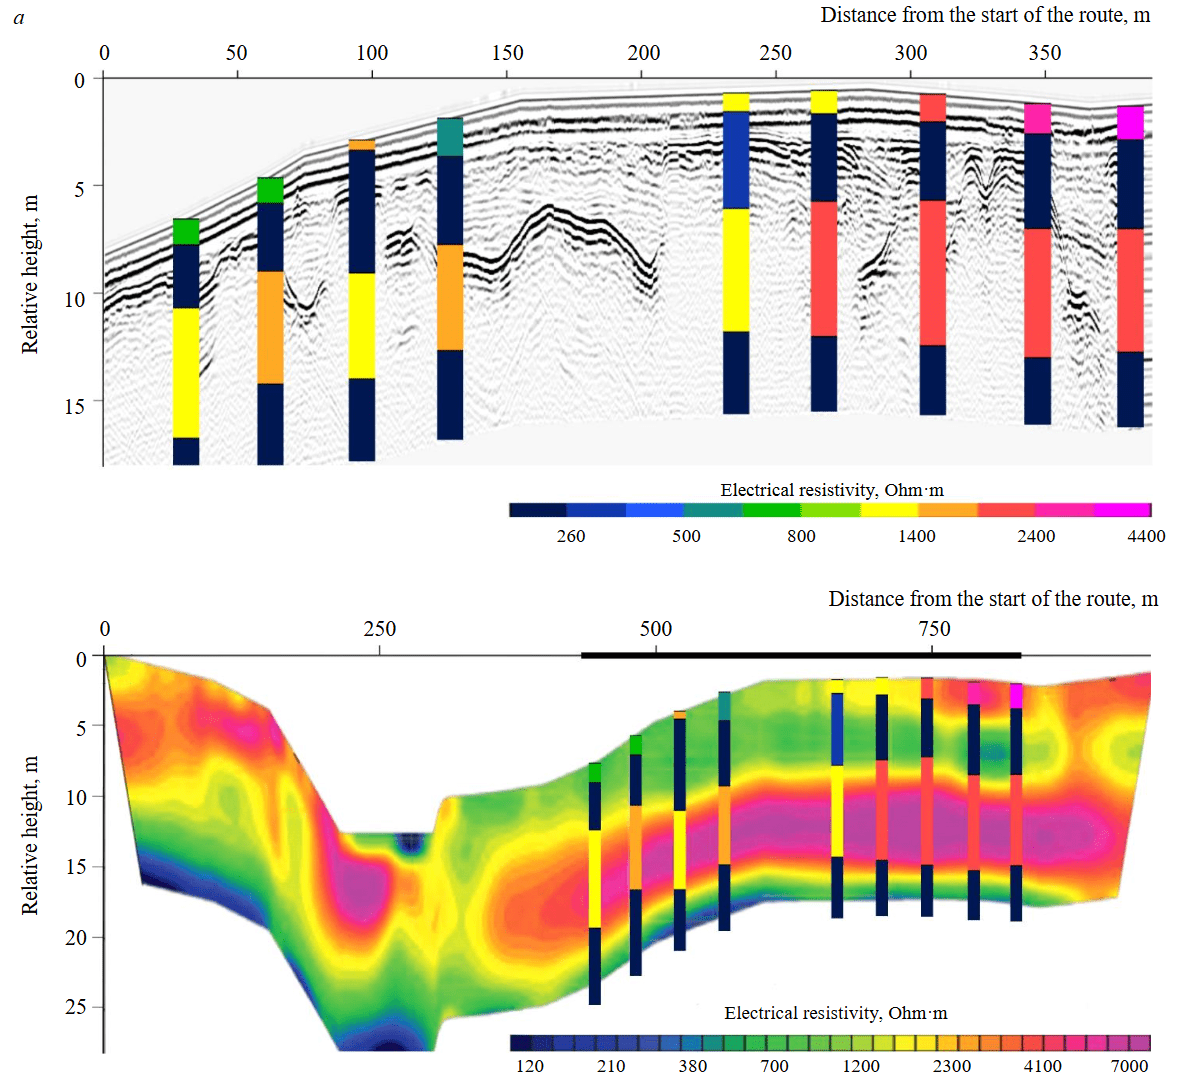
Fig.6. Results of the VES measurements combined with a GPR (a) and geoelectric (b) section obtained by the electrical resistivity tomography during previous studies [35].
The thickened line in Fig. b shows the position of the line given in Fig. a
Both dependences are shown in Fig.7, a. In the indicated temperature range, εw changes on average from 82 (for 15 °C) to 88 (for 0 °C), which is about 7 %. The soil permittivity for two εw is shown in Fig.7, b. From Fig.7 it follows that a change in soil moisture content from 0 to 10 % leads to variations in the permittivity from 4 (dry soil) to 6.4 (for 15 °C) and 6.6 (for 0 °C), i.e. by 3 %. For water-saturated soil with a moisture content of about 30 %, the spread increases several times and is 13.9 (for 15 °C) and 14.6 (for 0 °C).
Thus, in spring and autumn during the day, despite the geological homogeneity of the soil, due to the shadow of trees, the presence of even minor differences in the ground cover (which affect the heat propagation into the soil [34, 37, 45]), the dielectric heterogeneity of the surface layer may be significant. This explains the difficulties in the CDP data processing.
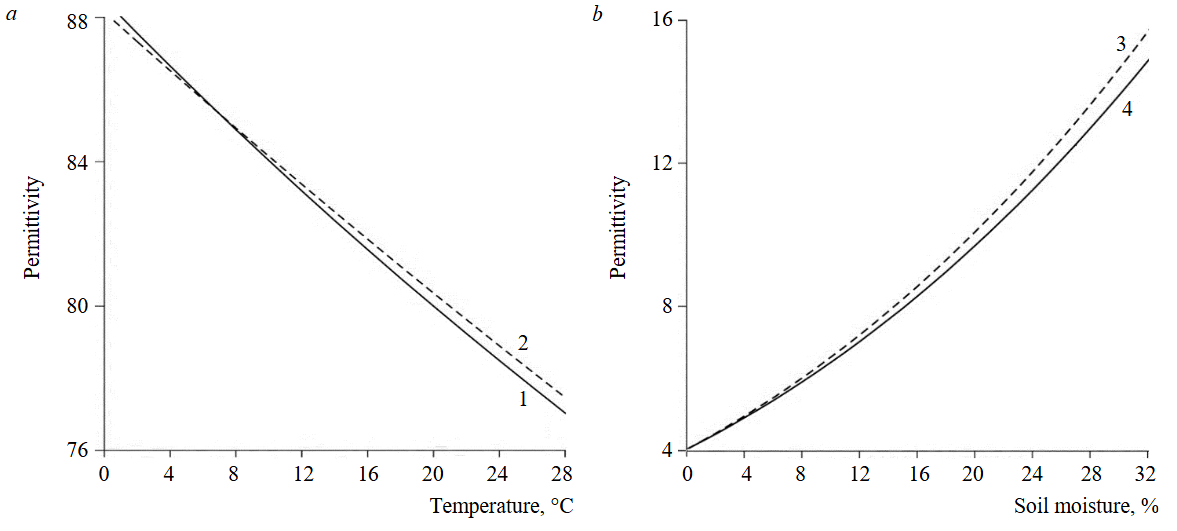
Fig.7. Permittivity of water from temperature (a) and sand deposits from moisture (b)
1 – according to model [44]; 2 – according to model [43]; 3 – at water temperature of 0 °C; 4 – at water temperature of 15 °C
Referring to the GPR survey results, it should be noted that, according to Fig.5, a, the depth of the seasonally frozen layer on the right bank of the Shestakovka River (survey 1) is on average about 2.3 m and varies between 1.8 and 3.7 m. A significant deepening of the layer is observed in the central and southern parts, where open terrains predominate. The talik completely occupies the entire survey area (see Fig.5, c). Its roof is marked by the base of the seasonally frozen layer (see Fig.5, a), and the base is in the depth range from 2 to 14 m with an average value of 6.1 m. Negative talik topographies and the deepest areas are also in the central, southern, and eastern parts of the survey. In general, they, like the seasonally frozen layer topography, correlate with open terrains. This can be explained as follows. Based on the mathematical modelling [33] performed using the author’s FrozenSoil software and a database of thermal and mechanical properties of soils, rocks, ground layer, snow, firn, and ice, one may assume that open terrains composed of sandy deposits, on which there is practically no ground layer of moss, are characterized by a gradual degradation of the cryolithic zone caused by an increase in the talik thickness. The presence of trees, shrubs, and ground cover reduces the flow of solar heat falling on the surface and passing into the soil. This, in turn, prevents the progressive development of the talik, and with high density of vegetation even leads to its degradation [34].
As follows from Fig.5, b, the depth of the seasonally frozen layer on the left bank of the Shestakovka River (survey 2) is on average about 3 m and varies between 2 and 4 m. The layer deepens in the eastern part, which is confined to the slope. The talik completely occupies the eastern plot of the survey and part of the western one (see Fig.5, d). Its base is in the depth range from 3 to 7.1 m with an average value of 4.2 m. The greatest thickness of the talik and its deepest sections are in the slope part and, just as on the opposite bank of the Shestakovka River, are confined to open terrains. In addition, the topography has an effect on the degradation of the cryolithic zone, but this issue has not been studied in detail [34].
The results obtained during electrical exploration indicate that electrical properties in the section with the line are heterogeneous with depth (see Fig.6, a). This section can be conditionally divided into four layers. The upper (near-surface) one probably corresponds to the seasonally frozen layer. It is represented by rocks that vary greatly in electrical resistivity, increasing in the direction from the first VES point to the tenth, from 590 to 4460 Ohm·m. This confirms the conclusions made based on the CDP data. The layer thickness varies within the limits of up to 2 m. Lower in the section there is a layer of low-resistivity rocks with a electrical resistivity of 100-270 Ohm·m, characteristic of the aquifer (talik). It contrasts throughout the line. The thickness of this layer varies between 3 and 5.5 m. The third layer is determined by an increase in electrical resistivity to 2050 Ohm·m, which is typical for permafrost rocks. Its thickness in the section is 4-6 m. The deepest layer has reduced electrical resistivity of about 220 Ohm·m, which is associated either with a change in the lithological composition [31] or with the presence of groundwater.
As follows from Fig.6, a, the talik is homogeneous in electrical resistivity. Its values correspond to standard wet sands and vary within the range of 100 to 270 Ohm·m. According to VES, the roof of the talik lies at depths of 0.5 to 2 m, and the base is within the range of 4 to 7 m along the section. The seasonally frozen layer and the layer of permafrost rocks have non-homogeneous electrical resistivity, which may be associated with differences in humidity and the degree of frozen state of the rocks.
When combining the VES with the GPR section, there is no complete coincidence of the feature limits (see Fig.6, a). This is explained by the fact that the GPR section shows a 2D image, where the limit position is obtained at each specific point, while the VES provides information in 1D and the measurements are affected by the immediate surroundings. Thus, the actual dissected base of thawed rocks greatly affects the location of the limits according to the VES, and the talik is transformed into a single layer, which is not true. Nevertheless, the methods complement each other, since the VES make it possible to assert that the limits recorded on the GPR section actually correctly mark the talik.
As mentioned, the VES line was made at a small distance from the electrical tomography line [31]. Electrical tomography is more suitable for complex media, in particular for sections with non-horizontal limits. However, the combination of VES data with the survey results (see Fig.6, b) showed satisfactory agreement, which confirms the validity of using VES to identify talik distribution areas and their properties.
Conclusion
The article shows the efficiency of combining GPR and electrical exploration in the VES modification using a test site in the Shestakovka River region as an example. It also considers difficulties arising during processing and interpretation of the obtained data. The scientific novelty of the work lies in the implementation of GPR soundings using the CDP method, which is rare in engineering geophysics. Analysis of well data clearly demonstrated the ambiguity in determining the velocity of electromagnetic waves propagation within the entire layer of thawed rocks due to extremely uneven water content. The dependence of permittivity on soil moisture is evaluated theoretically, which explains the obtained discrepancy in the measurement results. The need to combine geophysics with drilling and temperature measurements is shown.
The scientific novelty of the presented work also consists in detailed geophysical studies, which made it possible to determine the morphology of the identified layers, including the seasonally frozen layer, talik, and underlying permafrost rocks. Based on the study results, the talik roof and base position in the work area were plotted. The greatest talik thickness and, accordingly, the deepest roof of permafrost rocks are confined to open terrains.
The conducted study showed the possibility in principle to survey in detail the depths of the roof and base of water-bearing taliks using a small area as an example. This is important for assessing the underground water reserves and determining the preferred filtration paths in talik aquifers, as well as for resolving the issue of the stability or variability of the talik shapes under the observed climate changes. The Levaya Shestakovka site, due to the contrasting physical properties and good study, can be recommended as a reference site for testing methods and new equipment samples in studying the cryolithic zone.
References
- Biskaborn B.K., Smith S.L., Noetzli J. et al. Permafrost is warming at a global scale. Nature Communications. 2019. Vol. 10. N 264. DOI: 10.1038/s41467-018-08240-4
- Melnikov V.P., Osipov V.I., Brushkov A.V. et al. Decreased Stability of the Infrastructure of Russia’s Fuel and Energy Complex in the Arctic Because of the Increased Annual Average Temperature of the SurfaceLayer of the Cryolithozone. Herald of the Russian Academy of Sciences. 2022. Vol. 92. N 2, p. 115-125. DOI: 10.1134/S1019331622020083
- Costard F., Gautier E., Brunstein D. et al. Impact of the global warming on the fluvial thermal erosion over the Lena River in Central Siberia. Geophysical Research Letters. 2007. Vol. 34. Iss. 14. N L14501. DOI: 10.1029/2007GL030212
- Kizyakov A.I., Wetterich S., Günther F. et al. Landforms and degradation pattern of the Batagay thaw slump, Northeastern Siberia. Geomorphology. 2023. Vol. 420. N 108501. DOI: 10.1016/j.geomorph.2022.108501
- Syasko V., Shikhov A. Soil deformation model analysis in the processing of the geotechnical monitoring results. E3S Web of Conferences. 2021. Vol. 266. N 03014. DOI: 10.1051/e3sconf/202126603014
- Brushkov A.V., Alekseev A.G., Badina S.V. et al. Structure maintenance experience and the need to control the soils thermal regime in permafrost areas. Journal of Mining Institute. 2023. Vol. 263, p. 742-756.
- Trifonov O.V., Silkin V.M., Cherniy V.P. et al. Predictive mathematical modelling of stress-strain behavior for Power of Siberia pipeline sections subject to dangerous engineering-geocryological processes. Vesti Gazovoy Nauki. 2020. N 2 (44), p. 34-50.
- Jansson J.K., Taş N. The microbial ecology of permafrost. Nature Reviews Microbiology. 2014. Vol. 12. Iss. 6, p. 414-425. DOI: 10.1038/nrmicro3262
- Margesin R., Collins T. Microbial ecology of the cryosphere (glacial and permafrost habitats): current knowledge. Applied Microbiology and Biotechnology. 2019. Vol. 103. Iss. 6, p. 2537-2549. DOI: 10.1007/s00253-019-09631-3
- Dobinski W. Permafrost. Earth-Science Reviews. 2011. Vol. 108. Iss. 3-4, p. 158-169. DOI: 10.1016/j.earscirev.2011.06.007
- Bouffard T.J., Uryupova E., Dodds K. et al. Scientific Cooperation: Supporting Circumpolar Permafrost Monitoring and Data Sharing. Arctic and North. 2021. N 45, p. 157-177. DOI: 10.37482/issn2221-2698.2021.45.184
- Brushkov A.V. Issues of creating a system of state monitoring of permafrost. Fundamenty. 2022. N 3 (9), p. 4-9 (in Rus-sian).
- Konstantinov P., Zhelezniak M., Basharin N. et al. Establishment of Permafrost Thermal Monitoring Sites in East Siberia. Land. 2020. Vol. 9. Iss. 12. N 476. DOI: 10.3390/land9120476
- Potapov A.I., Shikhov A.I., Dunaeva E.N. Geotechnical monitoring of frozen soils: problems and possible solutions. IOP Conference Series: Materials Science and Engineering. 2021. Vol. 1064. N 012038. DOI: 10.1088/1757-899X/1064/1/012038
- Boitsov A.V. Formation conditions and regime of slope taliks in Central Yakutia. Kriogidrogeologicheskie issledovaniya. Yakutsk: Institut merzlotovedeniya SO AN CCCR, 1985, p. 44-55 (in Russian).
- O’Neill H.B., Roy‐Leveillee P., Lebedeva L., Feng Ling. Recent advances (2010-2019) in the study of taliks. Permafrost and Periglacial Processes. 2020. Vol. 31. Iss. 3, p. 346-357. DOI: 10.1002/ppp.2050
- Erji Du, Lin Zhao, Defu Zou et al. Soil Moisture Calibration Equations for Active Layer GPR Detection – a Case Study Specially for the Qinghai–Tibet Plateau Permafrost Regions. Remote Sensing. 2020. Vol. 12. Iss. 4. N 605. DOI: 10.3390/rs12040605
- Venkateswarlu B., Tewari V.C. Geotechnical Applications of Ground Penetrating Radar (GPR). Journal of Indian Geolog-ical Congress. 2014. Vol. 6 (1), p. 35-46.
- Dyakova G.S., Goreyavcheva A.A., Ostanin O.V. et al. Geophysical studies of the internal structure of glacial-permafrost stone formations of the Central Altai. Ice and Snow. 2020. Vol. 60. N 1, p. 109-120 (in Russian). DOI: 10.31857/S2076673420010027
- Popov S.V., Polyakov S.P., Pryakhin S.S. et al. The structure of the upper part of the glacier in the area of a snow-runway of Mirny Station, East Antarctica (based on the data collected in 2014/15 field season). Earth’s Cryosphere. 2017. Vol. XXI. N 1, p. 67-77. DOI: 10.21782/EC2541-9994-2017-1(67-77)
- Campbell S., Affleck R.T., Sinclair S. Ground-penetrating radar studies of permafrost, periglacial, and near-surface geology at McMurdo Station, Antarctica. Cold Regions Science and Technology. 2018. Vol. 148, p. 38-49. DOI: 10.1016/j.coldregions.2017.12.008
- Sudakova M., Sadurtdinov M., Skvortsov A. et al. Using Ground Penetrating Radar for Permafrost Monitoring from 2015-2017 at CALM Sites in the Pechora River Delta. Remote Sensing. 2021. Vol. 13. Iss. 16. N 3271. DOI: 10.3390/rs13163271
- Savvin D.V., Fedorova L.L., Soloviev E.E. Experience of GPR investigation at engineering-geological survey in Central Yakutia. Engineering Survey. 2018. Vol. XII. N 7-8, p. 92-100 (in Russian). DOI: 10.25296/1997-8650-2018-12-7-8-92-100
- Yongping Wang, Huijun Jin, Guoyu Li. Investigation of the freeze–thaw states of foundation soils in permafrost areas along the China – Russia Crude Oil Pipeline (CRCOP) route using ground-penetrating radar (GPR). Cold Regions Science and Technology. 2016. Vol. 126, p. 10-21. DOI: 10.1016/j.coldregions.2016.02.013
- Hauck C. New Concepts in Geophysical Surveying and Data Interpretation for Permafrost Terrain. Permafrost and Periglacial Processes. 2013. Vol. 24. Iss. 2, p. 131-137. DOI: 10.1002/ppp.1774
- Olenchenko V.V., Gagarin L.A., Khristoforov I.I. The structure of a site with thermo-suffosion processes within Bestyakh terrace of the Lena River, according to geophysical data. Earth’s Cryosphere. 2017. Vol. XXI. N 5, p. 14-23. DOI: 10.21782/EC1560-7496-2017-5(14-23)
- Politsina A.V., Kotin I.S., Stepanov D.V. et al. Surface electrical tomography for taliks mapping (Taimyr Peninsula). Journal of Mining Institute. 2013. Vol. 200, p. 76-80 (in Russian).
- Sjöberg Y., Marklund P., Pettersson R., Lyon S.W. Geophysical mapping of palsa peatland permafrost. The Cryosphere. 2015. Vol. 9. Iss. 2, p. 465-478. DOI: 10.5194/tc-9-465-2015
- Kopylov D.V., Sadurtdinov M.R. The study of talik under a small watercourse by the capacitive resistivity method. Earth’s Cryosphere. 2020. Vol. XXIV. N 6, p. 38-46. DOI: 10.21782/EC2541-9994-2020-6(38-46)
- Gagarin L.A., Bazhin K.I., Olenchenko V.V. et al. Revealing potential thermo-suffosional soil loosening sites along A-360 Lena Federal Highway, Central Yakutia. Earth’s Cryosphere. 2019. Vol. XXIII. N 3, p. 51-57. DOI: 10.21782/EC2541-9994-2019-3(51-57)
- Melnikov V.P., Osipov V.I., Brouchkov A.V. et al. Development of geocryological monitoring of undisturbed and disturbed Russian permafrost areas on the basis of geotechnical monitoring systems of the energy industry. Earth’s Cryosphere. 2022. Vol. XXVI. N 4, p. 3-15. DOI: 10.15372/KZ20220401
- Demidov N.E., Verkulich S.R., Anisimov M.A., Ugryumov Yu.V. The concept and first results of the project to create a state system for monitoring permafrost in the Russian Federation based on the Roshydromet observation network. Sovremennye tendentsii i perspektivy razvitiya gidrometeorologii v Rossii: Materialy V Vserossiiskoi nauchno-prakticheskoi konferentsii, 23-25 noyabrya 2022, Irkutsk, Rossiya. Irkutsk: Izd-vo Irkutskogo gosudarstvennogo universiteta, 2023, p. 384-387 (in Russian).
- Varlamov S.P., Zhirkov A.F., Nakhodkin D.A. Ground Temperature Regime after Surface Disturbance under Current Climatic Conditions in Central Yakutia. Nauka i Obrazovanie. 2017. Vol. 22. N 4, p. 65-71 (in Russian).
- Popov S., Kashkevich M., Romanova N. et al. Results of geophysical investigations to study subaeral supra permafrost taliks in the area of the Shestakovka River, Central Yakutia. Geologiya i mineralno-syrevye resursy Severo-Vostoka Rossii 2024: Materialy XIV Mezhdunarodnoi nauchno-prakticheskoi konferentsii, posvyashchennoi 300-letiyu Rossiiskoi akademii nauk i 100-letiyu zolotodobyvayushchei promyshlennosti Respubliki Sakha (Yakutiya), 26-29 March 2024, Yakutsk, Russia. Novosibirsk: Sibirskoe otdelenie RAN, 2024, p. 545-550 (in Russian). DOI: 10.53954/9785604990100_545
- Lebedeva L.S., Bazhin K.I., Khristoforov I.I. et al. Suprapermafrost subaerial taliks, Central Yakutia, Shestakovka River basin. Earth’s Cryosphere. 2019. Vol. XXIII. N 1, p. 35-44. DOI: 10.21782/EC2541-9994-2019-1(35-44)
- Lebedeva L.S., Baishev N.E., Pavlova N.A. et al. Ground temperature at the depth of zero annual amplitude in the area of suprapermafrost taliks in Central Yakutia. Earth’s Cryosphere. 2023. Vol. XXVII. N 2, p. 3-13. DOI: 10.15372/KZ20230201
- Popov S.V., Boronina A.S., Lebedeva L.S. The main factors in the formation of subaerial taliks on the example of the Shestakovka River basin (Central Yakutia), using a one-dimensional mathematical model. Ice and Snow. 2023. Vol. 63. N 4, p. 597-611 (in Russian). DOI: 10.31857/S2076673423040130
- Weibo Liu, Fortier R., Molson J., Lemieux J.-M. A conceptual model for talik dynamics and icing formation in a river floodplain in the continuous permafrost zone at Salluit, Nunavik (Quebec), Canada. Permafrost and Periglacial Processes. 2021. Vol. 32. Iss. 3, p. 468-483. DOI: 10.1002/ppp.2111
- Ohara N., Jones B.M., Parsekian A.D. et al. A new Stefan equation to characterize the evolution of thermokarst lake and talik geometry. The Cryosphere. 2022. Vol. 16. Iss. 4, p. 1247-1264. DOI: 10.5194/tc-16-1247-2022
- Finkelshtein M.I., Mendelson V.L., Kutev V.A. Radar location of layered earth covers. Moscow: Sovetskoe Radio, 1977, p. 174 (in Russian).
- Popov S.V. Determination of dielectric permittivity from diffraction traveltime curves within a dipping-layer model. Earth’s Cryosphere. 2017. Vol. XXI. N 3, p. 75-79. DOI: 10.21782/EC2541-9994-2017-3(75-79)
- Looyenga H. Dielectric constants of heterogeneous mixtures. Physica. 1965. Vol. 31. Iss. 3, p. 401-406. DOI: 10.1016/0031-8914(65)90045-5
- Ray P.S. Broadband Complex Refractive Indices of Ice and Water. Applied Optics. 1972. Vol. 11. Iss. 8, p. 1836-1844. DOI: 10.1364/AO.11.001836
- Chernyak G.Ya. Electromagnetic methods in hydrogeology and engineering geology. Moscow: Nedra, 1987, p. 213 (in Russian).
- Sosnovsky A.V., Osokin N.I. Impact of Moss and Snow Cover on the Sustainability of Permafrost in West Spitsbergen due to Climate Change. Herald of the Kola Science Centre of RAS. 2018. N 3, p. 178-184 (in Russian). DOI: 10.25702/KSC.2307-5228.2018.10.3.178-184