
From import substitution to technological leadership: how local content policy accelerates the development of the oil and gas industry
- 1 — Ph.D., Dr.Sci. Leading Researcher A.V.Topchiev Institute of Petrochemical Synthesis ▪ Orcid
- 2 — Senior Expert JSC “Operational Services Center” ▪ Orcid
Abstract
Achieving technological sovereignty implies accelerating innovation and reducing import dependence. An effective tool for addressing these challenges is local content policy (LCP). The purpose of this study is to assess the impact of LCP on innovation activity in oil and gas companies and to provide recommendations for enhancing the effectiveness of this policy in Russia. The paper analyzes the influence of LCP on innovation levels in the oil and gas sector, drawing on examples from 10 countries. A positive short-term impact of LCP on innovation was identified in Brazil, Malaysia, and Saudi Arabia, with long-term effects observed in China and South Africa. Recommendations for improving the effectiveness of LCP in Russia are supplemented with a methodology for calculating the level of technological sovereignty. A refinement of the method for solving the «responsiveness» problem, incorporating the level of localization, has been proposed.
None
Introduction
One of the effective tools for achieving technological sovereignty is local content policy (LCP). LCP requirements are policies that force a company in an industry to obtain a certain share of the resources used in the production process domestically [1-6]. Enhancing domestic value through the substitution of imported products with locally manufactured ones and generating employment opportunities by replacing foreign workers with local personnel are some of the most commonly emphasized aims of LCP [7-11]. These goals are closely connected, as increasing local production naturally leads to job creation, many of which can be occupied by the domestic workforce.
In the Russian Federation, the policy is currently shaped by numerous regulatory acts: Decree of the Government of the Russian Federation N 719 dated July 17, 2015, and N 553 dated April 1, 2022, which define and clarify criteria for confirming the production of industrial goods within the Russian Federation. These measures ensure preferences for domestic goods in public procurement, stimulating production localization. The State Program “Energy Efficiency and Energy Development” and Directive of the Government of the Russian Federation N 1-r dated January 8, 2009, aim to improve energy efficiency and promote the use of renewable energy sources. These programs include measures to develop local technologies and production solutions in the energy sector. Federal Laws N 44-FZ dated April 5, 2013, “On the Contract System in the Sphere of Procurement of Goods, Works, and Services for State and Municipal Needs”, and N 223-FZ dated July 18, 2011, “On Procurement of Goods, Works, and Services by Certain Types of Legal Entities”, regulate the procurement of goods and services for state and municipal needs, granting priority to domestic manufacturers. Additional localization support measures include Directive of the Ministry of Economic Development of the Russian Federation N 219R-AU dated August 11, 2016, and Decrees of the Government of the Russian Federation N 2013 dated December 3, 2020, and N 925 dated September 16, 2016, which introduce quotas for the purchase of Russian-made goods and prioritize domestic products over foreign ones. Collectively, these and other measures enshrined in regulatory acts constitute a localization policy aimed at developing domestic production, reducing import dependency, and enhancing the economic and energy security of the Russian Federation.
There is potential to enhance the effectiveness of LCP in Russia through several avenues: improving the quality of professional and independent assessments of domestic production compliance with localization requirements; refining methodologies for calculating local content share; increasing attention to workforce development and decentralizing oversight by delegating some functions to independent organizations [7]. To achieve technological sovereignty, it is advisable to implement measures to improve LCP efficiency.
The implementation of local content policy instruments requires an analysis of the factors hindering higher levels of local production in the market. In practice, this entails examining market dysfunctions, primarily reflecting limited domestic capacities or external dependence on supplies [1]. It is essential to determine whether local production can be incentivized within existing market mechanisms or if state intervention is necessary to ensure long-term economic competitiveness. The assessment of costs associated with the implementation of LCP include both explicit expenses and hidden economic costs, such as opportunity costs and potential negative impacts on other sectors. In this context, the authors propose refining the “responsiveness” problem methodology by accounting the limitations on the share of local content. In addressing the “responsiveness” problem, the authors envision an evaluation of the potential long-term net economic benefits of implementing such measures, including enhancing domestic competitiveness and reducing external dependency. To assess the temporal effects of LCP, it is essential to determine whether the outcomes will be noticeable in the short term or if the policy targets longer-term goals. This also involves analyzing the policy’s impact on the innovation activity of companies, the development of new technologies, and scientific research.
To achieve technological sovereignty, a country must advance its technological development, which is determined by the level of innovation activity, with patent activity as a fundamental metric. This study aims to assess the impact of LCP on the innovation activity of oil and gas companies followed by the development of recommendations to enhance the effectiveness of LCP in Russia.
Definition of local content policy in the oil and gas sector
To analyze the impact of LCP on innovation in the oil and gas sector, it is necessary to describe the role, possible position, and potential effects of LCP in the context of the value chain.
Suitable oil and gas exploration basins, depending on the type of rocks, are determined using methods such as seismic surveys, electrical and acoustic prospecting, and others. The obtained data is interpreted using advanced computer analysis to identify potential hydrocarbon deposits. The next stage involves exploratory and parametric assessment works, which help refine the promising areas for further investigation. The exploration stage requires significant capital investment and services that are often performed by highly specialized service companies. During the preparation stage for conducting seismic surveys, local labor is engaged for tasks such as road construction, well pad leve-ling, and material transportation. It is worth noting that the share of imported equipment used for geological exploration reaches 80 % in some areas, and up to 95 % in hardware-software systems [12].
At the field development stage, although there is demand for local labor to perform unskilled tasks and basic construction work, import dependence for several key positions reaches up to 95 %. For example, the potential for increasing localization levels exists in areas such as heavy transport, welding machines, bulldozers, 50-ton dump trucks, and construction materials designed for the challenges of thawing permafrost [13]. This stage requires significant investment and contributes to job creation and the development of local infrastructure.
The stage of field operation, including the commissioning of the main well stock, assumes a higher share of local content compared to the exploration, drilling, and well development stages. However, a reduction in local content is expected at the stage of implementing enhanced oil recovery methods, which require highly qualified labor (both domestic and foreign specialists) often provided by oilfield service companies. Furthermore, the highest levels of import dependence are observed in areas such as sensors for automated process control systems, specialized software, and chemical reagents for drilling fluids and hydraulic fracturing [12, 14].
Hydrocarbon transportation, in the context of local content, can be divided into two types: field pipelines and trunk pipelines. The construction of field pipelines reflects opportunities for increasing the share of local content due to the relative simplicity of their implementation, determined by smaller pipe diameters, location, and other factors. As a rule, the construction of field pipelines is undertaken by the subsoil user. The construction of trunk pipelines, however, is carried out by other companies and requires highly qualified specialists due to the larger pipe diameters and the complexities of design and construction caused by geographic conditions. Consequently, the share of local content decreases during the construction of trunk pipelines. In general, import dependence in the transportation of oil and gas is the lowest – about 30 %. However, there is potential to further reduce import dependence in certain technologies [12].
The refining and petrochemical stage represents the second-largest capital expenditure after well construction and field development. The operation of refineries requires more highly qualified labor compared to the commissioning stage. The key role in implementing projects is played by technology owners (licensors), who determine all contractors. There is significant potential for institutional regulation and increasing the share of local content at this stage by introducing mandatory local content norms for technology owners. Particular importance is now being placed on low-tonnage chemistry (for the production of fuel additives, oil additives) as well as catalysts and zeolites [15].
Methods
The research methodology is based on the application of cointegration analysis, the Vector Error Correction Model (VEC), and the Vector Autoregression Model (VAR), as well as impulse response functions to evaluate the impact of local content policies (LCP) on innovation activity in the oil and gas industry [16, 17]. The study covers the period from 1950 to 2024 for the traditional oil and gas sector (exploration and production, refining, transportation, and distribution, as well as international and national vertically integrated oil companies) and from 2000 to 2024 for energy transition technologies, including hydrogen energy technologies, carbon capture, utilization, and storage (CCUS), and renewable energy technologies (RET). The study analyzes data from countries actively implementing local content policies: Russia, Brazil, Indonesia, Malaysia, Norway, Saudi Arabia, China, India, Egypt, and South Africa. The selection of these countries is based on several factors. First, they represent various regions of the world (Latin America, Asia, the Middle East, Africa, and Europe), allowing for an evaluation of LCP impacts within different socio-economic and cultural contexts. This regional diversity enhances the representativeness of the analysis, considering that LCPs are shaped by the specificities of each region. Second, each of these countries possesses a developed oil and gas sector that plays a critical role in the national economy and faces challenges related to reducing import dependence.
The LCP practices in these countries are relevant for analysis because each country seeks to enhance production localization and mitigate external risks. The countries also differ in their strategies for implementing LCP: some adopt strict regulations, while others opt for hybrid or models that are more liberal. This provides an opportunity to assess the effectiveness of various approaches depending on the conditions in which companies operate. Finally, the study accounts for the differences in and impacts of LCPs on both international oil companies (IOCs) and national oil companies (NOCs). While LCP increases operational costs for international companies, it simultaneously supports the growth and competitiveness of national companies.
Innovation activity
An objective metric for assessing the level of innovation activity is the number of patents registered annually, categorized according to the International Patent Classification (IPC). Patents represent officially recognized technical achievements and innovations, allowing for a quantitative evaluation of contributions to technological development and innovation within a specific sector. For each segment of the oil and gas industry, key IPC classes were identified to characterize the operational profile of companies in that sector [18-22]:
Upstream:
- E21B: Devices and methods for drilling.
- G01V: Geophysical measurements, such as seismic exploration.
- G06F: Electronic computing devices and data processing.
- C07C: Acyclic or carbocyclic compounds.
Downstream:
- C01B: Inorganic chemistry.
- C07C: Organic chemistry, including acyclic and carbocyclic compounds.
- B01J: Chemical or physical processes, such as catalysts.
- C10G: Petroleum refining.
International Oil Companies (IOC):
- C07C: Organic chemistry.
- C10G: Hydrocarbon refining.
- C08F: Polymers.
- B01J: Chemical or physical processes.
- E21B: Devices and methods for drilling.
- G01V: Geophysical measurements.
- B01D: Separation.
- C01B: Inorganic chemistry.
National Oil Companies (NOC):
- B01J: Chemical or physical processes.
- C07C: Organic chemistry.
- C10G: Hydrocarbon refining.
- E21B: Devices and methods for drilling.
Specific IPC classes for energy transition technologies, including hydrogen energy, carbon capture and storage, and renewable energy, were also examined:
- C01B3/02: Hydrogen production.
- B01D53/62: Carbon dioxide (CO2) capture.
- F03D: Wind energy.
- H01M: Fuel cells.
- H02S: Photovoltaic systems (solar panels).
Local content policy
For each year, if any regulatory legal act (RLA) related to the LCP was implemented, the value +10 is assigned, otherwise the value +1. This structure for constructing the time series enables the identification of trends and highlights changes in policy.
Analytical methodology
To analyze the impact of LCP on innovation activity, Granger causality tests and impulse response functions (IRF) were employed. Long-term Granger causality indicates that changes in variable x (LCP) have a significant influence on variable y (innovation activity) over the long term (5-10 years). This is identified through the presence of cointegration between the time series. Short-term Granger causality signifies that changes in variable x predict changes in variable y in the short term (1-3 years). This is determined by the significance of the lag coefficients of variable x in the VAR model. The impulse response function (IRF) illustrates the reaction of time series y to a unit shock in variable x over several periods. A positive and significant IRF indicates that a shock in variable x (e.g., implementation of a new LCP) leads to an increase in innovation activity (number of patents) after h periods. Conversely, a negative and significant IRF suggests a decrease in innovation activity.
Stationarity testing
The first step involves testing the stationarity of time series using the Dickey-Fuller test (ADF test). This is necessary to determine the integration order of the time series and to select an appropriate model,
where Δ – the difference operator; zt – the time series under analysis; t – the trend; α, β, γ, δi – the model parameters; ɛt – the regression error (residual).
The regression residual ɛt represents the difference between observed and predicted values. In cointegration analysis, the stationarity of the residual indicates a long-term equilibrium relationship between variables. A significant residual in the regression may point to factors influencing innovation activity that are not accounted for in the model. These factors may include macroeconomic conditions, technological changes, the initial state of the sector, and other external influences.
Cointegration analysis
Cointegration analysis is conducted to identify long-term relationships between variables. This process involves two main stages.
Regression in levels:
where yt – innovation activity; xt – local content policy; β0, β1 – regression coefficients; ɛt – the regression error.
Testing residual stationarity:
where Δ – the difference operator; ɛt–1 – the error from the cointegration regression; α, γi – regression coefficients; vt – the model error.
If the residual is stationary, this indicates the presence of cointegration between the variables.
Vector Error Correction Model (VEC)
The VEC model is used to analyze both long-term and short-term relationships between time series. First, a simplified VEC model without lags is constructed:
Then, a complete VEC model with lags is developed:
where Δyt – changes in innovation activity; Δxt –1 – changes in local content policy at lag t-i; α0, α1, βi, γi – model coefficients.
Vector autoregression model (VAR)
The VAR model is applied to analyze short-term dynamic relationships between variables. The variables are differenced to ensure stationarity:
where zt – vectors of time series; φi, θi – model coefficients; ɛt – the model error.
Impulse response function (IRF)
To assess the impact of shocks in local content policy on innovation activity, impulse response analysis is employed:
where IRF(h) – the impulse response function at horizon h; yt+h – the value of the time series y after h periods after the impulse; ɛx,t – the shock in variablex at time t.
Results
The Table presents the results of econometric analysis. Statistically insignificant effects of the policy on the relevant sector are highlighted in blue. Statistically insignificant effects suggest a high likelihood of random occurrence of this parameter. Short-term effects of local content policies are shown in green, while long-term effects are indicated in yellow. The structure of the formulas in the cells corresponds to the level of policy impact and error margins. The coefficient for the LCP variable reflects the magnitude characterizing the strength of LCP's influence on the level of innovation activity (a change in innovation activity level resulting from a 1 % change in LCP). The error accounts for other influencing factors, such as the initial state of the sector.
To explain the results, an analysis of LCP implementation in countries demonstrating the best outcomes is necessary. This involves assessing elements like monitoring and control systems, labor-related policies, procurement policies, incentives, penalties, and specific policy features. Such classification enables a comprehensive characterization of any country’s LCP effectiveness and its impact on innovation activity.
Brazil
In Brazil, the approach to overseeing the implementation of local content requirements in the oil and gas industry is notably decentralized. The main policies and guidelines are established by the National Energy Policy Council (Conselho Nacional de Política Energética) along with the Ministry of Mines and Energy. In practice, the enforcement of these policies is handled by the National Petroleum Agency (ANP), which sets the required minimum levels of local content, accredits certification and research entities, creates reporting templates, tracks adherence to regulations, and enforces penalties for non-compliance [23]. The National Bank for Economic and Social Development (BNDES) is also key, as it imposes local content criteria on projects it finances. The National Organization of the Petroleum Industry (ONIP) plays an essential role in ensuring that suppliers meet local content standards, providing certification, and offering training programs. Coordination among stakeholders is facilitated through PROMINP, which includes representatives from the government and major industry players such as ministers, Petrobras, BNDES, and ONIP.
The influence of LCP on innovation activity
|
Patent profile |
Russia |
Brazil |
Indonesia |
Malaysia |
Norway |
Saudi Arabia |
China |
India |
Egypt |
South Africa |
|
Upstream |
Statistically insignificant |
4,19*LCP +24,6 |
Statistically insignificant |
0,84*LCP –12,4 |
Statistically insignificant |
16,35*LCP +8 |
5,6*LCP –5,3 |
Statistically insignificant |
Statistically insignificant |
0,4*LCP +43,2 |
|
Downstream |
Statistically insignificant |
2,82*LCP +39,8 |
Statistically insignificant |
0,68*LCP –8,7 |
Statistically insignificant |
5,68*LCP +7,8 |
6,7*LCP +4,5Long-term impact: 11,2d (LCP) –8,9 |
Statistically insignificant |
Statistically insignificant |
Statistically insignificant |
|
VIOC IOC |
Statistically insignificant |
2,81*LCP +19,1 |
Statistically insignificant |
0,98*LCP –14,4 |
Statistically insignificant |
21*LCP +12,7 |
Statistically insignificant |
Statistically insignificant |
Statistically insignificant |
0,3*LCP +38,8 |
|
VIOC NOC |
0,97*LCP +15,7 |
3,36*LCP +29,5 |
Statistically insignificant |
1,7*LCP –38,7 |
1,5*LCP +3 |
15,9*LCP +9 |
7,2*LCP +5,8Long-term impact:10d (LCP) –6,7 |
Statistically insignificant |
Statistically insignificant |
0,14*LCP+42,1Long-term impact:–8d (LCP) +14 |
|
Energy transition |
0,26*LCP +258,4 |
6,6*LCP +77,9 |
Statistically insignificant |
Statistically insignificant |
Statistically insignificant |
Statistically insignificant |
Statistically insignificant |
Statistically insignificant |
Statistically insignificant |
Statistically insignificant |
Until 2005, companies were required to indicate the origin of purchased goods and services without submitting supporting documentation. In 2005, significant changes were introduced, making the system rely on actual expenditures, enhancing transparency and audit effectiveness. Annex III of Regulation 6/2007 established a clearer, more detailed approach to calculating local content levels for various categories, such as goods, equipment, services, and systems. ANP was assigned the responsibility of monitoring and controlling compliance with these standards, requiring quarterly reports [1]. Audits are conducted during both the exploration and development phases, allowing for comprehensive oversight at all key project stages.
Post-2007 legislative changes refined the minimum local content standards further. Along with general minimum requirements, individualized targets for different expense subcategories were introduced for each licensing round, making the process more adaptable to project specifics. Operators are required to dedicate at least 1 % of their gross revenues from oil and gas production to research and development activities. This allocation is divided between the operator's research centers within Brazil, which can receive up to 50 % of the funds, and local universities or certified research organizations, which must be the beneficiaries of the remaining portion [1]. This R&D incentive policy helps to improve the qualifications of local specialists.
During the exploration phase, if the local content level surpasses the minimum requirements, the excess can, with ANP's prior approval, be transferred to the development stage. Failing to meet local investment commitments results in penalties. Interestingly, concession agreements provide exceptions to local content rules for specific goods if their prices are excessively high, delivery times are unreasonably long, or the necessary technologies are not available domestically.
Several tax benefits are provided to support local raw material production, encouraging investments in infrastructure and manufacturing facilities. These include exemptions from taxes like COFINS, II, IPI, and PIS. Additionally, ANP establishes minimum local content goals for each project based on block type (deepwater, shallow water, onshore) and phase (exploration, development), and develops weight coefficients for evaluating proposals from bidders [1]. This allows participants to offer higher-than-required local content percentages, providing flexibility and fostering the development of local supply chains and technologies.
Thus, the best practices reflected in the influence on innovation activity include decentralized institutional control, phase-specific reporting, mandatory R&D investments, and local content requirements tied to licensing for exploration and production rights.
Malaysia
In Malaysia, the management structure of the oil and gas sector is characterized by the high level of centralization within the national company Petronas. This entity combines commercial operations with regulatory oversight across the entire production and distribution process, maintaining exclusive rights for oil exploration and extraction. Directly accountable to the Prime Minister’s Office, Petronas operates two specialized units as part of its local content policy strategy: one focused on supply chain oversight and the other tasked with fostering domestic expertise through educational programs. These efforts are designed to increase the involvement of local specialists and enterprises in pivotal projects. Regulation of the downstream and midstream sectors is jointly managed by the Ministry of International Trade and Industry and the Ministry of Domestic Trade and Consumer Affairs. This division of responsibility accounts for the unique characteristics of each segment, minimizing administrative obstacles within the industry. Established in 2011, the Malaysia Petroleum Resources Corporation (MPRC) acts as a link between national strategic priorities and the operational needs of the industry [1]. Its functions include promoting Malaysia’s oil and gas industry, developing recommendations on tax and regulatory incentives, and supporting the attraction of foreign investments. A significant area of MPRC's activity involves designing mechanisms to enhance the competitiveness of the national industry. Specifically, creating conditions for localizing technological processes and encouraging collaboration between the private sector and government agencies forms a platform for the sustainable development of the industry.
Reports on local content or monitoring of obligations under production-sharing agreements (PSA) are not publicly disclosed. However, key performance indicators are established to track progress in areas such as attracting multinational corporations to operate in Malaysia, consolidating the local manufacturing sector, and developing engineering, procurement, and construction capacities through strategic partnerships and joint ventures [24].
Malaysia’s labor policies feature mandatory provisions. Under PSAs, contractors are encouraged to prioritize the hiring of Malaysian citizens. Although specific employment targets, both general and by position, are not mandated, regulations connect the amount of authorized capital to the type and number of foreign work visas a company may apply for. PSAs also obligate contractors to train Malaysian personnel to replace foreign workers, with minimum training expenditures clearly outlined in the agreements.
PSAs oblige oil companies to procure materials from companies registered in Malaysia or manufacturers if local companies cannot provide the necessary materials or services. The law requires foreign companies to register and maintain a minimum equity share within the country.
Key measures include tax breaks for pioneer firms, investment incentives, reinvestment initiatives, research and development funding, support for building production facilities, assistance for selected foreign investments, and tax relief for operational headquarters. Notably, companies with pioneer status benefit from partial income tax exemptions for five years, easing financial pressures during early operations. This underscores the immediate advantages of LCPs in targeted industries (see Table). Companies with investment tax allowances can recover up to 60 % of capital expenditures made within the first five years. However, such benefits are contingent upon meeting strict criteria. Companies must allocate at least 1 % of total sales to local R&D programs. Their workforce policy must ensure that at least 15 % of employees have scientific or technical education and relevant work experience [1]. Government priorities emphasize the advancement of high-value-added technologies and the development of intersectoral production linkages, underlining the importance of evaluating LCPs in terms of cross-sectoral interdependence. Sanctions are imposed to ensure strict compliance with corporate activity programs: companies failing to meet agreed conditions lose benefits and risk revocation of their operating licenses. This creates a rigid yet effective disciplinary mechanism that aids in achieving the set goals.
PSAs mandate that contractors annually invest 0.5 % of oil production costs into research. Consequently, the effective practices reflected in their influence on innovation activity include obligations to invest in R&D, strict worker competency requirements, and a well-developed system of benefits.
Saudi Arabia
The In-Kingdom Total Value Add (IKTVA) program, launched in Saudi Arabia in 2015, demonstrates significant success in increasing the share of local content in the economy. In the first year of its implementation, the share of local content was only 35 %; by 2021, this figure had reached 59 %, and in 2022 – 63 %. To obtain the Saudi Made product status, it is required that its added value be no less than 40 % or that the main components be produced within the Kingdom of Saudi Arabia. If the product does not meet these requirements and includes imported materials, their cost must not exceed 60 % of the total product value.
During the implementation of the IKTVA program, local suppliers doubled their spending on procuring materials and services domestically. Salaries for Saudi workers increased by 60 %, and expenditures on training and skill development quadrupled. Foreign investment attracted through the program reached $6.5 billion by 2021. Furthermore, the Economic Complexity Index (ECI) for exported goods showed steady growth: from 0.01 (61st place globally) in 2015 to 0.62 (42nd place) in 2020, reflecting the increasing complexity and diversification of export products.
The program places particular emphasis on developing methodologies for assessing and measuring company metrics. To work with Saudi Aramco, companies must undergo evaluation based on six key indicators: the share of localized products and services, salaries for local employees, the scope of training for local personnel, expenditures on the development of local suppliers, investments in research and development, and the revenue earned from collaboration with Saudi Aramco. These data are used to calculate the local content indicator using the IKTVA formula [25]:
where A – localized goods and services; B – salaries for Saudis; C – training expenses; D – supplier development costs; r – expenditures on local R&D; E – company revenue from Saudi Aramco.
The data are verified both by Saudi Aramco itself and by independent auditing firms, such as Baker Tilly, BDO, Grant Thornton, RSM, EY, pwc, Deloitte, KPMG, Crowe, and Achilles. Failure to meet program requirements may result in sanctions, including exclusion from Saudi Aramco’s electronic contracting system.
The program actively invests in human capital, creating large training centers. By 2030, it aims to train 360,000 highly qualified Saudi specialists. To support employers, the Human Resources Development Fund (HRDF) subsidizes on-the-job training. Companies offering such opportunities are eligible for monthly payments of 500 Saudi riyals per candidate undergoing training for up to three months. The HRDF reimburses up to 75 % of an employee's salary during the training period, up to a maximum of 1,500 riyals per month. Additionally, the fund covers 50 % of wages for two years, including the training period, but not exceeding 2,000 riyals per month per employee.
Thus, the effective practices demonstrated in enhancing innovative activity include: employing a scoring system for contractor selection, establishing large-scale training centers, and subsidizing on-the-job training for Saudis in the oil and gas sector.
China
The Made in China (MIC) 2025 program, a ten-year plan launched in 2015, implemented by the Communist Party of China and the National Energy Administration, aims to increase the share of domestically sourced core components and materials to 40 % by 2020 and 70 % by 2025 [26]. Target indicators vary across sectors. In the energy sector, the goals include achieving 90 % domestic market share for Chinese equipment by 2020, with 30 % of annual production intended for export. By 2025, the plan envisages the establishment of three internationally competitive Chinese enterprise groups with appropriate financing, scale, technology, quality, branding, and competitive advantages. For renewable energy and energy-saving equipment, the target is set at over 80 %.
Key metrics for measurement include the share of domestic R&D expenditures, the number of effective patents per capita, the production quality index, the added value of manufacturing, labor productivity growth rates, broadband penetration levels, digital R&D initiatives, the digitalization of key processes, as well as metrics for Green Development.
A preferential financing regime exists for Chinese enterprises, with state banks providing subsidies, low-interest loans, and bonds, particularly for small and medium-sized enterprises (SMEs). Additionally, funds such as the Advanced Manufacturing Fund allocate $3 billion for technological modernization in key industries. The construction of 40 national and 48 provincial innovation centers (by 2025) is underway to facilitate partnerships and the adoption of innovations.
In the labor sphere, several initiatives deserve attention. The National Training Project “Milky Way” targets SMEs with a focus on improving modern management standards and enterprise competitiveness. Furthermore, the Knowledge Renewal Program supports talented professionals and technical specialists, aiming to retrain professional and technical personnel for innovative roles.
China's policy requires foreign enterprises to establish joint ventures with Chinese firms, with a minimum of 50 % ownership retained by the Chinese partner as a prerequisite for market entry.
Thus, effective practices influencing innovative activity primarily include a comprehensive set of localization metrics that separately account for digitalization levels and patents per capita.
South Africa
The South African Department of Energy and the South African Local Content Authority (SALCA) oversee the monitoring and enforcement of local content policies. Key metrics include the number of jobs created for South African citizens, the share of local content in the procurement of goods and services, investments in training and development for local workers, and the percentage of local content in major energy and mining projects [27].
A noteworthy initiative is the Black Economic Empowerment (BEE) Scorecard. Its primary components include the share of company ownership held by Black South Africans, the representation of Black managers in company leadership, investments in the training and upskilling of Black employees, the proportion of procurement from local Black suppliers, and corporate contributions to the development of local communities.
Companies are required to submit detailed reports on their compliance with local content requirements, including financial data and workforce information. The Department of Energy and SALCA conduct independent audits and inspections to ensure that the reported data aligns with actual performance.
South Africa has a comprehensive system of incentives, including tax deductions, subsidies, loans, and preferential treatment in tenders.
Indonesia, India, Egypt
The experiences of these countries highlight potential negative aspects of local content policies that have resulted in a lack of statistically significant impact on innovation activity.
In Indonesia, the calculation of local content in services is based on the proportion of costs that exclude foreign components relative to the total expenditure. The degree of localization varies depend-ing on the producer's ownership structure and location [1]. For instance, goods manufactured entirely by Indonesian-owned companies operating within the country are deemed 100 % localized. However, if a foreign entity owns 75 % of the business or if the goods are produced abroad by an Indonesian company, the localization rate is reduced to 75 % [28]. This methodology raises several issues. First, it does not account for the degree of integration of local suppliers into the value chain, the innovativeness of the technologies employed, or the impact on the development of the local economy. Second, linking the calculation to the formal ownership structure creates distortions, such as foreign companies using nominal local partners to boost localization metrics. The effectiveness of such a methodology requires revision. To enhance effectiveness, it is advisable to include additional parameters reflecting the actual impact on the local economy: the share of local employees in the company’s workforce, the level of involvement of local suppliers, and the volume of reinvestments in regional development.
The current Production Linked Incentive (PLI) program directly conflicts with India’s trade policy. For instance, the import of raw materials for assembling solar modules is subject to a 13 % tariff, whereas pre-assembled modules are exempt from import duties [29]. Additionally, contractors involved in oil operations are required to procure and utilize goods manufactured or supplied within India, provided such goods are available on terms equal to or better than those of imported goods in terms of delivery timelines, required quality and quantity, price, and other conditions.
Russia
The oil and gas sector in Russia has demonstrated dynamic responses in innovation activity to the adoption of local content policies (LCPs) and related regulatory acts. The Figure illustrates statistically significant results, with the x-axis representing time in years and the y-axis reflecting changes in innovation activity within the respective sector per regulatory act, measured in percentage points (p.p.).
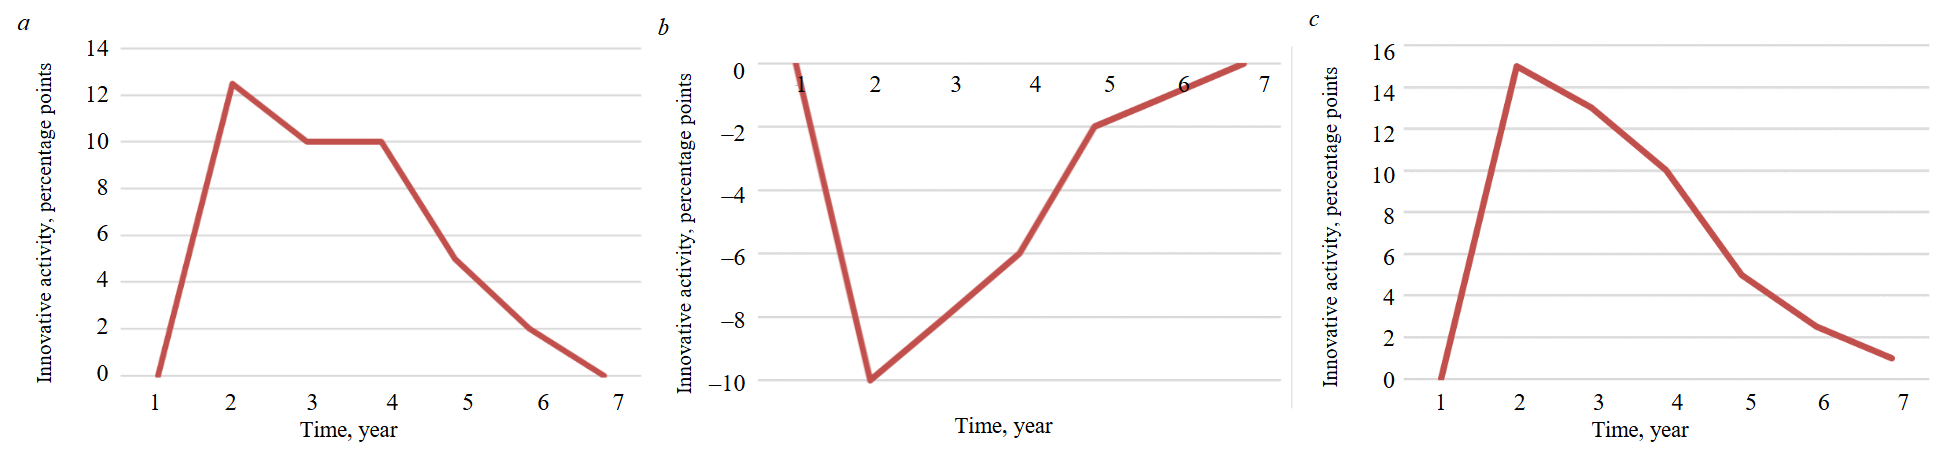
Impulse response for energy transition technology (a); for exploration and production (b); for national oil and gas companies (c)
The impact of LCP on innovation activity has varying characteristics and timeframes. For the exploration and production sector, it has been determined that the impact of LCP is strictly negative, with the maximum negative effect observed within the first five years. Specifically, in the first year, LCP leads to a 10 p.p. decrease in innovation activity. In subsequent years, this negative effect weakens but remains significant until the fifth year, when the decline reaches 2 p.p. This suggests that in the short term, LCP exerts significant pressure on this sector, possibly due to high initial costs or the negative impact of changes in the political environment. In the long term, the sector demonstrates an ability to adapt. For energy transition technologies, the impact of LCP is positive, particularly in the first two years. In the first year, innovation activity in this sector increases by 12 p.p., gradually decreasing to 10 p.p. by the fourth year and to 5 p.p. by the fifth year. This may indicate that LCP actively supports the development of energy transition technologies in the short term, possibly through government investments or incentive measures. However, over time, the effect of these measures starts to weaken due to market saturation or a reduction in initial incentives. In the national oil and gas companies sector, a similar positive impact of LCP is observed, especially in the first 2-4 years. In the first year, there is a significant increase in innovation activity by 15 p.p. The average annual decline starting from the second year is 42 p.p. This may suggest that LCP provides strong initial support, fostering the active development of national innovation centers, but the effect of this support diminishes over time.
Discussion of results
Based on the conducted study, recommendations have been formulated to improve the effectiveness of LCP in Russia:
- Development of an industry standard system to enhance the level of unification, followed by a reduction in product cost and an increase in production efficiency.
- Improvement of the methodology for measuring localization levels by including innovation activity indicators for companies in the key metrics list, as well as differentiation by stages of field development.
- Ensuring the availability of reliable data and information on local production and sales potential and demand for developing effective measures for implementing local content. The creation of a regional competency map and monitoring systems is proposed, along with regular updates and public presentation of data for all stakeholders. It is advisable to consider the possibility of integrating this initiative into the framework of the Russian Federation’s Spatial Development Strategy.
- Using the example of cooperation between national companies in China and foreign partners, it is suggested to introduce mandatory terms for technology transfer in contracts with international companies. It is advisable to develop technology transfer centers and joint educational centers based on leading universities for national and foreign companies. In this case, intellectual property rights belong to joint ventures, and development occurs in the country. In this context, the development of intellectual property protection systems is essential, including databases of advanced technologies and developments within strategic partnerships (BRICS, SCO, etc.).
- It is proposed to appoint a technically competent representative from the oil and gas sector at the enterprise. This initiative will address the compliance of all technical and functional requirements and will focus on solving actual and necessary tasks for the oil and gas sector “in practice”, not just “on paper”. The initiative could also develop under Federal Law N 44 dated June 22, 2024, “On the Contract System in the Procurement of Goods, Works, and Services to Meet State and Municipal Needs” (Articles 43 and 48).
- Using the example of industrialization levels and rates achieved in the 1930s, it is proposed to revive the institution of General Constructors. The key task is the formulation of a policy for scientific and technical progress (STP), including in related industries, in collaboration with leading scientific organizations.
- Using the practice implemented in Brazil as an example, it is proposed to introduce minimum local content requirements for each block (deepwater, shallow water, and onshore) and for each phase (exploration and development) into the licensing system for extraction and development (E&P).
- Following the example of Malaysia and in accordance with the target for R&D investments set in the Presidential Decree of the Russian Federation N 309 dated May 7, 2024, “On the National Goals for the Development of the Russian Federation until 2030 and Prospects until 2036”, which outlines a minimum investment of 2 % of GDP in R&D by 2030, it is proposed to set minimum investment levels in R&D for national companies in the sector.
The local content policy should go beyond simply obtaining economic rents and focus on the development of direct and reverse links, as well as demand linkages. It is important to stimulate inter-sectoral initiatives through targeted programs and grants and to support projects aimed at integrating other industries with the oil and gas sector. In this context, the method for solving the responsiveness problem is updated [30].
According to K.Marx, the growth rate of production output differs from the growth rate of public goods by the magnitude of the growth rate of the change in the cost of a unit of output. Thus, within the framework of the local content policy (LCP), it is necessary to achieve the highest growth rates of output with the lowest growth rates of personnel numbers and the rates of reduction in the labor intensity of production. This conclusion can also be drawn by considering neutral technological progress according to Hicks [31].
The economy under consideration involves the change in product output over time, and this change is described by a sequence of state vectors corresponding to the sequence of production cycles. In the state of the economy X(s), let us assume a set of products that can be used in the production cycle s+1.
The task is to minimize the time required for the economy to transition from a given initial state X(0) to any state X. It is therefore natural to consider the limiting matrices of intersectoral influence and the dynamically changing level of localization.
A linear economic model is proposed, covering m products G1, G2, … Gm and n technological processes P1, P2, … Pn. A technological process Pi is characterized by a triple of m-dimensional column vectors ai, bi, li, where ai = (a1i, a2i, …, ami) defines the costs; bi = (b1i, b2i, …, bmi) defines the output of products G1, G2, …, Gm at unit intensity of technological process Pi; li = (l1i, l2i, …, lmi) defines the normative required level of product localization. At intensity xi the following products are consumed (a1ixi, a2ixi, …, amixi), and a set of products is produced (b1ixi, b2ixi, …, bmixi) at the specified localization levels (l1ixi, l2ixi, …, lmixi),
The technological localized growth rate of the j-th product is defined as
Then, the maximum technological growth rate is the non-negative production intensity vector x, satisfying the conditions:
If we now introduce the price vector p = (p1, p2, …, pm) for products G1, G2, …, Gm and the vector of government investments aimed at achieving the required localization level, pl = (pl1, pl2, …, plm), then we obtain:
This is the gross income of the technological process Pi, related to the cost price in terms of the local content level.
Next, it is necessary to place the specified problem in an n-dimensional space of economic sectors:
where each j-th row corresponds to the output produced by the i-th industry to produce one accounting unit of its product; each j-th column represents product flows from the j-th industry to all other industries; that is, the elements of the matrix I determine the unit capital expenditures and depreciation received by industries for the renewal of production assets, attributed to the unit of output.
Thus, the government faces the task of maximizing the technological growth rate αi and the economic growth rate β, given the levels of intersectoral influence (elements of matrix I) and the required share of local content.
To define the given state of the economy X and, as a consequence, the constraints on αi and βi, an upper-level target for the technological development of the country is necessary. According to the Russian Federation Government Resolution N 719 dated July 17, 2015, “On Confirming the Production of Industrial Products in the Territory of the Russian Federation”, the requirements for industrial products, which determine whether a product is considered to be made in the Russian Federation, regulate the establishment of a points-based system for evaluating goods with codes according to OK 034-2014 (CPC 2008). However, the directives of the European Commission list product groups by HS codes without detailing product codes and with general descriptions. To comply with the Government Resolution, a unified system for transferring domestic goods from sanctioned product groups into the OKPD system with subsequent formation of an integral indicator of technological sovereignty is necessary [32-36].
In accordance with the Government of the Russian Federation’s Directive N 1315-r dated May 20, 2023, titled “On Approval of the Technological Development Concept for the Period Until 2030”, the term “technological sovereignty” refers to the presence of critical and cross-cutting technologies within the country, as well as the independent lines of development and conditions for the production of goods based on these technologies. These technologies ensure the state and society’s sustained ability to achieve national development goals and realize national interests [35-37]. Technological sovereignty is ensured in two main forms: research, development, and implementation of critical and crosscutting technologies, as well as the production of high-tech products based on these technologies [38, 39]. It is proposed to consider four integrated indicators to measure the achieved level of technological sovereignty, which describe the availability of a foundation in priority technologies, the level of quantitative training, the level of standardization, and the level of technological independence [40-42]. These four indicators reflect the life cycle of a priority technology in terms of achieving technological sovereignty – capability to develop, produce, and operate the technology [43-45]:
where TS – the level of technological sovereignty ranging from 0 to 100 %; mi – the weight coefficient of the indicators, Σmi =1; R – the indicator of availability of a foundation in priority technologies; E – the indicator of the level of quantitative training; S – an indicator of the level of standards provision; I – the indicator of technological independence; Rt, Et – target values of the indicators.
The indicator of availability of a foundation in priority technologies corresponds to the calculation of the specific level of patent activity:
where p – the number of patents for priority technologies in a year; с – the population of the country during the reporting period.
The target value of the indicator:
where p* – the number of patents for priority technologies in a year in the leading country for this indicator; с* – the population of the leading country during the reporting period.
The indicator of the level of quantitative training characterizes the specific number of specialists trained with secondary technical and higher education in areas necessary for the creation, implementation, and operation of priority technologies:
where t – the number of specialists trained with secondary technical education in priority technologies; u – the number of specialists trained with higher education in priority technologies; с – the population of the country during the reporting period.
The target value of the indicator:
where t* – the number of specialists trained with secondary technical education in priority technologies in the leading country; u* – the number of specialists trained with higher education in priority technologies in the leading country; с* – the population of the leading country during the reporting period.
The indicator of the level of standardization characterizes the availability of a standard for a priority technology:
The indicator of direct technological independence consists of two indicators – the level of readiness of technologies and the level of readiness of production for the researched product (I from 2/19 to 1):
where T – the level of readiness of technologies (according to GOST R 58048-2017 “Technology Transfer”), Т = 1-9; M – the level of readiness of production (according to GOST R 58048-2017 “Technology Transfer”), M = 1-10.
Conclusion
Achieving technological sovereignty is impossible without accelerating technological development; therefore, institutional measures should be focused on increasing the level of innovation activity. Based on the conducted research, recommendations have been formulated for the Russian Federation on ensuring technological development through improving the effectiveness of LCP. A methodology for calculating the level of technological sovereignty has been proposed based on four integrated indicators, and a method for solving the “responsiveness” problem has been updated, taking into account the required level of localization. The criteria for evaluating the effectiveness of the proposed changes include the impulse response magnitude: for energy transition technologies – a 20 percentage point increase in the first 5 years, for exploration and extraction – achieving positive figures, for national vertically intergrated oil and gas companies – extending the period of positive impact by 10 % in the first 6 years.
There are certain risks associated with the implementation of the proposed measures. Decentralization of institutional control may lead to bureaucratic delays and lack of coordination between various agencies, which may slow down decision-making and monitoring processes. Independent external audits may increase administrative costs and create additional barriers for companies. Improving the methodology for measurement requires resources and time to adapt new standards, as well as the participation of virtually all federal executive authorities and statistical agencies in the country. This may cause resistance from businesses, especially during the initial stage of implementation. These factors must be considered when planning and implementing the proposed changes to minimize potential negative consequences and maximize the potential of the proposed measures to enhance the effectiveness of LCP.
References
- Tordo S., Warner M., Mansano O.E., Anouti Y. Local Content Policies in the Oil and Gas Sector. Washington, DC: World Bank, 2013, p. 194. DOI: 10.1596/978-0-8213-9931-6
- Dimelis S., Louri H. Foreign Direct Investment and Efficiency Benefits: A Conditional Quantile Analysis. London: Centre for Economic Policy Research, 2001. CERP Discussion Paper N 2868.
- Peek P., Fenard J., Gantes P., Theiler C. Skills shortages in the global oil and gas industry: How to close the gap. Centre de Recherches Entreprises et Sociétés, 2008. Part 1, p. 82.
- Sasson A., Blomgren R. Knowledge Based Oil and gas Industry. BI Norwegian Business School, 2011. Research Report 3, p. 131.
- Leskinen O., Bekken P.K., Razafinjatovo H., García M. Oil and Gas Cluster: A Story of Achieving Success Through Supplier Development. Harvard Business School, 2012, p. 36.
- Copeland C., Levine L., Mallet W.J. The Role of Public Works Infrastructure in Economic Recovery. CRS Report for Con-gress N R42018. 2011, p. 20.
- Kondratev V. Local Content Policy and Modernisation. World Economy and International Relations. 2017. Vol. 61. N 1, p. 67-77 (in Russian). DOI: 10.20542/0131-2227-2017-61-1-67-77
- Acheampong T., Ashong M., Svanikier V.C. An assessment of local-content policies in oil and gas producing countries. The Journal of World Energy Law & Business. 2016. Vol. 9. Iss. 4, p. 282-302. DOI: 10.1093/jwelb/jww019
- Dmitrievskii A.N., Komkov N.I., Krotova M.V., Romantsov V.S. Strategic alternatives of import substitution of power equip-ment for the oil-and-gas sector. Studies on Russian Economic Development. 2016. Vol. 27. N 1, p. 21-33. DOI: 10.1134/S1075700716010020
- Esteves A.M., Barclay M.-A. Enhancing the benefits of local content: integrating social and economic impact assessment into procurement strategies. Impact Assessment and Project Appraisal. 2011. Vol. 29. Iss. 3, p. 205-215. DOI: 10.3152/146155111X12959673796128
- Markova V.Yu., Shuvalova D.G. The development of a methodology for assessing the level of localization for enterprises of electrical engineering and power engineering. St. Petersburg State Polytechnical University Journal. Economics. 2015. Vol. 6 (233), p. 73-80 (in Russian). DOI: 10.5862/JE.233.8
- Zhdaneev O.V. Technological sovereignty of the Russian Federation fuel and energy complex. Journal of Mining Institute. 2022. Vol. 258, p. 1061-1078. DOI: 10.31897/PMI.2022.107
- Zhdaneev O.V., Zaitsev A.V., Lobankov V.M. Metrological support for the logging while drilling and wireline equipment. Journal of Mining Institute. 2020. Vol. 246, p. 667-677. DOI: 10.31897/PMI.2020.6.9
- Raghuraman B., Gustavson G., Van Hal R.E. et al. Extended-range spectroscopic pH measurement using optimized mixtures of dyes. Applied spectroscopy. 2006. Vol. 60. Iss. 12, p. 1461–1468. DOI: 10.1366/000370206779321535
- Zhdaneev O.V., Korenev V.V., Rubtsov A.S. Key Technology Development Priorities for the Oil Refinery Sector in Russia. Russian Journal of Applied Chemistry. 2020. Vol. 93. N 9, p. 1314-1325. DOI: 10.1134/S1070427220090025
- Fangzheng Cheng, Tian Li, Yi-ming Wei, Tijun Fan. The VEC-NAR model for short-term forecasting of oil prices. Energy Economics. 2018. Vol. 78, p. 656-667. DOI: 10.1016/j.eneco.2017.12.035
- Asali M. Dynamics of petroleum markets in OECD countries in a monthly VAR–VEC model (1995–2007). OPEC Energy Review. 2008. Vol. 32. Iss. 1, p. 54-87. DOI: 10.1111/j.1753-0237.2008.00143.x
- Kryukov V.A., Tokarev A.N. Patents for inventions in the Russian oil and gas sector: an analysis of the knowledge database complexity. IOP Conference Series: Earth and Environmental Science. 2022. Vol. 962. N 012022. DOI: 10.1088/1755-1315/962/1/012022
- Maleki A., Rosiello A. Does knowledge base complexity affect spatial patterns of innovation? An empirical analysis in the upstream petroleum industry. Technological Forecasting and Social Change. 2019. Vol. 143, p. 273-288. DOI: 10.1016/j.techfore.2019.01.020
- Zhdaneev O.V., Ovsyannikov I.R. Influence of External Factors on Innovation Activity of Fuel and Energy Companies. Studies on Russian Economic Development. 2024. Vol. 35. N 2, p. 208-214. DOI: 10.1134/S1075700724020175
- Shao-Chao Ma, Lianyong Feng, Yi Yin, Jianping Wang. Research on petroleum patent valuation based on Value Capture Theory. World Patent Information. 2019. Vol. 56, p. 29-38. DOI: 10.1016/j.wpi.2018.10.004
- Hassani H., Silva E.S., Al Kaabi A.M. The role of innovation and technology in sustaining the petroleum and petrochemical industry. Technological Forecasting and Social Change. 2017. Vol. 119, p. 1-17. DOI: 10.1016/j.techfore.2017.03.003
- Mendonça R.W., de Oliveira L.G. Local Content Policy in the Brazilian Oil and Gas Sectoral System of Innovation. Latin American Business Review. 2013. Vol. 14. Iss. 3-4, p. 271-287. DOI: 10.1080/10978526.2013.833477
- Lebdioui A. Local content in extractive industries: Evidence and lessons from Chile’s copper sector and Malaysia’s petroleum sector. The Extractive Industries and Society. 2020. Vol. 7. Iss. 2, p. 341-352. DOI: 10.1016/j.exis.2019.05.001
- Olawuyi D.S. Local content requirements in oil and gas contracts: regional trends in the Middle East and North Africa. Journal of Energy & Natural Resources Law. 2019. Vol. 37, p. 93-117. DOI: 10.1080/02646811.2018.1477494
- Ma Huimin, Xiang Wu, Li Yan et al. Strategic Plan of “Made in China 2025” and Its Implementation. Analyzing the Impacts of Industry 4.0 in Modern Business Environments. Hershey, PA: IGI Global, 2018, p. 1-23. DOI: 10.4018/978-1-5225-3468-6.ch001
- Ettmayr C., Lloyd H. Local content requirements and the impact on the South African renewable energy sector: A survey-based analysis. South African Journal of Economic and Management Sciences. 2017. Vol. 20. N 1. N a1538. DOI: 10.4102/sajems.v20i1.1538
- Prasetio E.A., Kumalasari E.D. Local Content Policy in Indonesia Oil and Gas Industry. Sovereign Wealth Funds, Local Content Policies and CSR. Cham: Springer, 2021, p. 293-307. DOI: 10.1007/978-3-030-56092-8_16
- Münch F.A., Scheifele F. Nurturing National Champions? Local Content in Solar Auctions and Firm Innovation. Energy Policy. Vol. 179. N 11354. DOI: 10.1016/j.enpol.2023.113574
- Florinsky V.V. Solution of the linear time-optimal problem with two-dimensional control. Research Bulletin of Belgorod State University. Mathematics. Physics. 2015. N 5 (202). Iss. 38, p. 89-95 (in Russian).
- Stein J., Stiglitz J., Uzawa H. Readings in the Modern Theory of Economic Growth. The Journal of Finance. 1969. Vol. 24. N 5, p. 984-985. DOI: 10.2307/2325704
- Prikhodko I.I. Theoretical aspects of the concept of technological sovereignty. Uchenye zapiski V.I.Vernadsky Crimean Federal University. Economics and Management. 2022. Vol. 8 (74). N 4, p. 88-96 (in Russian).
- Leonard M., Pisani-Ferry J., Ribakova E. et al. Securing Europe’s Economic Sovereignty. Survival. 2019. Vol. 61. Iss. 5, p. 75-98. DOI: 10.1080/00396338.2019.1662148
- Couture S., Toupin S. What does the notion of «sovereignty» mean when referring to the digital? New Media & Society. 2019. Vol. 21. Iss. 10, p. 2305-2322. DOI: 10.1177/1461444819865984
- Ramahandry T., Bonneau V., Bani E. et al. Key enabling technologies for Europe’s technological sovereignty. Scientific Foresight Unit; European Parliamentary Research Service, 2021, p. 108. DOI: 10.2861/24482
- Crespi F., Caravella S., Menghini M., Salvatori C. European Technological Sovereignty: An Emerging Framework for Policy Strategy. Intereconomics. 2021. Vol. 56. Iss. 6, p. 348-354. DOI: 10.1007/s10272-021-1013-6
- Grassano N., Hernández Guevara H., Fako P. et al. The 2022 EU Industrial R&D Investment Scoreboard – Extended Summary of Key Findings and Policy Implications. Luxembourg: Publications Office of the European Union, 2022, p. 27. DOI: 10.2760/08410
- Daneikin Yu.V. Achieving technological sovereignty of high-tech sectors of the Russian economy: state and prospects. RSUH/RGGU Bulletin. “Economics. Management. Law”. 2022. N 4, p. 74-92 (in Russian). DOI: 10.28995/2073-6304-2022-4-74-92
- Konstantinov I.B., Konstantinova E.P. Technological sovereignty as a strategy for the future development of the Russian economy. Bulletin of the Volga Region Institute of Administration. 2022. Vol. 22. N 5, p. 12-22 (in Russian). DOI: 10.22394/1682-2358-2022-5-12-22
- Kamchatova E.Y., Muratova M.N. The possibilities of using the resource approach in ensuring the technological sovereignty of the industry of the Russian Federation. Innovations and Investments. 2023. N 2, p. 196-201 (in Russian).
- Sukharev O.S. Technological sovereignty: solutions at the macroeconomic and industry level. Microeconomics. 2023. N 2, p. 19-33 (in Russian). DOI: 10.33917/mic-2.109.2023.19-33
- Yurevich M.A. Technological Sovereignty of Russia: Concept, Measurement, and Possibility of Achievement. Issues of Economic Theory. 2023. N 4, p. 7-21 (in Russian). DOI: 10.52342/2587-7666VTE_2023_4_7_21
- Mazzucato M., Cimoli M., Dosi G. et al. Which Industrial Policy Does Europe Need? Intereconomics. 2015. Vol. 50. Iss. 3, p. 120-155. DOI: 10.1007/s10272-015-0535-1
- Grant P. Technological sovereignty: forgotten factor in the ‘hi-tech’ razzamatazz. Prometheus. 1983. Vol. 1. N 2, p. 239-270. DOI: 10.1080/08109028308628930
- Edler J., Blind K., Kroll H., Schubert T. Technology sovereignty as an emerging frame for innovation policy. Defining ra-tionales, ends and means. Research Policy. 2023. Vol. 52. Iss. 6. N 104765. DOI: 10.1016/j.respol.2023.104765