
Physico-chemical aspects and carbon footprint of hydrogen production from water and hydrocarbons
- 1 — Ph.D., Dr.Sci. Director A.V.Topchiev Institute of Petrochemical Synthesis, RAS ▪ Orcid
- 2 — Ph.D., Dr.Sci. Deputy Head of Department – Head of Directorate PAO Gazprom ▪ Orcid
- 3 — Ph.D., Dr.Sci. Director Tatar Oil Research and Design Institute (TatNIPIneft) of PAO TATNEFT ▪ Orcid
- 4 — Ph.D. Head of Division PAO Gazprom ▪ Orcid
- 5 — Ph.D. Head of the Laboratory OOO Gazprom VNIIGAZ ▪ Orcid
- 6 — Chief Technologist PAO Gazprom ▪ Orcid
Abstract
Physico-chemical aspects determine the efficiency and competitiveness of hydrogen production technologies. The indicator of water consumption is especially relevant, since water is one of the main sources of hydrogen in almost all methods of its production. The article analyzes comparative water consumption indicators for various technologies based on published research and actual data from production plants. The volume of water consumption depends on the quality of the source water, which should be taken into account when implementing hydrogen projects in order to minimize the negative impact on the environment. Based on the operating industrial plant, the material balance of hydrogen production by steam reforming was demonstrated, which made it possible to determine the proportion of hydrogen (48.88 %) obtained from water. Currently, the carbon footprint indicator is becoming more important, reflecting greenhouse gas emissions throughout the production chain. According to the results of the total greenhouse gas emissions assessment for hydrogen production by steam reforming (about 10.03 kg CO2-eq/kg H2), the carbon footprint of hydrogen from water (4.2-4.5 kg CO2-eq/kg H2) and hydrogen from methane (15.4-15.7 kg CO2-eq/kg H2) has been determined. Consequently, almost half of the hydrogen produced by steam reforming is produced from water, corresponds to the indicators of “low-carbon” hydrogen and can be considered as “renewable” hydrogen. To make management decisions, an objective assessment in terms of energy and water costs is necessary based on a system analysis by the development of hydrogen energy and the growth of global hydrogen production. The impact of these indicators on the water cycle and global water resources will increase.
None
Introduction
Currently, there are trends in expanding the field of hydrogen usage worldwide (energy, transport, etc.), however, when planning new hydrogen projects, sufficient attention is often not paid to the real indicators of water consumption. Water is one of the main sources of hydrogen in almost all methods of its production. These methods differ in the method of obtaining and additional sources of hydrogen (hydrocarbons, biomass, etc.).
Water is one of the key resources in energy production, where it is used as a coolant, refrigerant, working fluid, and also in the extraction of fossil energy carriers. On the other hand, energy consumption is necessary for the operation of water supply and sanitation systems, desalination, etc. [1, 2]. In international practice, the term water-energy nexus is used to denote the relationship between water use and energy[3, 4], the problem of equilibrium in this field remains relevant in the conditions of decarbonization.
According to the estimates of the International Energy Agency, energy costs here will more than double by 2040*. The dependence between water and energy is particularly relevant for the hydrogen economy considering the impact of increased hydrogen production (primarily from water) on water resources and systems.
Hydrogen production is associated with the consumption of a significant amount of water, and therefore the influence of this factor on the overall growth rate of low carbon footprint production is important. Hydrogen production involves the mandatory use of water as a raw material and its reduction to hydrogen using coal (coal gasification), methane (steam reforming, autothermal reforming, partial oxidation), biomass (biomass gasification) and electricity (electrolysis) [5-8]. As a result, up to 100 % of hydrogen is formed from the water. Water is the only source of hydrogen for processes diametrically opposite in terms of carbon footprint, such as coal gasification and electrolysis. Despite the dominance of hydrogen produced from natural gas in industry [9], hydrogen production from water is gaining momentum; provided that renewable energy is used, it can result in a relatively small carbon footprint [10, 11].
The main purpose of this study is to compare water consumption for various hydrogen production methods, as well as determine the proportion of hydrogen produced from water during steam reforming of natural gas, and estimate the carbon footprint of hydrogen from water and methane based on data from the material balance of hydrogen production by steam reforming.
Comparison of water consumption for various hydrogen production technologies
The assessment of hydrogen in terms of energy and water costs requires verification in terms of water consumption. With the growth of hydrogen production, the factor of provision, consumption and management of water resources will become more important. The initiator of hydrogen projects needs a comprehensive interaction with the water sector in terms of evaluating the methods and consequences of using water in the production of all types of hydrogen. A key success factor is the formation of a sustainable approach to the choice of sources and methods of water utilization, as well as reducing the overall water consumption for hydrogen projects [12]. The implementation of this approach will eliminate the negative impact of hydrogen projects on communities experiencing water scarcity, as well as prevent the aggravation of current water security problems.
An important factor is the requirements for water quality used in the production of hydrogen. At all stages of water purification, losses and the formation of polluted effluents requiring purification are possible [13]. The process of obtaining water of the required quality for electrolysis and steam reforming can be associated with filtration, desalination and/or demineralization (depending on the type and quality of available water sources). During the process of ultrafiltration water losses can reach 10 vol.%, and for reverse osmosis, they amount to 15-25 % for ordinary water, 20-30 % for wastewater, 35-40 % for seawater. Liquid effluents generated during the water treatment process should be disposed of in order to minimize the negative impact on the environment. Their value can range from 7 % for ultrafiltration to 21 % for reverse osmosis [14].
The research uses publications on this topic [15-17], as well as actual data from production plants for steam reforming of natural gas.
When hydrogen is produced by the most common methane steam reforming method, the stoichiometric indicator of water consumption is only 4.5 liters of H2O per 1 kg of H2 [18]. It is necessary to take into account the losses of steam and cooling water that occur during the steam conversion process. Steam generation requires 7.35 liters of H2O, and 38 liters for cooling systems [19]. Taking into account the losses in these processes, the water consumption turns out to be significantly higher and can reach from 5.85 to 13.2 liters [20]. The value is specified to the consumption of demineralized (desalinated) water and its losses.
To determine the actual water consumption, it is necessary to take into account the amount of waste generated during the water treatment process. This indicator depends on the quality of the source or raw water (river, sea or water used in the extraction of methane). Taking into account the listed additional indicators, the real value of water consumption in the production of hydrogen, depending on the water source, may, according to various data, be 13-40 liters of H2O per 1 kg of H2 produced [21-22].
Water consumption indicators of alternative natural gas conversion technologies (partial oxidation, autothermal reforming) may initially be lower. For autothermal reforming this value approaches 7.4 liters of H2O per 1 kg of H2 produced [23]. The full use of the carbon-containing feed potential to achieve maximum hydrogen yield requires a water-gas shift reaction between carbon monoxide and water steam, i.e. an additional amount of water steam consumption. The actual water consumption in hydrogen production by these methods will be comparable, and in some cases even higher than the same indicator for the steam reforming process.
Thus, when obtaining “low-carbon” hydrogen (with CO2 capture), the actual consumption increases by 85 % [24] and, taking into account CO2 capture, steam compression and water cooling can be 18-44 liters of H2O per 1 kg of H2 produced [21].
For coal based hydrogen production, the actual water consumption can be 30-70 liters of H2O per 1 kg of H2 produced for hard coal and 25-60 liters of H2O per 1 kg of H2 produced for lignite coal due to its higher humidity. It takes about 12 liters of water directly to carry out the reaction [25, 26].
For steam conversion of biogas, the stoichiometric indicator of water consumption is equal to the same indicator of the steam conversion process of natural gas (4.5 liters of H2O per 1 kg of H2). However, taking into account the heat losses for removing CO2 from biogas before reforming, the actual water consumption may be 15-40 liters of H2O per 1 kg of H2 produced [27]. The biogas production itself is very water-intensive in addition [28].
The stoichiometric indicator of water consumption for the water electrolysis process is 9 liters of H2O per 1 kg of H2, which is twice as high as the same indicator for the steam conversion of natural gas. Additional factors affecting the water consumption indicators of the water electrolysis process should also be indicated, which are often omitted or not fully taken into account when conducting a feasibility study of projects [29, 30]:
- water cooling of electrolyzers – the one of the key reasons for the decrease in the efficiency of electrode battery during the service life (8-10 years) is additional heating, and therefore the cooling load on the electrolyzer during operation can increase by 40-70 %. The effect of this factor on the water consumption index is 30-40 liters of H2O per 1 kg of H2 [31];
- water cooling of related equipment, such as compressors to compress hydrogen to the pressure required for storage/application;
- purification of the source (raw) water – depending on the quality of the source water, the amount of waste (effluents) of the purification process can be 20-40 %;
- wastewater disposal – an increased concentration of impurities in the composition of wastewater in most cases prevents the discharge of these wastewater into the environment in its pure form; additional purification or dilution may be required for wastewater disposal.
The actual water consumption for water electrolysis process, taking into account the listed additional factors, may be 60-95 liters of H2O per 1 kg of H2. At the same time, 60-70 % of the total amount of water consumed falls on the recharge of water cooling systems. The general scheme of the water consumption in the process of water electrolysis process is shown in Figure [31].
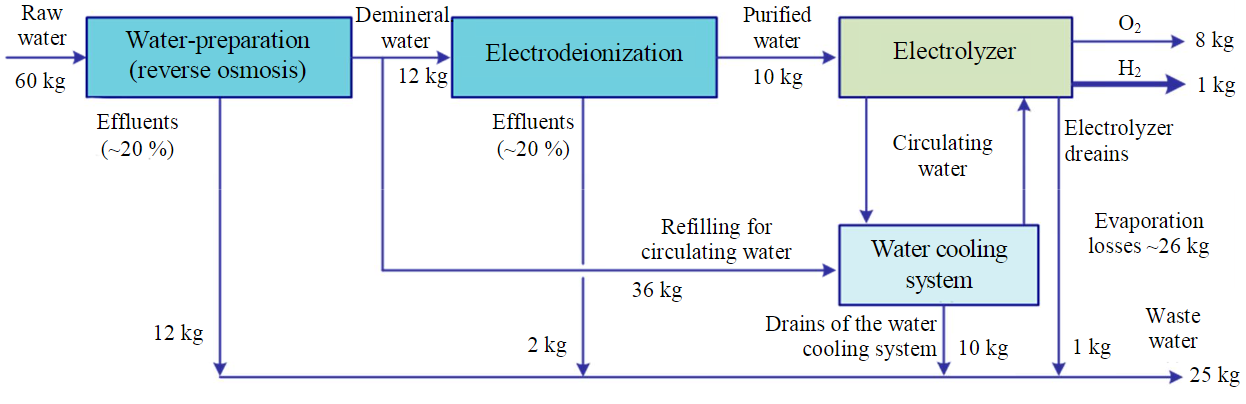
Water consumption in the process of water electrolysis
Приведенные показатели водопотребления возможны при использовании в качестве исходного сырья пресной воды относительно хорошего качества. Для воды с повышенным солесодержанием, морской воды либо промышленных сточных вод показатели потребления сырой воды и количество стоков процесса может существенно увеличиться [32].
Table 1
Water consumption for various hydrogen production methods
|
Production method |
Water consumption, liters of H2O per 1 kg of H2 |
|
|
Stoichiometric |
Actual |
|
|
Steam methane reforming |
4.5 |
15-40 |
|
Steam methane reforming + СО2 capture |
4.5 |
18-44 |
|
Steam biogas reforming |
4.5 |
20-45 |
|
Hard coal gasification |
Depending on С:Н ratio andon coal humidity |
~70 |
|
Lignite coal gasification |
~60 |
|
|
Water electrolysis |
9 |
60-95 |
Table 1 provides a summary of water consumption indicators for the production of various types of hydrogen in accordance with the modern color classification.
An increase in hydrogen production can lead to an increase in water consumption in this segment by 35-100 %. Taking into account the projected volume of hydrogen consumption (70 EJ), in 2050 the total volume of water consumption in the hydrogen production segment may amount to 35-55 thousand tons per year, which is expected to create additional demand for water resources and, as a result, increase the threat of violations of water security in a number of nations.
One of the key tasks of the hydrogen economy development is the ways optimizing for hydrogen storage and the end user delivery. Currently, possible methods of hydrogen transportation, in addition to liquefaction, are the liquid organic carriers (LOHC)* and the use of a chemically bound form (as part of ammonia). The application of each of these methods is associated with an appropriate technology involving the consumption of steam, demineralized and/or cooling water. Despite the fact that water consumption is not a key indicator when choosing a method for storing and transporting hydrogen, it should be taken into account when planning new hydrogen projects.
When developing measures to optimize water consumption in new hydrogen projects, a special attention should be paid to reducing the consumption of make-up cooling water. This indicator is dominant in the overall structure of water consumption and consists of losses for evaporative cooling in cooling towers (~75 %), water cooling blowdown system (~15 %), as well as some additional losses [33-35].
Water consumption for various ways of hydrogen production, depending on the quality of the source water
In addition to optimizing water consumption, an important criterion for the effectiveness of hydrogen projects is the type of water resources. There are three main types of water resources for hydrogen projects: freshwater, seawater, and industrial wastewater. Using fresh water is the least expensive, though not the best option, because in this case hydrogen production uses water resources, which could find a more effective use in other segments of the economy and social sphere.
Hydrogen production plants are usually located in close proximity to other industrial enterprises and settlements, which makes it possible to use significant amounts of industrial and domestic wastewater. The use of wastewater is associated with an increase in treatment costs; however, it may have advantages in terms of reducing the length of the water pipeline, transportation costs, as well as the cost of source water [33-35].
The use of seawater is the only realistic source of water resources for most large-scale hydrogen production facilities from water. At the same time, the total water consumption, depending on the quality of the source water, may significantly exceed the analogous indicator when using fresh water [14, 36, 37]. The process of seawater desalination is associated with an increase burden on the environment, in connection with which the procedures for environmental assessment, obtaining permits, approvals, etc. can significantly increase the time and investment costs for the implementation of hydrogen projects. At the same time, energy costs for hydrogen production are also increasing, since water purification is an energy-intensive technology [14].
The prospective energy consumption indicator of a desalination plant averages ~0.5 kWh per 1 kg of H2, which is insignificant in comparison with ~50 kWh per 1 kg of H2 required during electrolysis, but in some cases it may be a significantly higher cost for the entire system – from 7 to 20 kWh [31]. The most common modern water desalination process is reverse osmosis, and thermal desalination (distillation) is used on a significant scale (especially in the Middle East). Other processes – direct osmosis, membrane purification, ion exchange, electrodialysis, etc. – are at various stages of commercialization and applied research. The development and optimization of water desalination technologies will have a fundamental impact on the efficiency of hydrogen projects in the future.
In the Table 2 provides comparative estimates of the water consumption of hydrogen projects using freshwater (the best option) and seawater (the worst option).* It should be noted that the water consumption in obtaining hydrogen exclusively from fresh water turns out to be comparable to that for the method with the highest carbon footprint (coal gasification) and with the lowest carbon footprint (electrolysis using “green” electricity). Water consumption when using seawater is proving to be record-breaking. It is assumed that when using industrial or domestic wastewater as a source, water consumption indicators will be in the range between the values obtained for the best and worst options.
Table 2
Water consumption for various hydrogen production methods depending on the quality of the source water
|
Production method |
Water consumption, liters of H2O per 1 kg of H2 |
|
|
Freshwater,evaporative cooling |
Seawater, evaporative cooling |
|
|
Steam methane reforming |
15-40 |
38-100, occasional up to 200 |
|
Steam methane reforming + СО2 capture |
18-44 |
45-100, occasional up to 220 |
|
Steam biogas reforming |
20-45 |
50-113, occasional up to 225 |
|
Hard coal gasification |
~70 |
175-350 |
|
Lignite coal gasification |
~60 |
150-300 |
|
Water electrolysis |
60-95 |
150-238, occasional up to 475 |
Estimation of the carbon footprint of hydrogen production by steam reforming of methane based on the data of the material balance of the production plant
The production of hydrogen from water is often classified as the production of “renewable” hydrogen through the circulation of water, but water is also a source of hydrogen for the steam conversion of methane or hydrocarbons mixtures, one of the main industrial methods for producing hydrogen currently in use. In the framework of hydrogen production at existing industrial steam reforming plants, methane interacts with water vapor in the presence of catalysts in two stages [8] according to the equations:
Overall reaction:
Considering the amount of hydrogen produced from methane and water, it can be noted that of the total amount of hydrogen in four molecules, two of them belonged to water and two to methane, i.e. the ratio according to the stoichiometric equation is 50/50. In the Table 3 presents data on the material balance of hydrogen production at a real-life industrial plant. It can be seen that the yield of hydrogen from water, taking into account the estimated losses, was 48.88 %, which, taking into account possible errors, can be considered confirmation that during the steam conversion of methane, half of the hydrogen produced base on water and for this part of hydrogen the carbon footprint is significantly lower.
Table 3
Initial data on the material balance of hydrogen production by steam reforming at an industrial plant
|
Stream |
Consumption and share |
|
|
t (m3)/h |
% |
|
|
Feed |
|
|
|
Natural gas |
6.423 |
19.04 |
|
Desalinated water |
27.304 |
80.96 |
|
Total |
33.727 |
100 |
|
Output |
|
|
|
Hydrogen |
2.248 |
6.67 |
|
Water steam 16 Atm. |
15.503 |
45.97 |
|
Residual gas |
15.356 (15.652) |
45.53 |
|
Deaerator Air bag |
0.171 |
0.50 |
|
Other losses |
0.449 |
1.33 |
|
Total |
33.727 |
100 |
Based on the data of the technological process, it was determined that the cost of methane for the operation of the reformer is 0.1814 MJ/mol H2. It should be noted that the heat of most natural gas steam reforming processes is utilized for power generation. When calculating greenhouse gas emissions from steam reforming of natural gas, it was determined that the water in the reaction itself has zero CO2 emissions-eq, the carbon dioxide formed in the process itself belongs to methane, since it is formed in any case regardless of the oxidizer. The calculation is based on the highest calorific value.
In the very process of steam reforming of natural gas, according to stoichiometry, 0.8721 mol CO2/MJ H2 is formed from methane. Accordingly, 38.3805 g of CO2/MJ H2 is formed for overall hydrogen. For carbon dioxide attribution to hydrogen from methane – 76.761 g CO2/MJ H2,
For the reformer to work in the steam reforming of natural gas, it is necessary to ensure its heating by external burner devices, which will be equivalent to 31.6463 g of CO2/MJ H2, and it is part of these emissions that can be attributed to hydrogen from water.
Thus, the total greenhouse gas emissions with uniform distribution will amount to 10.03 kg CO2-eq/kg H2. Under given conditions, within the framework of steam reforming of natural gas, the carbon footprint of hydrogen from methane will amount to 15.4-15.7 kg CO2-eq/kg H2, and the carbon footprint of hydrogen from water will amount to 4.2-4.5 kg CO2-eq/kg H2.
Evaluating hydrogen in terms of energy and water costs requires a system analysis. The unilateral practice of supporting only one group of technologies has a significant negative impact on the implementation of scientifically based hydrogen projects [38, 39]. Technological neutrality makes it possible to determine the most optimal solutions in the field of hydrogen energy development based on an interdisciplinary analysis.
Conclusion
The results of the comparative analysis carried out in this study show that water consumption in the steam reforming hydrogen production is significantly lower than by electrolysis hydrogen production.
Based on the data of the material balance of operating hydrogen production plant, it was revealed that hydrogen produced by the traditional steam conversion method is almost 50 % “renewable” and “low-carbon” in terms of the raw materials used – water and the carbon footprint index.
It should be noted that with the development of the hydrogen economy and the growth of global hydrogen production from water, the influence of this segment on the water cycle and global water resources will significantly increase.
References
- Gleick P.H. Water and Energy. Annual Review of Energy and the Environment. 1994. Vol. 19, p. 267-299. DOI: 10.1146/annurev.eg.19.110194.001411
- Grubert E., Sanders K.T. Water Use in the United States Energy System: A National Assessment and Unit Process Inventory of Water Consumption and Withdrawals. Environmental Science & Technology. 2018. Vol. 52. Iss. 11, p. 6695-6703. DOI: 10.1021/acs.est.8b00139
- Helerea E., Calin M.D., Musuroi C. Water Energy Nexus and Energy Transition – A Review. Energies. 2023. Vol. 16. Iss. 4. N 1879. DOI: 10.3390/en16041879
- Bauer D., Philbrick M., Vallario B. The Water-Energy Nexus: Challenges and Opportunities. Overview and Summary. U.S. Department of Energy. 2014, p. 12.
- Parkinson B., Tabatabaei M., Upham D.C. et al. Hydrogen production using methane: Techno-economics of decarbonizing fuels and chemicals. International Journal of Hydrogen Energy. 2018. Vol. 43. Iss. 5, p. 2540-2555. DOI: 10.1016/j.ijhydene.2017.12.081
- Midilli A., Kucuk H., Topal M.E. et al. A comprehensive review on hydrogen production from coal gasification: Challenges and Opportunities. International Journal of Hydrogen Energy. 2021. Vol. 46. Iss. 50, p. 25385-25412. DOI: 10.1016/j.ijhydene.2021.05.088
- Megía P.J., Vizcaíno A.J., Calles J.A., Carrero A. Hydrogen Production Technologies: From Fossil Fuels toward Renewable Sources. A Mini Review. Energy & Fuels. 2021. Vol. 35. Iss. 20, p. 16403-16415. DOI: 10.1021/acs.energyfuels.1c02501
- Massarweh O., Al-Khuzaei M., Al-Shafi M. et al. Blue hydrogen production from natural gas reservoirs: A review of application and feasibility. Journal of CO2 Utilization. 2023. Vol. 70. N 102438. DOI: 10.1016/j.jcou.2023.102438
- Litvinenko V.S., Tsvetkov P.S., Dvoynikov M.V., Buslaev G.V. Barriers to implementation of hydrogen initiatives in the context of global energy sustainable development. Journal of Mining Institute. 2020. Vol. 244, p. 428-438. DOI: 10.31897/PMI.2020.4.5
- Tabrizi M.K., Famiglietti J., Bonalumi D., Campanari S. The Carbon Footprint of Hydrogen Produced with State-of-the-Art Photovoltaic Electricity Using Life-Cycle Assessment Methodology. Energies. 2023. Vol. 16. Iss. 13. N 5190. DOI: 10.3390/en16135190
- Aghakhani A., Haque N., Saccani C. et al. Direct carbon footprint of hydrogen generation via PEM and alkaline electrolysers using various electrical energy sources and considering cell characteristics. International Journal of Hydrogen Energy. 2023. Vol. 48. Iss. 77, p. 30170-30190. DOI: 10.1016/j.ijhydene.2023.04.083
- Mehmeti A., Angelis-Dimakis A., Arampatzis G. et al. Life Cycle Assessment and Water Footprint of Hydrogen Production Methods: From Conventional to Emerging Technologies. Environments. 2018. Vol. 5. Iss. 2. N 24. DOI: 10.3390/environments5020024
- Simoes S.G., Catarino J., Picado A. et al. Water availability and water usage solutions for electrolysis in hydrogen production. Journal of Cleaner Production. 2021. Vol. 315. N 128124. DOI: 10.1016/j.jclepro.2021.128124
- Plappally A.K., Lienhard V.J.H. Energy requirements for water production, treatment, end use, reclamation, and disposal. Renewable and Sustainable Energy Reviews. 2012. Vol. 16. Iss. 7, p. 4818-4848. DOI: 10.1016/j.rser.2012.05.022
- Dvoynikov M., Buslaev G., Kunshin A. et al. New Concepts of Hydrogen Production and Storage in Arctic Region. Resources. 2021. Vol. 10. Iss. 1. N 3. DOI: 10.3390/resources10010003
- Zhukovskiy Y., Tsvetkov P., Buldysko A. et al. Scenario Modeling of Sustainable Development of Energy Supply in the Arctic. Resources. 2021. Vol. 10. Iss. 12. N 124. DOI: 10.3390/resources10120124
- Buslaev G., Lavrik Al., Lavrik An., Tcvetkov P. Hybrid system of hydrogen generation by water electrolysis and methane partial oxidation. International Journal of Hydrogen Energy. 2023. Vol. 48. Iss. 63, p. 24166-24179. DOI: 10.1016/j.ijhydene.2023.03.098
- Spath P.L., Mann M.K. Life Cycle Assessment of Hydrogen Production via Natural Gas Steam Reforming. Technical Report NREL/TP-570-27637. 2001. N 33067001, p. 33. DOI: 10.2172/764485
- Saulnier R., Minnich K., Sturgess P.K. Water for the Hydrogen Economy. WaterSMART Solutions Ltd. 2020, p. 13.
- Ogden J.M. Review of small stationary reformers for hydrogen production. International Energy Agency. N IEA/H2/TR-02/002. 2002, p. 52.
- Lampert D.J., Cai H., Wang Zh. et al. Development of a Life Cycle Inventory of Water Consumption Associated with the Production of Transportation Fuels. U.S. Department of Energy. N ANL/ESD-15/27. 2015, p. 80.
- Simon A.J., Daily W., Whitу R.G. Hydrogen and Water: An Engineering, Economic and Environmental Analysis. U.S. Department of Energy. Technical Report LLNL-TR-422193. 2010. N 110388, p. 26. DOI: 10.2172/101038
- Matthey J. LCH™ Process for the production of blue hydrogen. Johnson Matthey Group. 2022, p. 10.
- Rosa L., Sanchez D.L., Realmonte G. et al. The water footprint of carbon capture and storage technologies. Renewable and Sustainable Energy Reviews. 2021. Vol. 138. N 110511. DOI: 10.1016/j.rser.2020.110511
- Milbrandt A., Mann M. Hydrogen Resource Assessment. Hydrogen Potential from Coal, Natural Gas, Nuclear, and Hydro Power. Technical Report NREL/TP-560-42773. 2009, p. 30.
- Chaowei Wang, Song He, Sheng Li, Lin Gao. Water saving potential of coal-to-synthetic natural gas. Journal of Cleaner Production. 2021. Vol. 280. Part 1. N 124326. DOI: 10.1016/j.jclepro.2020.124326
- Schiaroli N., Volanti M., Crimaldi A. et al. Biogas to Syngas through the Combined Steam/Dry Reforming Process: An Environmental Impact Assessment. Energy & Fuels. 2021. Vol. 35. Iss. 5, p. 4224-4236. DOI: 10.1021/acs.energyfuels.0c04066
- Markard J., Wirth S., Truffer B. Institutional dynamics and technology legitimacy – A framework and a case study on biogas technology. Research Policy. 2016. Vol. 45. Iss. 1, p. 330-344. DOI: 10.1016/j.respol.2015.10.009
- Grubert E. Water consumption from electrolytic hydrogen in a carbon-neutral US energy system. Cleaner Production Letters. 2023. Vol. 4. N 100037. DOI: 10.1016/j.clpl.2023.100037
- Lampert D.J., Cai H., Elgowainy A. Wells to wheels: water consumption for transportation fuels in the United States. Energy & Environmental Science. 2016. Vol. 9. Iss. 3, p. 787-802. DOI: 10.1039/C5EE03254G
- Brannock M.W.D., Dagg B.J., Mitchell K.P. Water for hydrogen production: challenges and opportunities supported by real-world case studies. The International Desalination Association International World Congress “Charting Resilient Water Solutions”, 9-13 October 2022, Sydney, Australia. № IDAWC22-Brannock, p. 9.
- Jones E., Qadir M., van Vliet M.T.H. et al. The state of desalination and brine production: A global outlook. Science of the Total Environment. 2019. Vol. 657, p. 1343-1356. DOI: 10.1016/j.scitotenv.2018.12.076
- Hamawand I. Energy Consumption in Water/Wastewater Treatment Industry – Optimisation Potentials. Energies. 2023. Vol. 16. Iss. 5. N 2433. DOI: 10.3390/en16052433
- Tchobanoglous G., Burton F.L., Stensel H.D., Tsuchihashi R. Wastewater Engineering: Treatment and Resource Recovery. New York: McGraw Hill, 2013, p. 2048.
- Corominas L., Foley J., Guest J.S. et al. Life cycle assessment applied to wastewater treatment: State of the art. Water Research. 2013. Vol. 47. Iss. 15, p. 5480-5492. DOI: 10.1016/j.watres.2013.06.049
- Kavitha J., Rajalakshmi M., Phani A.R., Padaki M. Pretreatment processes for seawater reverse osmosis desalination systems – A review. Journal of Water Process Engineering. 2019. Vol. 32. N 100926. DOI: 10.1016/j.jwpe.2019.100926
- Xiaolei Zhang, Jingjing Jiang, Fang Yuan et al. Estimation of water footprint in seawater desalination with reverse osmosis process. Environmental Research. 2022. Vol. 204. Part D. N 112374. DOI: 10.1016/j.envres.2021.112374
- Kopteva A., Kalimullin L., Tcvetkov P., Soares A. Prospects and Obstacles for Green Hydrogen Production in Russia. Energies. 2021. Vol. 14. Iss. 3. N 718. DOI: 10.3390/en14030718
- Zagashvili Y., Kuzmin A., Buslaev G., Morenov V. Small-Scaled Production of Blue Hydrogen with Reduced Carbon Footprint. Energies. 2021. Vol. 14. Iss. 16. N 5194. DOI: 10.3390/en14165194