Magmatic system of the Klyuchevskoy volcano according to seismic data and their geomechanical interpretation
- 1 — Ph.D., Dr.Sci. Petropavlovsk-Kamchatsky Institute of Volcanology and Seismology FEB RAS ▪ Orcid
- 2 — Ph.D. Senior Researcher Institute of Volcanology and Seismology FEB RAS ▪ Orcid
- 3 — Junior Researcher Institute of Volcanology and Seismology FEB RAS ▪ Orcid
- 4 — Junior Researcher Institute of Volcanology and Seismology FEB RAS ▪ Orcid
Abstract
3D analysis of the magma transport and accumulation mechanism in the structure and basement of the Klyuchevskoy volcano preceding 11 eruptions in 2003-2021 has been performed. Using the Frac-Digger method and seismological data from the Kamchatka Branch Federal Research Center United Geophysical Survey Russia Academy of Sciences it has been shown that magma transport from the deep crustal magma chamber (−30 km) is carried out in the vertical fracturing (dykes) mode to the peripheral shallow magma chamber (+1 km). The feeding dykes orientation corresponds to geomechanical conditions of radial or N-NNE extension. This is followed by inclined dykes and sills of various orientations from the peripheral magmatic chamber. Magma accumulation in the peripheral magmatic chamber in the form of sills (in the horizontal fracturing mode at elevations of +0,3 to +2,3 km) contributes to the efficiency of magma degassing and heat exchange with meteoric waters, and to the formation of a high-pressure vapour-gas reservoir with subsequent venting of the volcano channel and its eruption. Three-dimensional analysis of the distribution of flank eruptions of the Klyuchevskoy volcano in 1932-2021 (16 cinder cones) shows their association with two main low-inclined structural surfaces. Changes in the drainage level of the magmatic system are reflected in the volumes and geochemical history of the 1932-2021 flank eruption products.
The research was supported by the grant of the Russian Science Foundation “Studies of magma-gas-water-conducting systems of active volcanoes” N 23-27-00127.
Introduction
Studies of the magmatic systems of active volcanoes provide information on the transport and accumulation conditions of magmatic and water-gas fluids over the entire depth range of the Earth's crust. The transport of magmatic fluids in the Earth's crust is carried out in the fracturing mode with formation of dykes and sills, magmatic chambers, where hydrothermal ore and steam-water deposits are forming during the post-magmatic activity [1]. The example of one such deposit is Guanajuato, Mexico, where the gold production since 1548 has been 360 tons from three main hydrothermal veins of northwest strike in rhyolites, one of which, Veta Medra, is 23 km long [2].
At the Mutnovsky vapor-hydrothermal field, the “Main” productive fault extending more than 10 km from the magmatic chamber of the Mutnovsky volcano provides the heat transfer for the Mutnovsky Geothermal Power Plants with capacity of 62 MWe [1, 3]. Enormous reserves of geothermal energy in the Earth's crust of 14 ∙ 1021 J (in the depth range of 3 to 10 km) remains undeveloped due to the impossibility of creating the EGS (Enhanced Geothermal Systems, artificially created geothermal circulation systems [4]), although in natural conditions such systems are formed before our eyes by active volcanoes under the magmatic fracking mechanism [3]. The problems of development of volcanogenic oil and gas reservoirs of complex structure, as well as the issues of radioactive waste (RW) storage in crystalline rock arrays ruptured by dyke complexes are related to the same issue. Volcanic hazard and the need to forecast catastrophic eruptions of the most active volcanoes (Sheveluch, Bezymianny, Klyuchevskoy and Karymsky in Kamchatka [5]) are also important problems. The Klyuchevskoy Group of Volcanoes (KGV) is of great interest as an active natural laboratory for the real-time dykes and sills formation with the possibility of their timing and 3D visualization based on seismic and petrological data. In recent years, there has been an active publishing activity in this field of research, both on the examples of volcano-tectonic events [6-8] as well as on volcanic eruptions [9, 10].
The KGV includes the active volcanoes Klyuchevskoy, Krestovsky, Ushkovsky, Bezymianny (Fig.1) and Plosky Tolbachik; 80 km north-east of Klyuchevskoy volcano is an active volcano Shiveluch. The giant Klyuchevskoy stratovolcano (less than 7 thousand years old) is the most productive. It erupts an average of 60 million metric tons of basalt per year, or 1/4 of the total annual amount of magma from all the 70 volcanoes of the Kuril-Kamchatka volcanic belt [11].
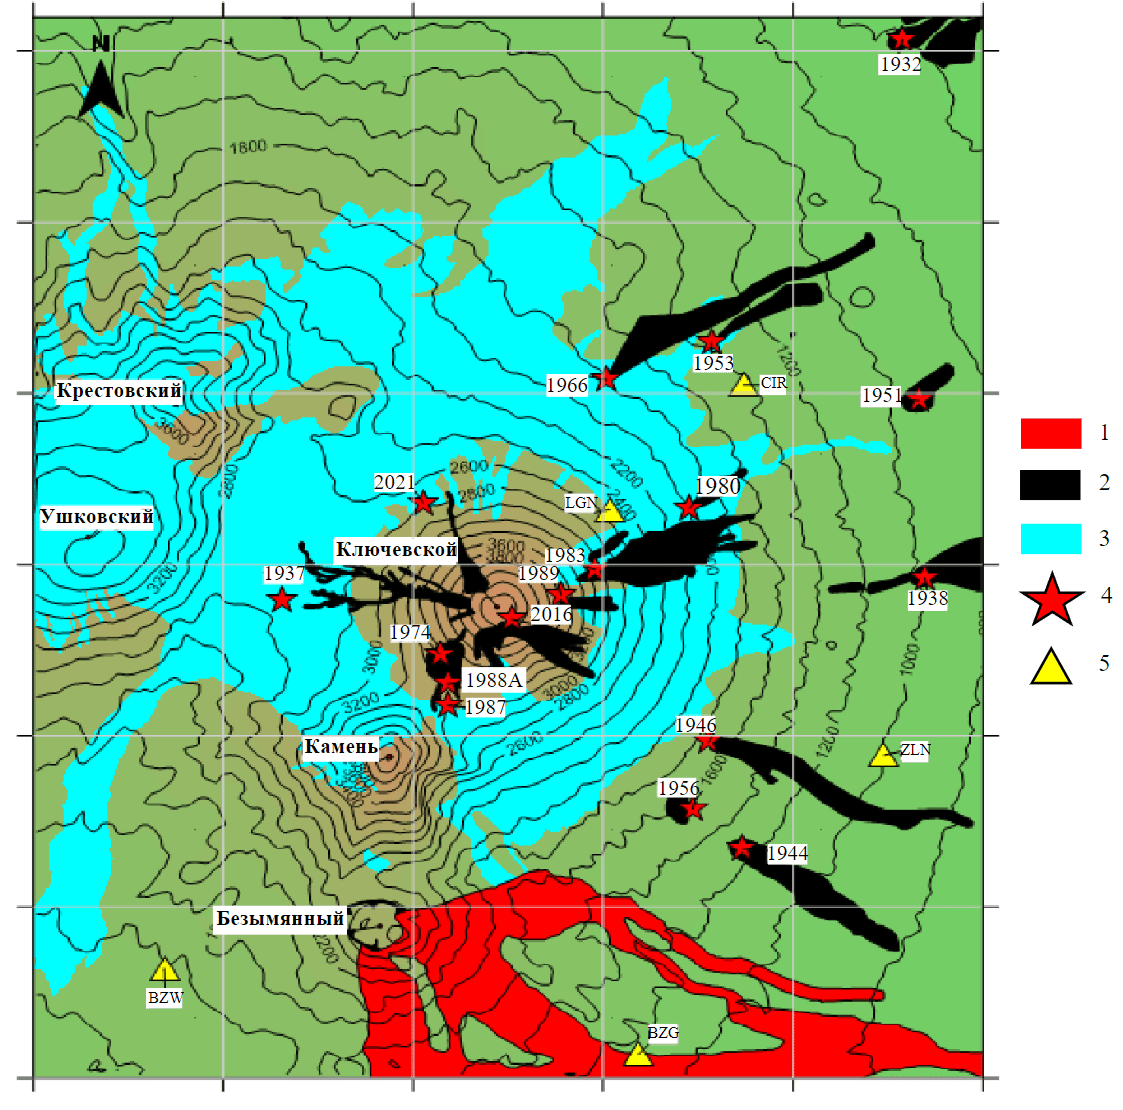
Fig.1. Geological scheme of the Klyuchevskoy Group of Volcanoes ([12, 13]); axis grid is 5 km 1 – deposits of Bezymianny volcano eruption 1956; 2 – Lava flows of the Klyuchevskoy volcano and its flank eruptions (1938-2021); 3 – glaciers; 4 – flank cinder cones with numbers referring to the year of formation; 5 – radio-telemetric seismic stations
The Klyuchevskoy Group of Volcanoes is the object of detailed seismological and volcanological observations since 1935, the results of which are described in the papers of B.I.Piip, A.N.Sirin, A.I.Farberov, M.I.Zubin, I.V.Melekestsev, L.B.Slavina, A.P.Khrenov, N.A.Zharinov, E.I.Gordeev, V.N.Chebrov, A.Yu.Ozerov, Y.V.Demyanchuk, I.Yu.Kulakov, N.M.Shapiro and many others.
Methods
A theory of flow-through magmatic chambers for KGV is presented in [11]. It conceives of multiple magma chambers with dimensions that change depending on temperature of incoming and outgoing magma, age of existence, and intensity of heat exchange with host rocks. Stable existence under active volcanoes of ellipsoidal-shaped homogeneous magma chambers is assumed. This concept is in accord with geophysical models of the magma supply system of the KGV [14], where stable crustal magma chambers are inferred to exist under Klyuchevskoy volcano at depths from 0 to 3 km and from 25 to 33 km (total volume 100 km3).
In recent years, data on the dynamics of feeding/drainage of the magmatic systems of Klyuchevskoy volcano have been investigated using seismic tomography methods [15-17]. Seismic tomography identifying changes in the 3D distribution of the ratio of velocities of longitudinal and transverse waves, Vp/Vs, suggests an increase in Vp/Vs with an increase in melt fraction in magma under volcanoes. The connection of the revealed anomalies with magma is confirmed by the fact that the detected fluid is magma is supported by the fact that during the eruptions of Klyuchevskoy and Bezymianny volcanoes in 2005 there was an increase in Vp/Vs. The results of seismic tomography have been compared with remote sensing and petrologic data to reveal manifestations of pre-eruptive processes [18]. The registration of long-period volcanic earthquakes makes it possible to estimate phase transformations in magmatic chambers that precede volcanic eruptions [19].
Using geochemical methods to study magmatic systems of the Klyuchevskoy volcano gave the following results. The study of melt inclusions in olivine inclusions from basalts revealed the concentration of H2O in he parental magmas of the Klyuchevskoy volcano to be 3.5 wt.%, the range of measured CO2 contents varies from 0.01 to 0.13 wt.% [20]. The eruption products of the Klyuchevskoy volcano vary considerably in their composition (52.0-55.5 wt.% SiO2) and are subdivided into high-magnesian basalts and high alumina andesites. High-magnesian basalts with lower K content and higher Mg content (> 9 wt.% MgO) have petrological characteristics indicating that they may be primary or close to primary mantle magmas. The gas accumulation in the upper part of the magmatic channel leads to the predominance of strombolian eruptions at the summit and high-volume lava outflows at the lower levels [12].
Meteorological/hydrological methods focused on revealing the relationship between volcanic activity and meteoric water inflow conditions may be applicable to the KGV. Glaciers and atmospheric precipitation promotes the meteoric water infiltration into cooling magma chambers, possibly influencing the frequency and volume of volcanic eruptions [21, 22].
The Frac-Digger method [1], [3] has been used in this study to investigate the chronology and 3D geometry of dyke and sill injections in the structure and basement of the Klyuchevskoy volcano between 2003 and 2021. The Frac-Digger method is used to identify and chronologize plane-oriented clusters of microearthquake hypocenters (MEQ), which are interpreted as magma injections in the form of dykes and sills. Additionally, the data on the geochemical history of eruption products were used to trace the levels of the magma injections from the primary magma chambers of the Klyuchevskoy volcano [12].
In this paper, the deep crustal magma reservoir of Klyuchevskoy volcano is designated “K2”, the shallow peripheral magma chamber is designated “K1”. Two-dimensional geomechanical models [23] show that swarms of inclined dykes form in shallow magma chambers, while magma injections from deep magma chambers form subvertical dykes. The dip angle is used to categorize magma injections, so that at dip angles greater than 70° we count dykes, from 20° to 70° we count inclined dykes (D), and less than 20° we count sills (S) [24].
The method of identification of plane-oriented clusters (Frac-Digger and Frac-Digger2)
It is assumed that magma injection in the brittle media beneath active volcanoes is similar to fluid injection into wells in the hydraulic fracturing mode of the host rocks with the generation of microearthquakes (MEQ) along the planes of active shear fractures.
Plane-oriented MEQ clusters identification was carried out using Frac-Digger program. The following is a brief explanation of the algorithm used in this program. The first element of the cluster is removed from the initial list during each iteration. The following criteria are used to include a new element (seismic event) in a cluster: 1 – a time difference δt; 2 – a distance difference in the horizontal plane δR; and 3 – a requirement of a nearly planar orientation (i.e., a distance from the event to the approximation plane δZ. When the resulting cluster contains more than N elements and initial list of elements is exhausted, that cluster is treated as completed and is added to the list of plane-oriented clusters. All elements of a resulting cluster are removed from the initial list of elements (in cases when the cluster size >N). This procedure is then reiterated until the initial list of elements is exhausted.
The calculation of the parameters of a plane-oriented cluster is based on a list of cluster elements. Each element i contains the coordinates (xi, yi, zi). For N (the number of elements in the cluster) points with coordinates (xi, yi, zi), one can find the equation of the fitting plane z = ax + by + c using the least-squares method. The solution thus reduces to solving a set of linear equations as follows:
These equations are then solved using Cramer’s rule. In this way, we obtain the coefficients a, b, c for the equation of a plane, which is defined as z = ax + by + c. The next step is to find the unit vector that is normal to the fitting plane n = (a/Δ, b/Δ, –1/Δ), where Δ is the determinant of the equations that result in the following geological parameters: dip angle β = arccos(1/Δ) ∙ 180/π and the azimuth of dip α = arctan(a/b) ∙ 180/ π. The analysis of the sensitivity of this algorithm, where plane-oriented clusters are selected according to the criteria of temporal and spatial proximity, indicates that the above criteria produce selection results that are both physically and geologically reasonable [1, 3].
The Frac-Digger2 program complements the Frac-Digger program by analyzing almost all possible variants of constructing productive (or seismogenic) faults and horizons over a set of productive zones (earthquake hypocenters). In the program Frac-Digger2, sampling from a set of points in the 3D-spatial domain is done randomly (Monte-Carlo method is used). This makes it possible to avoid dependence of the solution on the ordering of the initial set of points by time, which is extremely important in 3D analysis of the distribution of productive zones and identification of active (productive) faults. The same method and the same parameters (δz and δR) as in Frac- Digger are used to check the plane orientation of K-point cluster and to calculate the parameters of approximating plane. If the check is successful, the unused points of the original set that satisfy the criteria of plane cluster orientation are added to the cluster. Then all remaining points of the original data set checked to see if they can be added to the cluster. The criteria for ending cluster selection are: 1) the maximum number of points included in it; 2) the maximum sum of point attribute parameters (which can be earthquake magnitudes, productive zone rates, and other parameters depending on the problem); and 3) the time defined in the program to perform the plane-oriented point cluster selection procedure. When searching for K elements from a list consisting of N elements, the maximum number of unique CKN generations is limited by the iteration time, so several program runs are performed to confirm the validity of the identified productive (seismogenic) faults.
Input data. The eruptive activity of Klyuchevskoy volcano in 2003-2021
The eruptions of Klyuchevskoy volcano from 2003 to 2021 (Fig.2, Table 1) are described according to information from the Kamchatka Branch Federal Research Center United Geophysical Survey Russia Academy of Sciences (KB FRC UGS RAS) and published papers [25-28]. Thermal remote sensing data were also used for the productivity history of Klyuchevskoy volcano from 2000 to 2020.
Eruptive activity is shown by time intervals 1, 2, during which the eruptions of Klyuchevskoy volcano took place (Fig. 2), recorded by the KB FRC UGS RAS and by remote satellite monitoring of thermal power (https://www.mirovaweb.it/?country_id=4). The eruptive activity graph is given according to the estimates of remote satellite monitoring [29]. The cumulative graph of seismic energy release in the Klyuchevskoy volcano structure to the depth of –3 km was generated from the data of the KB FRC UGS RAS and GS RAS (www.gsras.ru/zr/contents).
Table 1
Klyuchevskoy volcano eruptions in 2003-2021
|
Eruption number |
Start |
End |
Duration, days |
Date of peak activity |
|
1 |
28.10.2002 |
27.02.2004 |
487 |
26.01.2004 |
|
2 |
12.01.2005 |
28.04.2005 |
106 |
13.04.2005 |
|
3 |
15.12.2006 |
27.07.2007 |
224 |
24.06.2007 |
|
4 |
04.06.2008 |
01.02.2009 |
242 |
04.01.2009 |
|
5 |
30.07.2009 |
07.12.2010 |
495 |
04.07.2010 |
|
7 |
15.08.2013 |
19.12.2013 |
126 |
28.10.2013 |
|
8 |
24.12.2014 |
10.05.2015 |
137 |
02.03.2015 |
|
9-10 |
01.04.2016 |
25.08.2017 |
511 |
16.03.2017 |
|
11 |
06.05.2018 |
18.05.2018 |
12 |
18.05.2018 |
|
12 |
02.02.2020 |
17.07.2020 |
166 |
08.06.2020 |
|
13-14 |
17.09.2020 |
16.04.2021 |
211 |
26.09.2020, 08.03.2021 |
Note. Eruptive activity peaks 1-5, 7-10 according to the [29]; 11-14 – according to the data of the KB FRC UGS RAS.
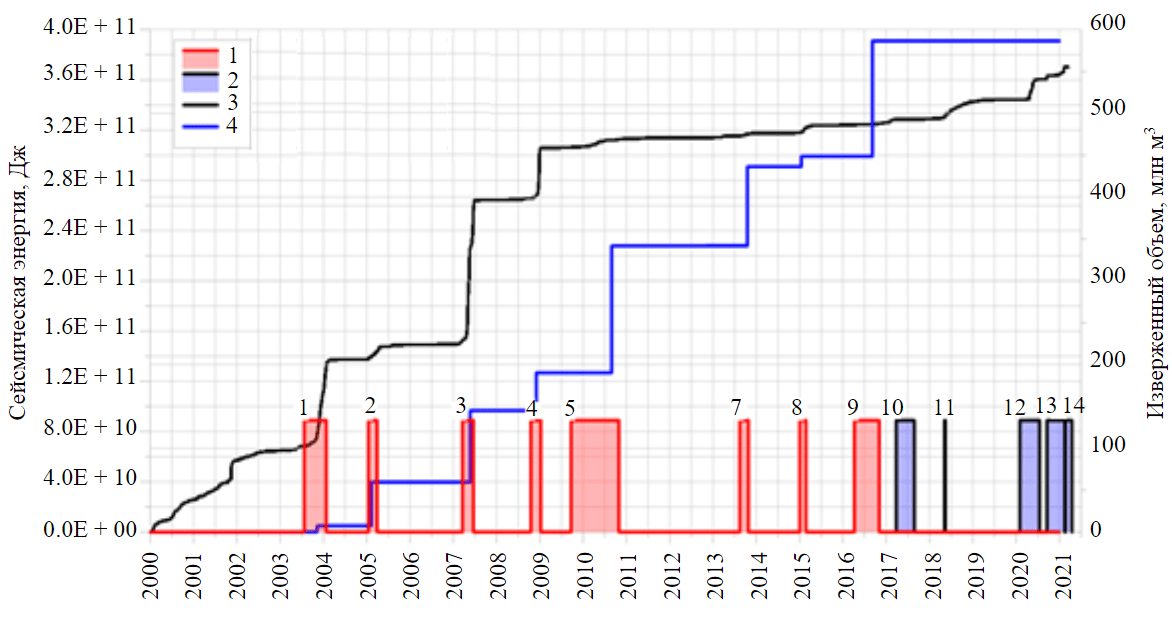
Fig.2. Eruptive and seismic activity of Klyuchevskoy volcano in 2000-2021 1 – eruption intervals according to [29]; 2 – eruption intervals on the data of the KB FRC UGS RAS; 3 – accumulated seismic energy release; 4 – accumulated erupted volumes
Eruption N 1, 28.10.2002 – 27.02.2004; the eruption peak on 26.01.2004 was determined by a combination of thermal imaging and seismic energy release (Fig.2); 21.03.2003 – first weak ash emissions 200 m high; 15.04.2003 – ash emissions 500 m high; 15.05.2003 – first recorded thermal anomaly; 17.05.2003 – the beginning of glow above the crater; in November-December the maximum amplitude of volcanic tremor, maximum ash emissions up to 2.5 km high above the crater and the largest size of the thermal anomaly were recorded; 26.01.2004 – sharp decrease in the amplitude of volcanic tremor and size of the thermal anomaly. No lava flows erupted on the slopes of the volcano during the eruption. Eruption volume 7.3 million m3 [29], seismic energy release 65.2 GJ (Fig.2).
Eruption N 2, 12.01.2005 – 28.04.2005; the eruption peak on 13.04.2005 was determined by a combination of thermal imaging and seismic energy release (Fig.2); 15.01.2005 – appearance of a thermal anomaly; 16.01.2005 – beginning of glow in the crater; 21.01.2005 – first outburst of bombs and ash plumes; 7.02.2005 – beginning of lava flow outpouring on the northwestern slope of the volcano several kilometers long. During two months lava outpouring and ash emissions up to 4 km above the crater were observed; 7.04.2005 the level of shaking sharply dropped; 11.04.2005 single earthquakes from the depth of 30 km began to be registered; 29.04.2005 the level of seismicity turned to normal. Eruption volume 52.3 million m3 [29], seismic energy release 7.8 GJ (Fig.2).
Eruption N 3, 15.12.2006 – 27.07.2007; the eruption peak 24.06.2007 was determined by a combination of thermal imaging and seismic energy release (Fig.2); 15.12.2006 – appearance of thermal anomaly; 15.02.2007 – first weak ash emissions up to 300 m high; 28.03.2007 – beginning of lava flow along the Krestovsky trench; from 15.04.2007 to 26.06. 2007 – maximum amplitudes of volcanic tremor and maximum volcanic events, ash plumes with the length of several thousand kilometers spread in different directions depending on the wind direction at the altitude of 10-12 km above sea level, outpouring of three lava flows with the length of several kilometers on the north-western, north-eastern and south-eastern slopes of the volcano; during July the amplitude of volcanic tremor significantly decreased, and ash emissions and outpouring of lava flows stopped. Estimated erupted volumes 85.4 million m3 [29], seismic energy release 111.0 GJ (Fig.2).
Eruption N 4, 04.06.2008 – 01.02.2009; the eruption peak 04.01.2009 was determined by a combination of thermal imaging and seismic energy release (Fig.2); 13.06.2008 – appearance of thermal anomaly; 08.10.2008 – appearance of glow in the crater; 21.10.2008 – beginning of lava flow outpouring along the north-western slope; 04.12.2008 – first ash emissions; January 2009 – decrease and end of volcanic activity. Estimated erupted volumes 45.2 million m3 [29], seismic energy release 38.2 GJ (Fig.2).
Eruption N 5, 30.07.2009 – 07.12.2010; the eruption peak on 04.07.2010 was determined by the combination of thermal imaging and seismic energy release (Fig.2); 02.08.2009 – appearance of activity in the form of hot magma bursts in the crater; further until the end of 2009 volcanic activity was recorded in the crater of the Klyuchevskoy volcano in the form of magma bursts and weak ash emissions up to 300 m high; in 2010 – continuation of the summit eruption, followed by powerful ash emissions up to 9 km above sea level and the outpouring of lava flows several kilometers long; at the end of 2010 the eruption gradually stopped. Estimated erupted volumes 151.5 million m3 [29], seismic energy release was 4.3 GJ (Fig.2).
Eruption N 7, 15.08.2013 – 19.12.2013; the eruption peak on 28.10.2013 was determined by a combination of thermal imaging and seismic energy release (Fig.2). From 15.10.2013 to 19.10.2013 – increase in continuous volcanic tremor up to 246 μm/s; 19.10.2013 – powerful pyroclastic flow in the north-western direction (along the Krestovsky trough); according to satellite data thermal anomalies and ash plumes; 20.10.2013 – decrease of volcanic and seismic activity; 07.11.2013 – new increase of volcanic and seismic activity, vapor-gas activity and ash plumes according to satellite data. Estimated erupted volumes 94.6 million m3 [29], seismic energy release 1.5 GJ (Fig.2).
Eruption N 8, 24.12.2014 – 10.05.2015; eruption peak 02.03.2015 was determined by a combination of thermal imaging and seismic energy release (Fig.2); 25.01.2015 – continuous volcanic tremor up to 5,36 μm/s; ash emissions up to 8000 m above sea level; plume to the east, north-east; glow above the crater at night; according to satellite data thermal anomalies and ash emissions; 27.01.2015 – continuous volcanic tremor up to 3.61 μm/s. Ash fallout was observed in Klyuchi village; according to satellite data, ash cloud with the size of 54 km ´ 6 km in 145 km to the north-east of the volcano at an altitude of 5800 m above sea level; 14.02.2015 – continuous volcanic tremor up to 4.18 μm/s; ash emissions up to 7000 m above sea level; plume to the north-east. Estimated erupted volumes 12.3 million m3 [29], seismic energy release 4.1 GJ (Fig.2).
Eruptions N 9-10, 01.04.2016 – 25.08.2017; eruption peak 16.03.2017 was determined by a combination of thermal imaging and seismic energy release (Fig.2); 07.07.2016 – continuous volcanic tremor up to 4.48 μm/s; ash emission to 10000 m above sea level; 03.09.2016 – continuous volcanic tremor up to 4.69 μm/s; ash emission up to 5300 m above sea level; plume to the south. 06.09.2016 – continuous volcanic tremor up to 5.45 μm/s; glow over the crater and lava flows is observed at night; 08.09.2016 – continuous volcanic tremor up to 6.07 μm/s; 10.08.2017 – ash emissions 5500-7000 m above sea level; plume to the south-west 50 km long. Estimated erupted volumes 137.8 million m3 [29], seismic energy release 2.9 GJ (Fig.2).
Eruption N 11, 06.05.2018 – 18.05.2018; the eruption peak on 18.05.2018 was determined by seismic energy release (Fig.2); 14.05.2018 – number of seismic events in the volcano structure is 192; continuous spasmatic volcanic tremor up to 0,08 μm/s; glow above the crater, height of vapor-gas activity (VGA) is 1500 m; ash ejection to the altitude of 10000 m above sea level; ash plume of 100 km length to the north-east at the altitude of 7500 m above sea level. The seismic energy release during five months after the eruption started was 12 GJ (Fig.2).
Eruption N 12, 02.02.2020 – 17.07.2020; eruption peak 08.06.2020 determined by seismic energy release (Fig. 2); 09.04.2020 continuous spasmatic volcanic tremor up to 23.86 µm/s; vapor-gas emissions with ash content up to 7000 m above sea level; intense glow in the crater at night; ash plume extending 50 km to the south-south-east at an altitude of 7000 m above sea level. The seismic energy release during the last two months of the eruption was 16 GJ (Fig.2).
Eruption N 13, 27.09.2020 – 14.02.2021; eruption peak 27.09.2020 was determined by seismic energy release (Fig.2); 02.12.2020 – continuous spasmatic volcanic tremor up to 22.28 μm/s; ash emission up to 7000 m above sea level; 07.12.2020 – continuous spasmatic volcanic tremor up to 53.54 μm/s; 24.01.2021 – continuous spasmatic volcanic tremor up to 2.78 μm/s; in the dark time of the day a glow above the crater and lava flow glow on the south-eastern slope of the volcano were observed. The steam-gas plume with ash content spread 94 km to the northeast of the volcano at an altitude of 8000 m; 05.02.2021 – continuous spasmatic volcanic tremor up to 33.31 μm/s. The seismic energy release at the beginning of the eruption was 16 GJ (Fig.2).
Eruption N 14, 20.02.2021 – 16.04.2021; the eruption peak 08.03.2021 was determined by seismic energy release (Fig.2). In late February 2021 and early March 2021, weak continuous spasmatic volcanic tremor up to 1.46 µm/s was recorded. At night, a glow on the northwestern slope of the volcano from a flank eruption and a glow above the lava flows were observed. The seismic energy release in January 2021 was 7 GJ (Fig. 2).
Use of the Frac-Digger method for estimation of magmatic activity of the Klyuchevskoy volcano preceding its 2003-2021 eruptions
The calculated geometrical characteristics and time sequences of magmatic injections preceding eleven eruptions of Klyuchevskoy volcano (see Table 1, Fig.2) were obtained using the Frac-Digger program [1, 3] based on seismological data of the KB FRC UGS RAS for the period 01.01.2000 – 16.03.2021. A total of 94598 events were registered using the local network of telemetric stations. The 1D nine-layer model [30] was used by KB FRC UGS RAS to determine the microearthquake hypocenters (MEQ). By 2000, nine telemetric stations were operating, then additional ones were deployed in 2003 (1), 2005 (3), 2006 (2), 2007 (2), 2009 (1) and 2011 (1). Thus 19 telemetric stations have been online since 2011. The average 3σ accuracy of MEQ positioning is estimated to be 3,1 km from 2010 to 2020. The Frac-Digger program used the following criteria for selecting plane-oriented clusters of MEQ hypocenters: δZ = 1 km (σ is the standard deviation from the plane); δR = 12 km; δt = 30 days; N = 6. The total number of magma injections detected during 2000-2021 was 1523, which includes 92842 plane-oriented MEQ hypocenters (98.1 % of the total).
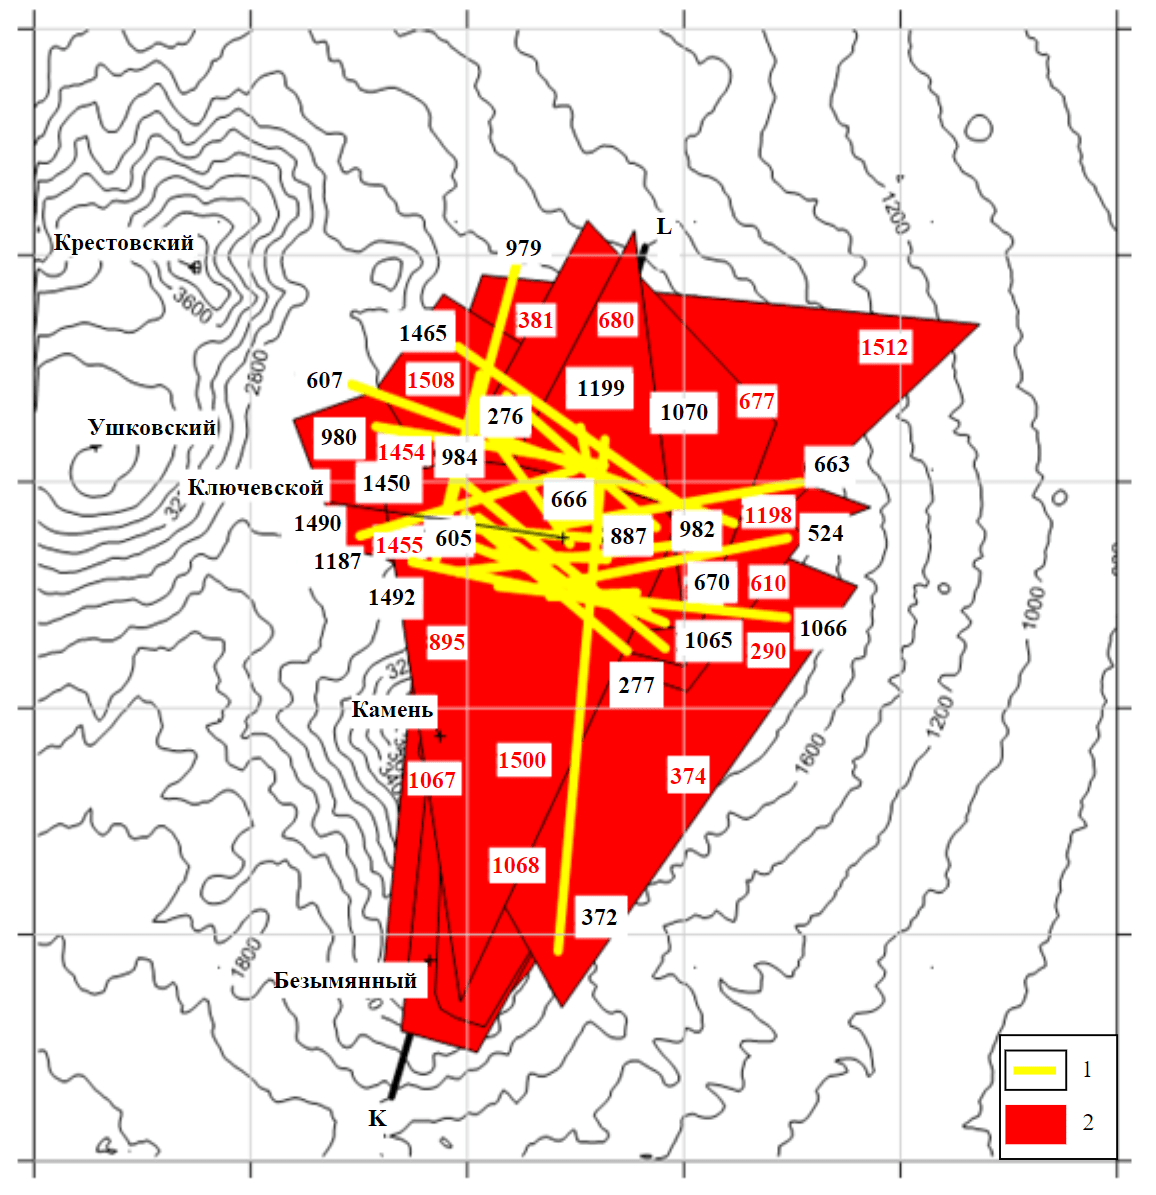
Fig.3. Magmatic activity preceding the eruptions of Klyuchevskoy volcano in 2003-2021. Numbers of dykes (black) and sills (red) correspond to Table 2; axis grid is 5 km 1 – traces of feeding dykes at +1000 m; 2 – projections of shallow sills
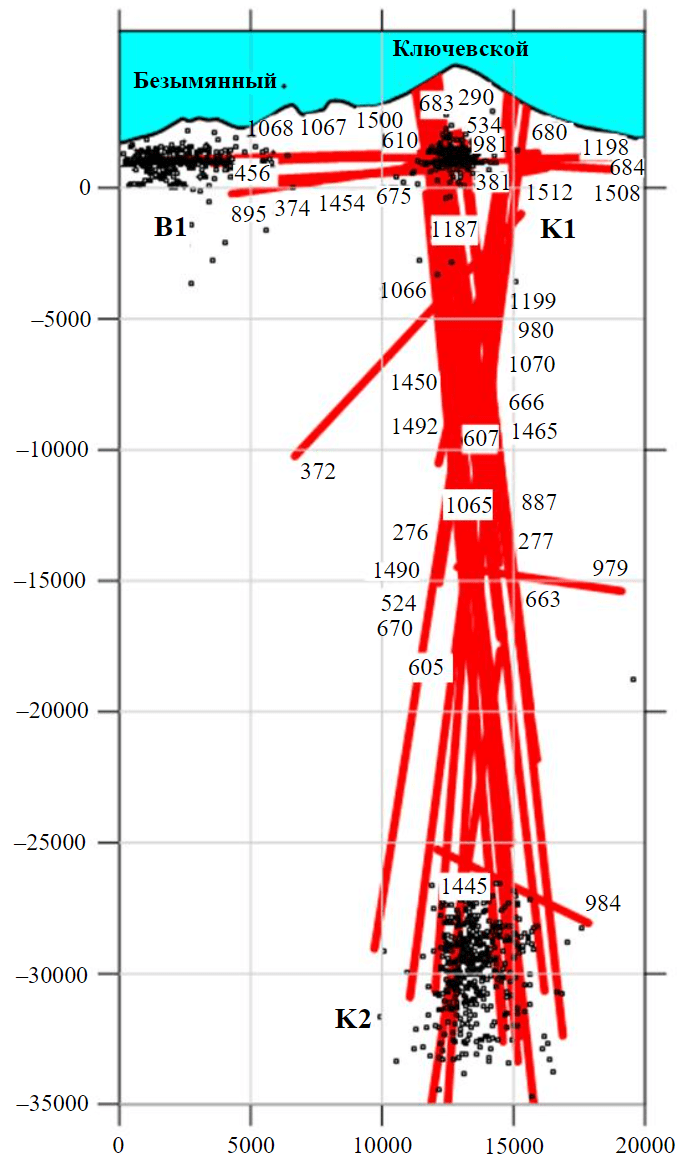
Fig.4. Magmatic activity preceding seventeen eruptions of Klyuchevskoy volcano during time period from 2003 to 2021 (Table 2): dykes and sills traces in a vertical cross-section KL (see Fig.3).Circles denote hypocenters of MEQ located within 1000 m from the plane of KL cross-section, the size of circle is proportional to MEQ magnitude
The term “preceding” refers to the time interval from a few months (one to four months, in one case up to nine months) to the peak of an eruption. In this paper, dykes and sills with N2 ≥ 100 plane-oriented MEQs are highlighted with bold letters D and S, respectively.
Fig.3 and 4 show the magmatic activity preceding individual eruptions of Klyuchevskoy volcano in 2003-2021; Table 2 presents the main dykes and sills preceding 11 eruptions of Klyuchevskoy volcano in 2003-2021. All 11 considered eruptions of the volcano were preceded by magma injections in the form of high-angle dykes from the deep crustal magmatic chamber K2 into the shallow peripheral magmatic chamber K1, further magmatic activity included injections of dykes (with different dip angles, but with the predominant dip azimuth to the NW, N, and NE) from the peripheral magmatic chamber K1 and, immediately before the eruption, sills from the magmatic chamber K1 (Fig.5). The predominance of the sublatitudinal and NWW strike of the feeding subvertical dykes from the deep crustal magmatic chamber K2, which preceded the individual eruptions, is noted too (Fig.5). Injection of sills (average dip angle 13°) occurred in the range of absolute elevations from 250 to 2300 m (mean value 1200 m).
In many cases, the eruptions of Klyuchevskoy volcano were time synchronized with the eruptions of Bezymianny volcano (1 and 1G, 2 and 3 (S374), 3 and 5-6, 4 and 8-9, 5 and 8-9 (D681), 10 and 13, 11 and 15, 13-14 and 17, respectively). The authors of [29] also concluded that the eruptions of the Klyuchevskoy and Bezymianny volcanoes were synchronized based on the remote satellite thermal imaging data.
Table 2
Magma injections (parameters and mechanisms) preceding the 2003-2021 Klyuchevskoy eruptions (as identified by the Frac-Digger scenario with parameters: δZ = 1 km, δR = 12 km, δt = 30 days, N = 6)
|
Eruption number |
Dyke/Sill number |
Dip, degrees
|
Dip azimuth, degrees |
Z, m |
Date of injection |
ML |
N2 |
Injection mechanism |
|
1 |
276 |
86.8 |
220.1 |
–16222 |
18.09.03 |
2.2 |
44 |
K2→K1 dyke |
|
1 |
277 |
84.3 |
38.8 |
–14864 |
02.10.03 |
2.6 |
80 |
K2→K1 dyke |
|
1 |
279 |
29.9 |
110.2 |
1544 |
01.11.03 |
2.6 |
247 |
K1 dyke |
|
1 |
280 |
26.2 |
60.2 |
2369 |
04.11.03 |
2.6 |
154 |
K1 dyke |
|
1 |
281 |
50.1 |
91.1 |
1170 |
15.11.03 |
2.75 |
162 |
K1 dyke |
|
1 |
283 |
47.8 |
52.3 |
1371 |
01.12.03 |
2.4 |
561 |
K1 dyke |
|
1 |
284 |
51.9 |
53.1 |
1052 |
07.12.03 |
2.35 |
292 |
K1 dyke |
|
1 |
285 |
72.6 |
72.6 |
598 |
15.12.03 |
2.5 |
246 |
K1 dyke |
|
1 |
286 |
77 |
31.9 |
250 |
22.12.03 |
2.45 |
140 |
K1 dyke |
|
1 |
288 |
25.2 |
60.6 |
777 |
06.01.04 |
2.5 |
497 |
K1 sill |
|
1 |
289 |
53.3 |
34.7 |
821 |
14.01.04 |
2.35 |
541 |
K1 dyke |
|
2 |
372 |
79.2 |
275.4 |
–4857 |
06.01.05 |
2.25 |
37 |
K2→K1 dyke |
|
2 |
374 |
5 |
149.1 |
775 |
09.01.05 |
2.45 |
37 |
K1 sill |
|
2 |
381 |
11.4 |
218.2 |
254 |
12.04.05 |
1.75 |
123 |
K1 sill |
|
3 |
524 |
84.8 |
349.2 |
–5918 |
02.03.07 |
2.2 |
72 |
K2→K1 dyke |
|
3 |
527 |
76.3 |
209.4 |
394 |
17.03.07 |
2 |
133 |
K1 dyke |
|
3 |
528 |
64 |
359.8 |
935 |
22.03.07 |
2.15 |
136 |
K1 dyke |
|
3 |
529 |
72.7 |
62.8 |
1027 |
25.03.07 |
2.4 |
185 |
K1 dyke |
|
3 |
530 |
81.9 |
175.5 |
–1237 |
06.04.07 |
2.75 |
95 |
K1 dyke |
|
3 |
531 |
71.8 |
277.6 |
524 |
10.04.07 |
2.8 |
66 |
K1 dyke |
|
3 |
532 |
33.3 |
60.4 |
1245 |
24.04.07 |
2.95 |
318 |
K1 dyke |
|
3 |
533 |
65.6 |
34.5 |
115 |
28.04.07 |
2.95 |
50 |
K1 dyke |
|
3 |
534 |
26.2 |
54.6 |
1814 |
23.05.07 |
2.95 |
242 |
K1 sill/dyke |
|
4 |
605 |
85.3 |
26.4 |
–17392 |
07.10.08 |
2.2 |
41 |
K2→K1 dyke |
|
4 |
607 |
85.4 |
199.2 |
–13147 |
21.10.08 |
2.35 |
31 |
K2→K1 dyke |
|
4 |
609 |
57.5 |
355.1 |
133 |
17.11.08 |
3.25 |
50 |
K1 dyke |
|
4 |
610 |
21.4 |
136.7 |
858 |
12.12.08 |
2.85 |
181 |
K1 sill/dyke |
|
4 |
611 |
43.8 |
355.1 |
–669 |
15.12.08 |
2.75 |
123 |
K1 dyke |
|
5 |
663 |
84.4 |
350.3 |
–10119 |
03.10.09 |
2.5 |
64 |
K2→K1 dyke |
|
5 |
666 |
84.3 |
52.9 |
–6494 |
04.11.09 |
2.85 |
23 |
K2→K1 dyke |
|
5 |
670 |
85 |
357.7 |
–12493 |
09.12.09 |
1.8 |
20 |
K2→K1 dyke |
|
5 |
675 |
6.2 |
210.9 |
1170 |
25.01.10 |
1.9 |
30 |
K1 sill |
|
5 |
676 |
55.1 |
91.8 |
964 |
13.02.10 |
2.15 |
54 |
K1 dyke |
|
5 |
677 |
0 |
356.9 |
1318 |
26.02.10 |
2.2 |
39 |
K1 sill |
|
5 |
678 |
46.9 |
20.4 |
987 |
28.03.10 |
2.25 |
98 |
K1 dyke |
|
5 |
679 |
29.3 |
165.4 |
1074 |
12.04.10 |
2.5 |
138 |
K1 dyke |
|
5 |
680 |
5.6 |
275.1 |
1125 |
25.04.10 |
1.95 |
19 |
K1 sill |
|
7 |
887 |
83.6 |
3.1 |
–19560 |
18.07.13 |
2.15 |
54 |
K2→K1 dyke |
|
7 |
895 |
11 |
156.6 |
1203 |
22.10.13 |
2 |
94 |
K1 sill |
|
8 |
979 |
80.5 |
105.9 |
–1530 |
11.01.15 |
2.25 |
96 |
K2→K1 dyke |
|
8 |
980 |
81.1 |
189.1 |
–748 |
16.01.15 |
2.1 |
107 |
K2→K1 dyke |
|
8 |
981 |
9 |
94.1 |
1247 |
28.01.15 |
2.15 |
226 |
K1 sill |
|
8 |
984 |
84.3 |
104.5 |
–13408 |
15.02.15 |
2 |
110 |
K2→K1 dyke |
|
9-10 |
1065 |
84.8 |
20.9 |
–2805 |
02.01.17 |
1.95 |
219 |
K2→K1 dyke |
|
9-10 |
1066 |
81.1 |
5.9 |
–936 |
06.01.17 |
1.9 |
137 |
K2→K1 dyke |
|
9-10 |
1067 |
2.2 |
124.3 |
1154 |
21.01.17 |
1.8 |
428 |
K1 sill |
|
9-10 |
1068 |
8.7 |
117.7 |
1243 |
29.01.17 |
1.85 |
211 |
K1 sill |
|
9-10 |
1070 |
82.1 |
38.2 |
–323 |
05.02.17 |
1.8 |
106 |
K2→K1 dyke |
|
11* |
1187 |
83.1 |
353.3 |
–3140 |
13.04.18 |
2.55 |
480 |
K2→K1 dyke |
|
11 |
1198 |
6.1 |
183.5 |
1022 |
11.05.18 |
2.15 |
90 |
K1 sill |
|
11 |
1199 |
83.2 |
258.3 |
–21643 |
12.05.18 |
2.2 |
226 |
K2→K1 dyke |
|
12 |
1445 |
81.6 |
209.4 |
–25707 |
17.01.20 |
2.25 |
41 |
K2→K1 dyke |
|
12 |
1450 |
83.1 |
35.3 |
–5616 |
18.02.20 |
2.3 |
42 |
K2→K1 dyke |
|
12 |
1454 |
8.9 |
69.4 |
1225 |
02.04.20 |
2.4 |
87 |
K1 sill |
|
12 |
1455 |
3.4 |
85.1 |
1132 |
22.04.20 |
2.5 |
372 |
K1 sill |
|
12 |
1457 |
50.3 |
12.8 |
750 |
04.05.20 |
2.2 |
133 |
K1 dyke |
|
13-14 |
1490 |
82.4 |
163.7 |
–8267 |
22.08.20 |
3.3 |
125 |
K2→K1 dyke |
|
13-14 |
1492 |
83.1 |
11.5 |
–1898 |
25.08.20 |
2.35 |
208 |
K2→K1 dyke |
|
13-14 |
1500 |
5.7 |
136.6 |
1243 |
16.09.20 |
2.2 |
113 |
K1 sill |
|
13-14 |
1508 |
5 |
29.9 |
1234 |
16.12.20 |
2.3 |
108 |
K1 sill |
|
13-14 |
1512 |
10.1 |
89.3 |
1071 |
21.01.21 |
2.9 |
272 |
K1 sill |
|
13-14 |
1520 |
31.9 |
33.4 |
832 |
12.02.21 |
1.6 |
13 |
K1 dyke |
Note. The magma injection mechanism determines: the parent magma chamber (K2 or K1), from which the dyke (sill) was injected; Z – mean value of hypocenter mark from the hypocenter cluster; ML – maximum magnitude in the hypocenter cluster; N2 – number of earthquake hypocenters synchronized with dyke (sill) formation.
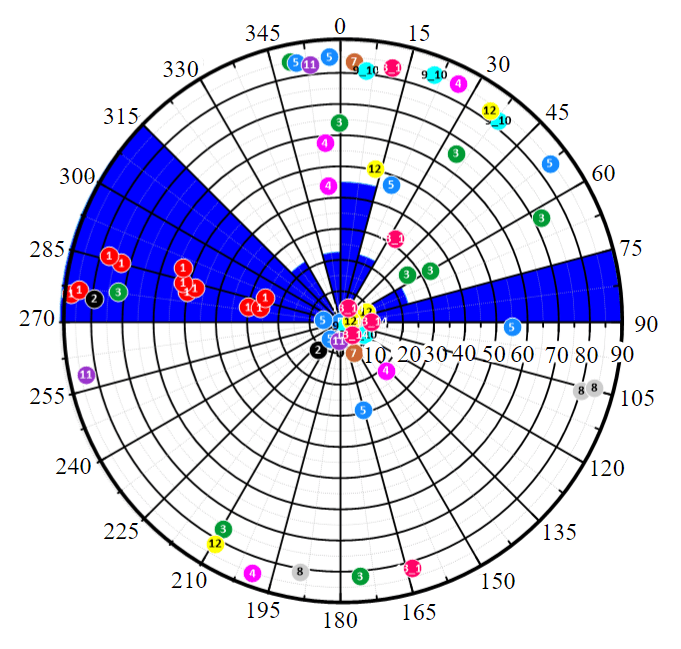
Fig.5. Stereogram of dykes and sills (dip angle, dip azimuth) preceding the eruptions of the Klyuchevskoy volcano (Table 2). The rose-diagram shows the strike azimuth of the feeding dykes (K2→K1, Table 2)
Results and Discussion. Geomechanical and geochemical interpretation of magmatic activity and subsequent eruptions of the Klyuchevskoy volcano
Mechanism of eruptions
According to the results of the Frac-Digger analysis, the common scenario of magmatic activity preceding the eruptions of Klyuchevskoy volcano in 2003-2021 can be represented as three stages (the termino-logy of the [31] is used to describe the geomechanical state):
- Magma injections from the deep crustal magmatic chamber K2, located in the depth range from –33 to –27 km, into the shallow peripheral magmatic chamber K1, located in the depth range from –1,5 to 2 km. This process occurs under geomechanical conditions of horizontal extension with the predominant N-NNE direction (SHmax is oriented along the azimuth from –20 to 40°) (Fig.5). The channel through which magma is transported from the lower crustal magmatic chamber K1 (–30 km) to the upper peripheral magmatic chamber K2 (0 km) is the intersection of subvertical dyke faults formed as a result of hydraulic fracturing of the host rocks. The cross-sectional area of the channel at a depth of –15 km is estimated at 13.7 km2. The analysis of the hydrothermal circulation conditions in the filtration structure created by dykes and sills is discussed in detail in the paper [3].
- Dyke injections from the peripheral magmatic chamber K1 occur over a period of several months, which crack the volcanic structure until local geomechanical conditions of horizontal extension (normal faults, NF) are replaced by local geomechanical conditions of horizontal compression (reverse-faults, RF) and the sills begin to form at elevations ranging from 250 to 2300 m.
- Sills formation at a relatively shallow depth leads to the formation of high-pressure vapor-gas reservoirs in the cone of the Klyuchevskoy volcano; when the gas phase pressure increases above the weight of overlying rocks, a hydrothermal explosion occurs, clearing the volcano conduit and initiating the ash-vapor-gas eruption mode. After vapor-gas venting of the volcano channel, fountaining and lava outpourings to the surface are possible.
The cyclic geomechanical regime is shown graphically by the dynamics of change in the dip angles of magmatic injections (dykes and sills) in Fig.6. No significant geochemical changes were observed in the products of the Klyuchevskoy volcano eruptions in 2000-2021, except for the flank eruption in 2021, characterized by high contents of incoherent elements and strontium isotopes, indicating intensive magmatic processes in the volcano structure [32].
The proposed scenario of magmatic activity of the Klyuchevskoy volcano can be completed with the results of two-dimensional geomechanical modeling of the stress field distribution around a system of two liquid pressure sources in an elastic media corresponding to a “duplet” of two magmatic chambers: a deep crustal magmatic chamber of flat shape at the upper mantle-crustal boundary and a shallow magmatic chamber of spherical shape [13, 33, 34]. The formation of inclined dykes in the upper part of this model is explained both by the spherical geometry of the upper chamber and by the influence of the inclined layers of the host rock massive on the stress field, resulting in the deviation of dykes from the vertical in the direction of the dip azimuth of the host rock layers. This model can explain the dominance of the dyke dip deviation in the NE sector (Fig.5) by the general trend of the dip of the host rock massive in the basement of the Klyuchevskoy volcano in the NE direction. In addition, this model shows the possibility of injection of a large number of “arrested” dykes that do not reach the surface, which is also consistent with the statistics obtained by the authors for Klyuchevskoy volcano: only 62 out of 1510 magma injections detected from seismic data (see Table 2) preceded the eruptions of Klyuchevskoy volcano (4 %).
Cavities filling along the structural surface of the Klyuchevskoy volcano basement by magma (the Cook-Gordon mechanism for opening a weak contact at a shallow depth in the Earth's crust) may be an alternative mechanism for sill formation [33, 35]. The structural surface of the Klyuchevskoy volcano basement on geologic sections is located at elevations from 0.5 to 1.5 km [13].
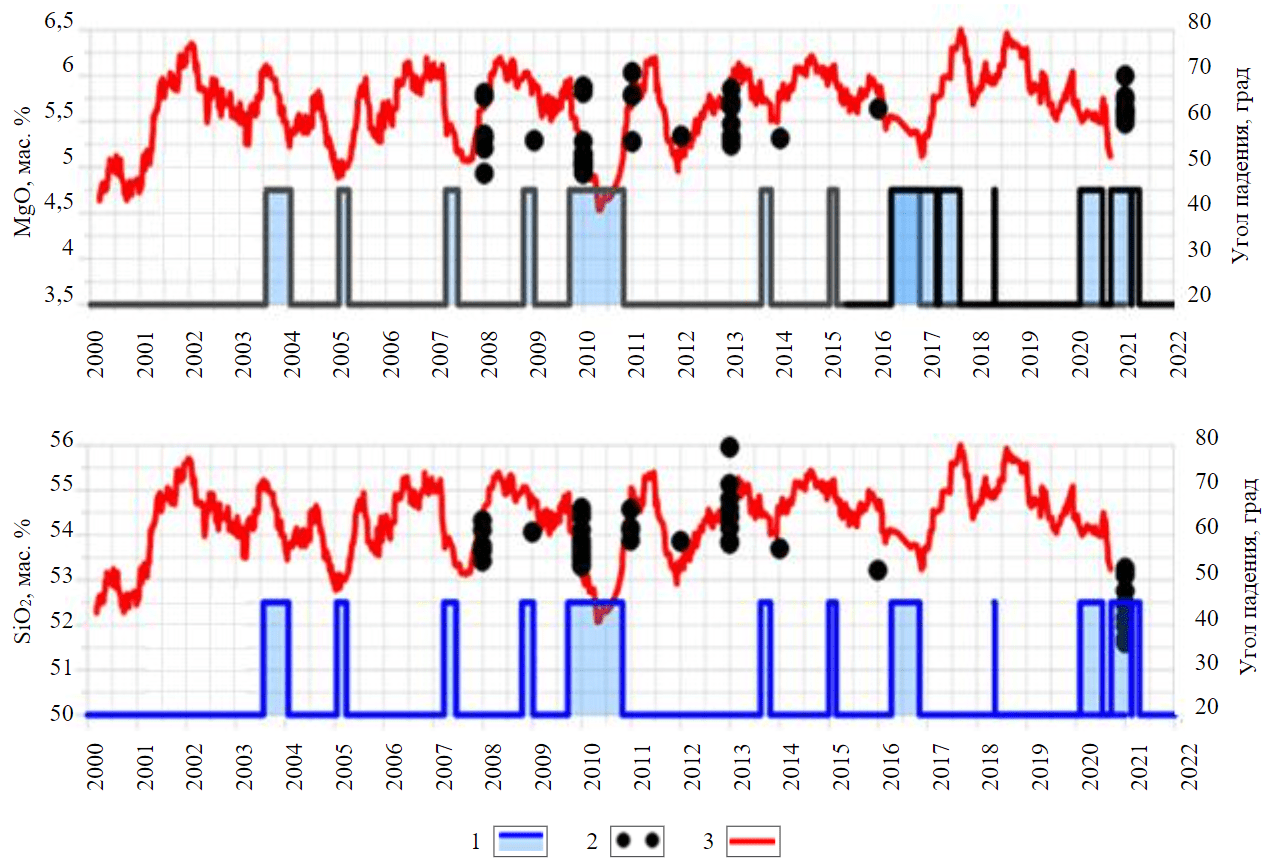
Fig.6. Geochemical and geomechanical evolution of Klyuchevskoy volcano in 2000-2021. Magma compositions are taken from the [12] 1 – activity of the Klyuchevskoy volcano (see Fig.2); 2 – mass fractions of SiO2 and MgO; 3 – the indicator of geomechanical state – dip angle of magmatic injections (moving average – 21)
Flank eruptions of Klyuchevskoy volcano
Frac-Digger2 analysis of the distribution of lava sources from 16 flank eruptions of Klyuchevskoy volcano during the period 1932-2021 (Table 3) shows that they are grouped on two subhorizontal planes with center marks at 1567 and 3374 m (Table 4). These planes correspond to the direction of hydraulic fracturing under the conditions of horizontal compression, which belongs to the third stage of the Klyuchevskoy volcano eruption mechanism. In addition, the lower plane coincides with the structural surface of the roof of the Klyuchevskoy volcano basement [13], which allows us to assume the formation of most of the side ruptures as a result of magma outpouring from the magmatic system located hypsometrically higher, most likely at a high magma level in the volcano channel (the maximumlevel coincides with the elevation of the volcano crater at about 4850 m asl.).
Table 3
Flank eruptions of the Klyuchevskoy volcano (volumes and absolute elevations of eruptions according to [13, 14])
|
Flank eruption |
Year |
Year* |
Elevation, m asl. |
Volume, km3 |
Duration |
Coordinates**, m |
||
|
X |
Y |
Z |
||||||
|
Tuila |
1932 |
1932 |
700-780 |
0.090 |
~1 year |
612850 |
6230845 |
570 |
|
Perevalny |
1937-1938 |
1937 |
2500 |
0.000 |
596586 |
6214061 |
2690 |
|
|
Bilyukai |
1938-1939 |
1938 |
900-1890 |
0.240 |
13 months |
613689 |
6214621 |
1030 |
|
Yubileyny |
1944-1945 |
1944 |
1100-1350 |
0.060 |
19 days |
609613 |
6207168 |
1185 |
|
Apakhonchich |
1946 |
1946 |
1620 |
0.040 |
29 days |
609613 |
6208607 |
1290 |
|
Bylinkin |
1951 |
1951 |
950 |
0.010 |
10 days |
612411 |
6219996 |
1000 |
|
Belyankin |
1953 |
1953 |
1300-1400 |
0.010 |
11 days |
607395 |
6221295 |
1430 |
|
Vernadsky |
1956 |
1956 |
1400-1450 |
0.080 |
5 days |
608175 |
6207528 |
1430 |
|
Piip |
1966-1967 |
1966 |
2100 |
0.080 |
3 months |
603639 |
6219656 |
2080 |
|
IV VVS |
1974 |
1974 |
3400-3600 |
0.025 |
3 months |
600662 |
6212343 |
3570 |
|
March 8, 1980 |
1980 |
1980 |
1800 |
0.000 |
7 days |
607915 |
6217378 |
1790 |
|
Predskazanny |
1983 |
1983 |
2875 |
0.050 |
~4 months |
605157 |
6214901 |
2900 |
|
Predvidenny |
1987 |
1987 |
2400-3800 |
0.0002 |
10 days |
600921 |
6210884 |
3230 |
|
XXV IV |
1988 |
1988 |
4000 |
0.034 |
6 days |
600862 |
6211504 |
3410 |
|
Skuridinin |
1989-1990 |
1989 |
4100 |
0.033 |
6 months |
603902 |
6214123 |
3770 |
|
Markhinin |
2016 |
2016 |
4600 |
0.015 |
189 days |
|
|
|
|
Gorshkov |
2021 |
2021 |
2850 |
1 month |
600254 |
6216828 |
2750 |
|
* Number on the map (see Fig.1).
** Coordinates of the centers of flank eruptions for calculating the orientation of the fitting planes in the Frac-Digger2 program (X, Y are set in the UTM WGS84 N57 coordinate system).
The changes in the eruption volumes and geochemical history of the products of flank eruptions of the Klyuchevskoy volcano can be partially explained by the changes in the drainage level of the magmatic system, determined along the line of intersection of the main sills (Table 4) with the topographic surface: at the lower levels corresponding to the breakthroughs of 1932, 1937-1939, more high-magnesian magmas up to 9,5 % MgO with increased density up to 2920 kg/m3 were discharged as a result of density differentiation, and more voluminous magma outpourings occurred. The formation of the main sills of flank eruptions can be carried out by the hydraulic fracturing mechanism under RF geomechanical conditions or by the weak contact opening mechanism (Cook – Gordon detaching mechanism [33]).
Table 4
Results of planes calculation including the sources of the Klyuchevskoy volcano flank eruptions using the Frac-Digger2 program. Frac-Digger2 parameters: δZ = 0.25 km (σ – standard deviation from the plane), δR = 12 km, N = 5
|
Eruption number |
Dip, degrees |
Dip azimuth, degrees |
X |
Y |
Z |
N2 |
Flank eruption years |
|
1 |
7.0 |
87.1 |
607467 |
6216180 |
1567 |
11 |
1932, 1938, 1937, 1944, 1946, 1951, 1953, 1956, 1966, 1980, 2021 |
|
2 |
19.2 |
135.9 |
602301 |
6212751 |
3374 |
5 |
1974, 1983, 1987, 1988, 1989 |
Conclusions
The eruptions of Klyuchevskoy volcano in 2003-2021 are described by a three-stage mechanism: stage N 1 – magma injection through the systems of subvertical dykes from the lower crustal magmatic chamber K2 (–30 km) to the upper peripheral magmatic chamber K1 (+1 km) (Fig.7, a); stage N 2 – magma accumulation in the sill system of peripheral magmatic chamber K1, magma degassing and heating of meteoric water with formation of high-pressure steam-gas geothermal reservoirs, steam-gas emission from the volcano crater (Fig.7, b); stage N 3 – vapor-gas venting of the volcano conduit in the depth range above +1 km, the beginning of the ash-gas phase of the eruption, transitioning in some cases to magma outpouring to the surface.
The magma system feeding structure in the depth range from K2 (–30 km) to K1 (+1 km) includes subvertical dykes of different dip azimuths, but with predominance of two strikes (sublatitudinal 270°, azimuth to Ushkovsky volcano) and (WNW 300°, azimuth to Krestovsky volcano). The cross-sectional area of the magmatic channel, being of the nature of hydraulic fractures, is about 14 km2. Each of the 11 reviewed eruptions of Klyuchevskoy volcano in 2003-2021 had individual main supply dykes (from 1 to 3, 22 in total) of close strike, indicating geomechanical conditions of radial horizontal extension or horizontal extension in the northern or NNE direction. Moments of sill generation (horizontal hydraulic fracturing) in the peripheral magmatic chamber zone (elevations from 0.25 to 2.3 km) indicate a change in geomechanical conditions toward horizontal compression. The subsequent formation of a vapor-gas reservoir due to magma degassing and heat exchange with meteoric water leads to an increase in the pressure of the gas phase, venting of the volcano conduit above the sill top, and the beginning of the volcanic eruption resulting in the release of effective stresses. The cyclic nature of volcanic eruptions is caused by nonlinear thermohydrodynamic-geomechanical interaction “magma – host rocks”.
The flank eruptions of 1932-2021 originated from the system of main long-lived sills (Fig.7, c): Sill-1 centered at +1600 m below the NE slope of the volcano (dip angle 7° to the east) coincides with the structural surface of the Klyuchevskoy volcano basement roof; it provided lava outpourings during the eruptions of 1932 (Tuila), 1937-1938 (Perevalny), 1938 (Bilyukai), 1944-1945 (Yubileyny), 1946 (Apokhonchich), 1951 (Bylinkin), 1953 (Belyankin), 1956 (Vernadsky), 1966-1967 (Piip), 1980 (March 8), 2021 (Gorshkov); Sill-2 centered at +3400 m below the summit of Klyuchevskoy volcano (dip angle 19° to the SE) provided lava outpourings in 1974 (IV VVS), 1983 (Predskazanny), 1987 (Predvidenny), 1988 (XXV IV), 1989-1990 (Skuridin).
The aim of the further research is, in particular, to identify analogs of gold-silver and polymetallic vein ore deposits, hydrocarbon reservoirs of complex geological structure for the magmatic system of the Klyuchevskoy volcano. Our proposed three-dimensional Frac-Digger2 method significantly expands the capabilities of two-dimensional lineament techniques [36] and can be applied in prospecting and exploration of ore-magmatic systems of Eastern Russia confined to granitoid cores in mantle diapirs [37].
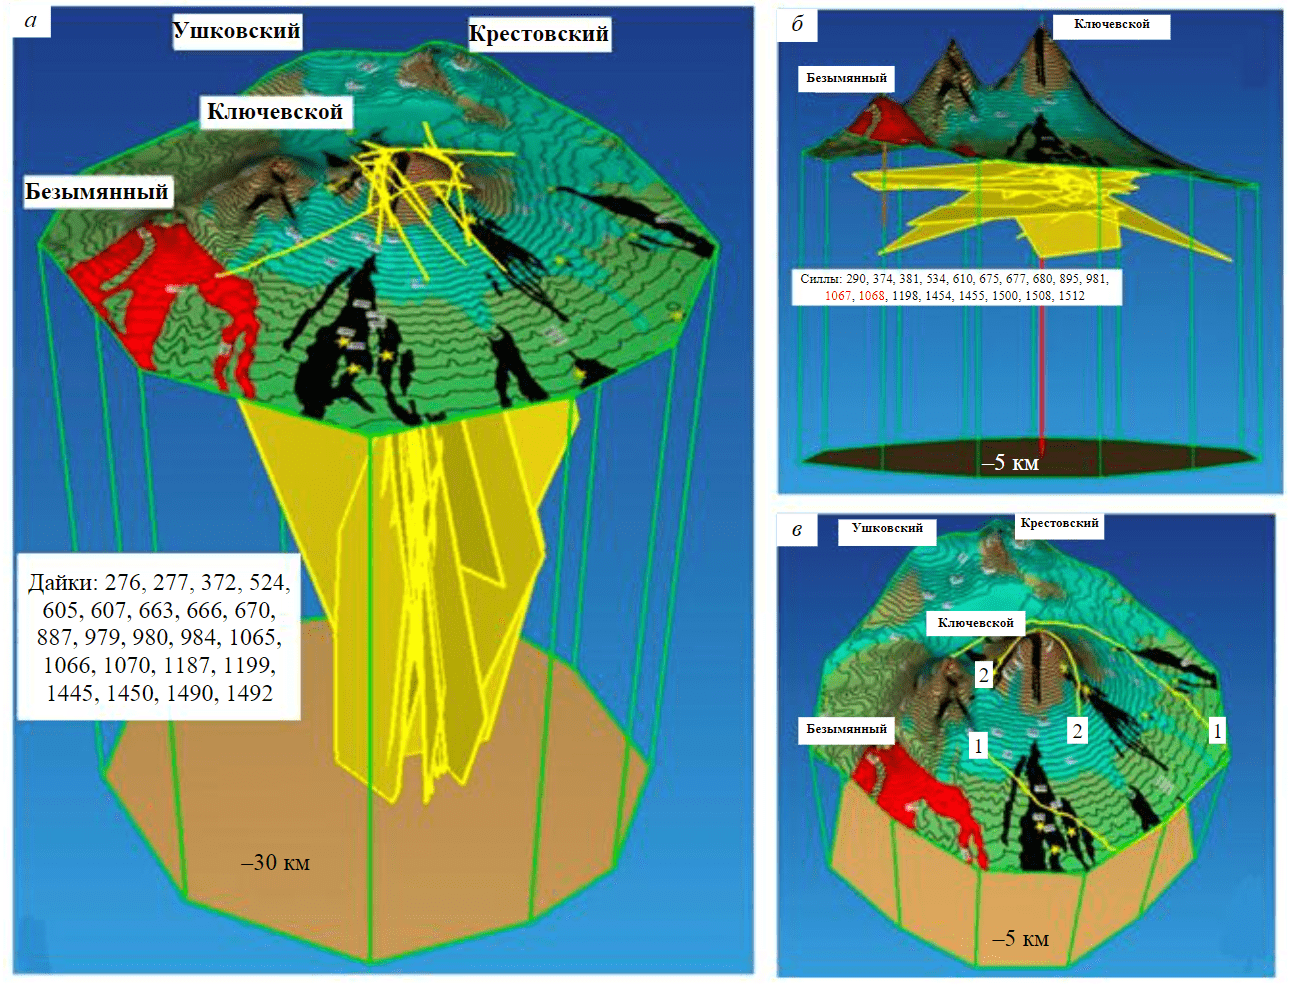
Fig.7. 3D-image of the magma transport and accumulation system in the structure and basement of Klyuchevskoy volcano prior to its eruptions: a – system of subvertical dykes (see Table 2), providing magma transport from the lower crustal magmatic chamber K2 to the upper peripheral magmatic chamber K1; b – system of sills (see Table 2) of the upper peripheral magmatic chamber K1, providing vapor-gas activity of the volcano during the interparoxysmal period and venting the volcano channel before eruptions; c – two main sills (see Table 4) that provided flank eruptions of the Klyuchevskoy volcano in 1932-2021; 1, 2 – traces of the averaged plane of sills on the topographic surface
This research was performed using data obtained at the Unique Scientific Unit “Seismoinfrasound Complex for Monitoring the Arctic Cryolithozone and the Complex of Continuous Seismic Monitoring of the Russian Federation, Adjacent Territories and the World” (ckp-rf.ru).
References
- Kiryukhin A.V. Geothermofluidomechanics hydrothermal, volcanic and hydrocarbon system. Saint-Petersburg: Eco-Vector I.P., 2020. 431 p. (in Russian).
- Reed M., Palandri J. Ascent and cooling of magmatic fluids: Precipitation of vein and alteration minerals. Water-Rock Interaction XIII. London: Taylor & Francis Group, 2010. 1008 p.
- Kiryukhin A.V., Fedotov S.A., Kiryukhin P.A. Magmatic systems and the conditions for hydrothermal circulation at depth in the Klyuchevskoi volcanic cluster as inferred from observations of local seismicity and thermo-hydrodynamic simulation. Journal of Volcanology and Seismology. 2018. Vol. 12. N 4, p. 231-241. DOI: 10.1134/S020303061804003X
- Dyadkin Yu. D. Principles of Geothermal Technology. Leningrad: Leningrad Mining Institute, 1985. 175 p.
- Girina O.A., Gordeev E.I., Ozerov A.Yu. et al. 30 years of Kamchatka Volcanic Eruption Response Team / Volcanism and related processes. Proceedings of the XXVI annual scientific conference dedicated to the Volcanologist Day, 30-31 March 2023. – Petropavlovsk-Kamchatsky: IVS FEB RAS, 2023, p. 34-37 (in Russian).
- Azizah Al Shehri, Gudmundsson A. Modelling of surface stresses and fracturing during dyke emplacement: Application to the 2009 episode at Harrat Lunayyir, Saudi Arabia. Journal of Volcanology and Geothermal Research. 2018. Vol. 356, p. 278-303. DOI: 10.1016/j.jvolgeores.2018.03.011
- Drymoni K., Russo E., Tibaldi A. et al. Dyke-induced graben formation in a heterogeneous succession on Mt. Etna: Insights from field observations and FEM numerical models. Journal of Volcanology and Geothermal Research. 2023. Vol. 433. N 107712. DOI: 10.1016/j.jvolgeores.2022.107712
- Drymoni K., Browning J., Gudmundsson A. Dyke-arrest scenarios in extensional regimes: Insights from field observations and numerical models, Santorini, Greece. Journal of Volcanology and Geothermal Research. 2020. Vol. 396. N 106854. DOI: 10.1016/j.jvolgeores.2020.106854
- Rivalta E., Taisne B., Bunger A.P., Katz R.F. A review of mechanical models of dyke propagation: Schools of thought, results and future directions. Tectonophysics. 2015. Vol. 638, p. 1-42. DOI: 10.1016/j.tecto.2014.10.003
- Woods J., Winder T., White R.S., Brandsdóttir B. Evolution of a lateral dike intrusion revealed by relatively-relocated dike-induced earthquakes: The 2014–15 Bárðarbunga–Holuhraun rifting event, Iceland. Earth and Planetary Science Letters. 2018. Vol. 506, p. 53-63. DOI: 10.1016/j.epsl.2018.10.032
- Fedotov S.A. Magmatic feeding systems and mechanism of volcanic eruptions. Moscow: Nauka, 2006. 455 p.
- Bergal-Kuvikas O., Nakagawa M., Kuritani T. et al. A petrological and geochemical study on time-series samples from Klyuchevskoy volcano, Kamchatka arc. Contributions to Mineralogy and Petrology. 2017. Vol. 172. N 35. DOI: 10.1007/s00410-017-1347-z
- Ozerov A.Yu. Klyuchevskoy volcano: rocks, dynamics, model. Moscow: GEOS, 2019, p. 306. (in Russian).
- Fedotova S.A., Zharinova N.A., Gontovaya L.I. The Magmatic System of the Klyuchevskaya Group of Volcanoes Inferred from Data on Its Eruptions, Earthquakes, Deformation, and Deep Structure. Journal of Volcanology and Seismology. 2010. Vol. 4. N 1, p. 1-33. DOI: 10.1134/S074204631001001X
- Koulakov I., Gordeev E.I., Dobretsov N.L. et al. Rapid changes in magma storage beneath the Klyuchevskoy group of volcanoes inferred from time-dependent seismic tomography. Journal of Volcanology and Geothermal Research. 2013. Vol. 263, p. 75-91. DOI: 10.1016/j.jvolgeores.2012.10.014
- Koulakov I., Abkadyrov I., Nassir Al Arifi et al. Three different types of plumbing system beneath the neighboring active volcanoes of Tolbachik, Bezymianny, and Klyuchevskoy in Kamchatka. Journal of Geophysical Research: Solid Earth. 2017. Vol. 122, p. 3852-3874. DOI: 10.1002/2017JB014082
- Koulakov I., Shapiro N.M., Sens-Schönfelder C. et al. Mantle and crustal sources of magmatic activity of Klyuchevskoy and surrounding volcanoes in Kamchatka inferred from earthquake tomography. Journal of Geophysical Research: Solid Earth. Vol. 125. N e2020JB020097. DOI: 10.1029/2020JB020097
- Koulakov I., Plechov P., Mania R. et al. Anatomy of the Bezymianny volcano merely before an explosive eruption on 20.12.2017. Scientific Reports Springer Nature. 2021. Vol. 19. N 11. N 1758. DOI: 10.1038/s41598-021-81498-9
- Shapiro N.M., Droznin D.V., Droznina S.Ya. et al. Deep and shallow long-period volcanic seismicity linked by fluid-pressure transfer. Nature Geosciences. 2017. Vol. 10, p. 442-445. DOI: 10.1038/NGEO2952
- Mironov N.L., Portnyagin M.V. H2O and CO2 in parental magmas of Kliuchevskoi volcano inferred from study of melt and fluid inclusions in olivine. Russian Geology and Geophysics. 2011. Vol. 52 (11), p. 1353-1367. DOI:10.1016/j.rgg.2011.10.007
- Fournier R.O., Pitt A.M. The Yellowstone Magmatic-Hydrothermal System. Davis, CA, USA: Geothermal Resources Council, 1985, p. 319-327.
- Sahoo S., Tiwari D., Panda D. et al Eruption cycles of Mount Etna triggered by seasonal climatic rainfall. Journal of Geodynamics. 2022. Vol. 149. N 101896. DOI: 10.1016/j.jog.2021.101896
- Gudmundsson A. How local stresses control magma-chamber ruptures, dyke injections, and eruptions in composite volcanoes. Earth-Science Reviews. 2006. Vol. 79. Iss.1-2, p. 1-31. DOI: 10.1016/j.earscirev.2006.06.006
- Gudmundsson A. Introduction // Volcanotectonics: Understanding the Structure, Deformation and Dynamics of Volcanoes. Cambridge: Cambridge University Press. 2020, p. 1-33. DOI: 10.1017/9781139176217.002
- Senyukov S.L. Monitoring and Prediction of Volcanic Activity in Kamchatka from Seismological Data: 2000-2010. Journal of Volcanology and Seismology. 2013. Vol. 7. N 1, p. 86-97 (in Russian). DOI: 10.7868/S0203030613010070
- Chebrov V.N., Droznin D.V., Kugaenko Yu.A. et al. The System of Detailed Seismological Observations in Kamchatka in 2011. Journal of Volcanology and Seismology. 2013. Vol. 7. N 1, p. 18-40 (in Russian). DOI: 10.7868/S0203030613010021
- Chebrova A.Yu., Chemarev A.S., Matveenko E.A., Chebrov D.V. Seismological data information system in Kamchatka Branch of GS RAS: organization principles, main elements and key functions. Geophysical Research. 2020. Vol. 21. N 3, p. 66-91 (in Russian). DOI: 10.21455/gr2020.3-5
- Girina O.A., Ozerov A.Yu., Melnikov D.V. et al. Avachinsky Volcano: monitoring and main eruption characteristics. Volcanism and related processes. Proceedings of the XXVI annual scientific conference dedicated to the Volcanologist Day, March, 28-29, 2019, Petropavlovsk-Kamchatsky. Petropavlovsk-Kamchatsky: IVS FEB RAS, 2019, p.11-14 (in Russian).
- Coppola D., Laiolo M., Massimetti F. et al. Thermal remote sensing reveals communication between volcanoes of the Klyuchevskoy Volcanic Group. Scientific Reports. 2021. Vol. 11. N 13090. DOI: 10.1038/s41598-021-92542-z
- Senyukov S. Activity of volcanoes in Kamchatka: monitoring and forecasting. Science in Russia. 2014. N 6 (203), p. 67-75. (in Russian). EDN TFNUST
- Zoback M. D. Reservoir Geomechanics. Cambridge University Press. 2010. 448 p.
- Cherkashin R I., Bergal-Kuvikas O.V., Chugaev A.V. et al. Conditions and Magmas Sources of the Summit and Flank Eruptions of Klyuchevskoy Volcano in 2020-2021: Isotope (Sr–Nd–Pb–O)-geochemical data. Petrology. 2023. Vol. 31. N 3, p. 304-319. DOI.org/10.1134/S0869591123030037
- Gudmundsson A. Deflection of dykes into sills at discontinuities and magma-chamber formation. Tectonophysics. 2011. Vol. 500, p. 50-64. DOI: 10.1016/j.tecto.2009.10.015
- Clunes M., Browning J., Marquardt C. et al. Inclination and heterogeneity of layered geological sequences influence dike-induced ground deformation. Geology. 2023. Vol. 51 (3), p. 278-283. DOI: 10.1130/G50464.1
- Gudmundsson A. The propagation paths of fluid-driven fractures in layered and faulted rocks. Geological Magazine. 2023. Vol. 159, p. 1978-2001. DOI: 10.1017/S0016756822000826
- Talovina I.V., Krikun N.S., Yurchenko Yu.Yu., Ageev A.S. Remote sensing techniques in the study of structural and geotectonic features of Iturup Island (the Kuril Islands). Journal of Mining Institute. 2022. Vol. 254, p. 158-172. DOI: 10.31897/PMI.2022.45
- Alekseev V.I. Deep structure and geodynamic conditions of granitoid magmatism in the Eastern Russia. Journal of Mining Institute. 2020. Vol. 243, p. 259-265. DOI: 10.31897/PMI.2020.3.259