
Landslide hazard assessment in Tinh Tuc town, Cao Bang province, Vietnam using Frequency ratio method and the combined Fractal-frequency ratio method
- 1 — Ph.D. Postgraduate student Department of Engineering Geology, Hydrogeological Faculty, Ordzhonikidzе Russian State Geological Prospecting University (MGRI) ▪ Orcid
- 2 — Ph.D., Dr.Sci. Professor Sergo Ordzhonikidze Russian State University for Geological Prospecting ▪ Orcid ▪ Scopus ▪ ResearcherID
- 3 — Ph.D. Lecturer Sergo Ordzhonikidze Russian State University for Geological Prospecting ▪ Orcid
- 4 — Ph.D. Leading Researcher Lomonosov Moscow State University ▪ Orcid ▪ Scopus
- 5 — Ph.D. Senior Researcher Lomonosov Moscow State University ▪ Orcid ▪ Scopus ▪ ResearcherID
- 6 — Researcher Vietnam Institute of Geosciences and Mineral Resources ▪ Orcid
Abstract
Landslides are one of the most frequent natural disasters that cause significant damage to property in Vietnam, which is characterized by mountainous terrain covering three-quarters of the territory. In 17 northern mountainous provinces of the country, over 500 communes are at a high to very high landslide hazard. The main goal of this study was to establish landslide hazard maps and conduct a comparative evaluation of the efficiency of the methods employed in Tinh Tuc town, Cao Bang province. The landslide hazard assessment was carried out in this study using the combined Fractal-frequency ratio (FFR) and the Frequency ratio (FR) methods. The FR method is based on the actualist principle, which assumes that future landslides may be caused by the same factors that contributed to slope failure in the past and present. The FFR method is based on the determination of the fractal dimension, which serves as a measure of the landslide filling density in the study area. Eight landslide-related factors were considered and presented in cartographic format: elevation, distance to roads, slope, geology, distance to faults, land use, slope aspect, and distance to drainage. Determining the area under the receiver operating characteristic curve (ROC-AUC) and verification index (LRclass) was performed to assess the performance of prediction models and the accuracy of the obtained maps. As a result, five zones were identified for the study area, characterized by very low, low, moderate, high, and very high landslide hazards. The analysis of the reliability of the obtained landslide hazard maps using the AUC and LRclass indices revealed that the FFR model has a higher degree of reliability (AUC = 86 %, LRclass = 86 %) compared to the FR model (AUC = 72 %, LRclass = 73 %); therefore, its use is more effective.
The study was conducted as part of the national scientific and technical project under grant N ĐTĐL.CN-81/21.
Introduction
Located on the eastern edge of the Southeast Asia region, Vietnam is considered one of the most rapidly developing countries in the world. Due to the tropical monsoon climate, the precipitation in Vietnam is extremely high and ranges from 3500 to 4500 mm per year. These conditions are factors that contribute to the occurrence of numerous landslides. Based on data from the Vietnam Disaster Management Authority (Hanoi, October 2019), Vietnam experienced 448 flash floods and landslides between 1953 and 2006 (an average of seven events per year) and 250 flash floods and landslides (an average of 15-16 events per year) between 2000 and 2015, indicating an increase in the development intensity of the landslide process. These events resulted in significant socio-economic damage [1-3]. To promote the sustainable development of mountain regions, the Vietnamese government has been developing a disaster prevention and mitigation strategy in which mapping landslide susceptibility and hazards is one of its primary objectives. Consequently, numerous studies have been carried out to predict the development of landslide processes. For example, based on the study results of 10266 landslide locations in the northern mountainous provinces of Vietnam, conducted from 2012 to 2017, more than 500 communes in 17 mountainous provinces were identified as having high and very high landslide hazards.
Cao Bang province, covering an area of 6690 km2 (Fig.1), is one of the northern provinces of Vietnam. Mountainous terrain, challenging engineering and geological conditions, and a tropical monsoon climate with high average annual precipitation contribute to the widespread development of the landslide process, and the Nguyen Binh district, located in the southern part of the province, is considered one of the areas with a very high landslide hazard [4]. The study area covers an area of 66.76 km2, including Tinh Tuc town and its surrounding area, which is located 18 km from the center of Nguyen Binh district. The elevation varies from 434 m in the valley to 1932 m (Phia Oac peak) in the mountainous area [5].
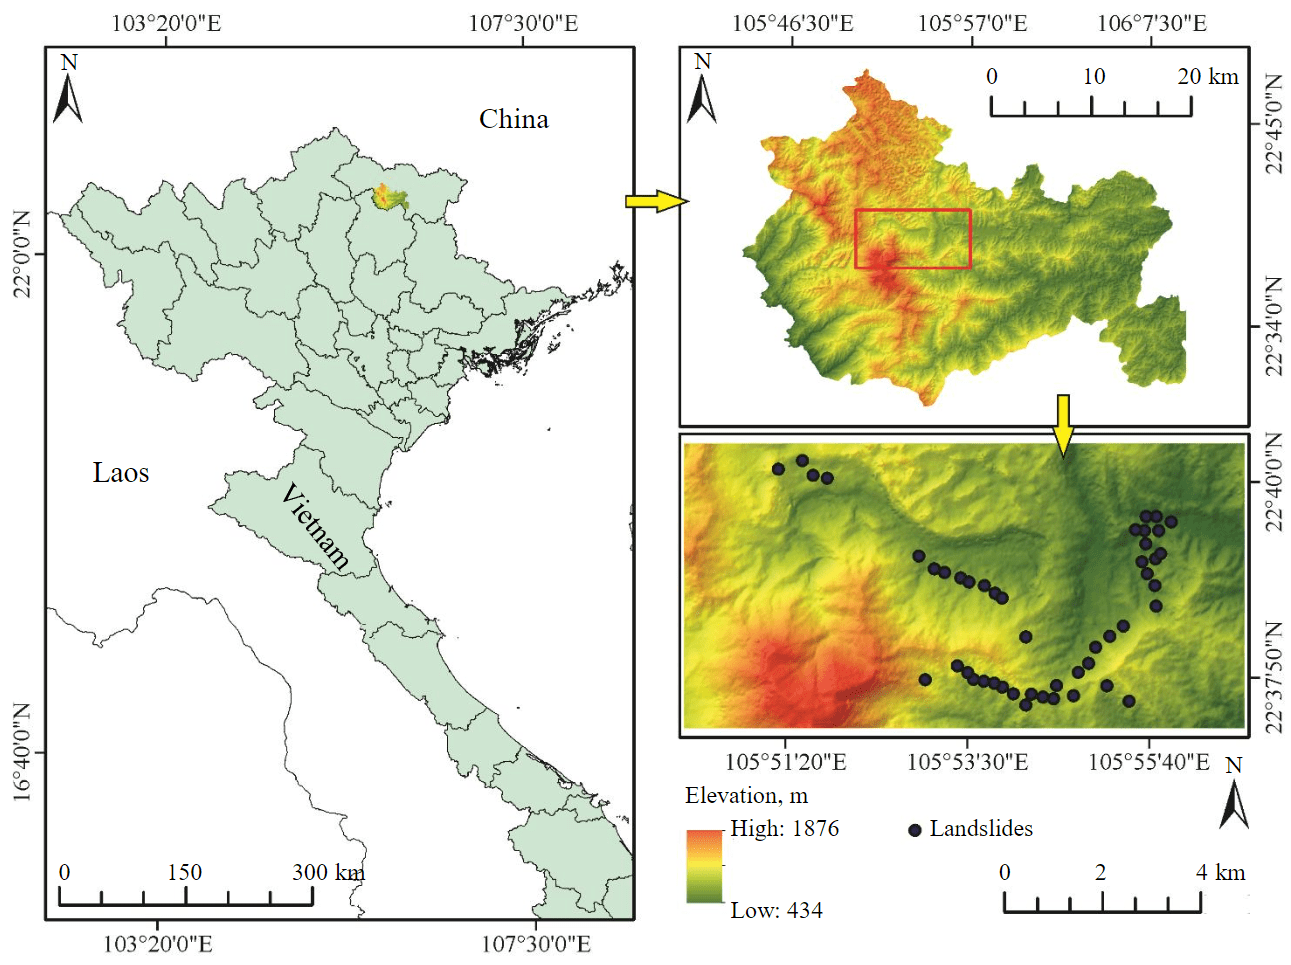
Fig.1. Location of study area
The main aim of this work was to produce a landslide hazard map of Tinh Tuc town, Cao Bang province, Vietnam. The statistical Frequency ratio (FR) and the combined Fractal-frequency ratio methods (FFR) were employed to accomplish this objective. As a result, landslide hazard maps for the study area were established. Furthermore, the enhanced efficacy of the combined Fractal-frequency ratio method was confirmed when compared to the traditional statistical Frequency ratio method.
Methods
The preparation of landslide susceptibility maps for territories depends on the complicated relationship between landslide occurrences and causative factors, which needs thorough consideration throughout the analysis. The main goal of their establishment is to predict the spatial distribution of landslides. It is crucial to note that the landslide susceptibility assessment outcomes provide a basis for categorizing the study area according to landslide hazards. Methods based on Geographic Information Systems (GIS) have become more prevalent [2, 6, 7] because landslide evaluations necessitate a comprehensive analysis of significant input data sets. The development of geographic information analysis and mathematical statistics methods has resulted in landslide susceptibility modeling being accessible, straightforward, and feasible in both scientific studies and the economic evaluation of planned territorial development [8]. Because of their efficacy and simplicity, statistical methods are uniquely positioned among these works [9, 10]. The main advantage of these methods is that they enable a statistical evaluation of the significance of different factor classes using historical data on landslides in the study area. Statistical methods have been enhanced in reliability in recent years through modifications [11, 12] or combinations with other methods [13, 14].
Frequency ratio method
The statistical method (FR), which analyzes the frequency ratio of events, is a highly effective instrument for assessing landslide susceptibility [15] because of its user-friendliness and the high reliability of the acquired results. The method is based on the principle that future landslides may be triggered by the same factors that have caused slope failure in the past and present. Therefore, recorded landslide knowledge is crucial for landslide hazard prediction. The relationship between landslide locations and factors contributing to their development can be determined quantitatively using the frequency ratio method [16]. Following the classification of landslip factors into classes, the frequency ratio value (FR) can be calculated employing the following equation [3]:
where PLS represents the percentage of landslides within each factor class; PC represents the area percentage of each factor class; Li represents the number of landslides in factor class i; ΣLi represents the total number of landslides in the study area; Ai represents the area of factor class i; ΣAi represents the area of the study region.
This study employed the normalized frequency ratio, which was calculated as follows:
where FRi is the FR value of factor class i.
By employing this approach, the landslide susceptibility index can be determined as follows:
Fractal-frequency ratio method
Recently, fractal theory-based approaches have been aggressively implemented in geological practice [17, 18]. The utilization of fractal analysis to solve geological problems has been the subject of numerous published articles. To a large extent, they generally document the self-similarity properties exhibited by various objects and processes. Simultaneously, based on the outcomes of such an analysis, key conclusions may be drawn regarding the type of systems under consideration, including the regularity and predictability of their dynamics [19]. There is not a generally accepted, rigorous definition of a fractal. Benoit Mandelbrot provided the following definition of a fractal in his work [20]: “A set whose Hausdorff – Bezikovich dimension (fractal dimension) is strictly greater than its topological dimension”. Additionally, he defined three primary attributes of fractals: self-similar form (scale invariance), the existence of random elements, and unusual dimensionality.
In recent years, the fractal approach has been extensively utilized for spatial analysis, including urban planning and development [21], variation in coastline length [22], land-cover evolution ana-lysis [23], as well as landslide hazard assessment for territories [24, 25]. Simultaneously, combined approaches such as the fractal-information coupling method [26] and the fractal-frequency ratio method [27] revealed the most effective.
The fractal approach is based on the power law
where r represents the feature measured scale (the scale under consideration); p represents the measured value under the corresponding scale r; С is a constant coefficient; D is the fractal dimension [28].
The density of filling the space is measured by the fractal dimension. In the case of landslide susceptibility assessment for the territory, it is a measure of the density of landslide filling in the study area. Therefore, it is possible to determine the quantitative relationship between landslide locations and the contributing factors that led to their occurrence by calculating the fractal dimension [29]. A greater fractal dimension denotes a greater significance attributed to a particular factor in the evolution of the landslide process.
In this study, the Variable dimension fractal method (VDFM) was used to evaluate the weights of the factors [28, 30]. The algorithm using the VDFM method includes the following steps [28]:
- calculation of the relative landslide density (PL);
- ranking classes in descending order of P value by the characteristic scale r;
- building a fractal model using data plotted on double logarithmic coordinates S, r and linear fitting to determine the value of dimension D. A set of values S, r can be produced from the raw values P, r, PLi is the relative landslide density in each factor class; S is the cumulative sum of PLi values; SLi is the cumulative sum of values of class i:
In this study, we used the correlation coefficient of the linear fitting (R2 > 0,999) as a criterion to pause the cumulative sum transform.
As a result, the weight of each factor can be calculated as follows:
For calculating the landslide susceptibility index, the FFR method uses the normalized frequency ratio value determined based on the FR method, according to equation (2).
Finally, the landslide susceptibility index is calculated using the equation
where NFRi is the NFR value of the factor class i.
Landslide inventory map
An effective landslide hazard model should maximize the consistency between recorded and predicted landslides. For assessing model quality, it is necessary to compare the landslide hazard prediction map with the available landslide inventory map. Therefore, preparing a landslide inventory map is critical to landslide hazard assessment [31].
The Landslide inventory map (LIM) depicts the distribution of current signs of the landslide process. It also includes qualitative, descriptive data regarding the hazards and morphological characteristics associated with landslides [32] and quantitative data regarding their number, scale, and location. The establishment of landslide inventory maps encompasses a range of approaches, which can be categorized into three distinct groups [3, 33]:
- visual interpretation-based methods;
- semi-automatic methods;
- automatic methods are utilized in conjunction with a training sample.
A landslide inventory map was prepared in the framework of this study, utilizing field investigation results, and analyzing aerial photography data. In total, 47 landslide sites were identified, ranging in volume from 60 m3 for the smallest to 50,000 m3 for the largest. Most landslides occurred along roads in low-mountainous areas. Figure 1 illustrates the landslide inventory map of the study area.
Landslide causative factors
The complicated relationship between landslide occurrence and causative factors is critical for preparing a landslide hazard map. Currently, there are no rigorous requirements for the selection of these individuals. Therefore, the selection of these factors may vary considerably across territories [34]. Based on statistical analysis, H.R.Pourghasemi [35] determined that in 94 % of published studies between 2005 and 2016, the slope was regarded as the most significant factor influencing landslide hazards, followed by lithology, slope aspect, land use, and elevation (Fig.2).
Based on the available data on the characteristics of the manifestation of the landslide process, for the goal of mapping landslide susceptibility and landslide hazards, eight factors were selected in consideration of the available data on the characteristics of the landslide process: elevation, distance to roads, slope, geology, distance to faults, land use, slope aspect, and distance to drainage. A 12.5-meter-resolution digital elevation model (DEM) utilized in this study was provided by the Institute of Geological Sciences, Vietnam Academy of Science and Technology. Based on it, thematic maps of the following factors were established: elevation (Fig.3, a), slope (Fig.3, c), slope aspect (Fig.3, g), and distances to drainage (Fig.3, h). During their preparation, each factor was categorized into classes, with elevation and slope divided into six classes and slope aspect into nine classes. Thematic maps of distance to roads (Fig.3, b), distance to drainage (Fig.3, h), and distance to faults (Fig.3, e) were produced using the “Euclidean Distance” tool in ArcGIS and then subdivided into six classes. The land use map (Fig.3, f) was produced by decrypting and classifying Sentinel-2 satellite images. As a result, land use was categorized into urban areas (UA), agricultural land (AG), shrubland (S), forest (F), and bare land (BL). In consideration of the geology factor, the geology map (Fig.3, d) indicates that the study area has six geological formations, in which the upper part of the geological section is represented by Quaternary deposits (Q), including the Bac Son Formation, Dong Dang Formation, Song Hien Formation, Cao Bang Complex, and Pia Oac Complex.
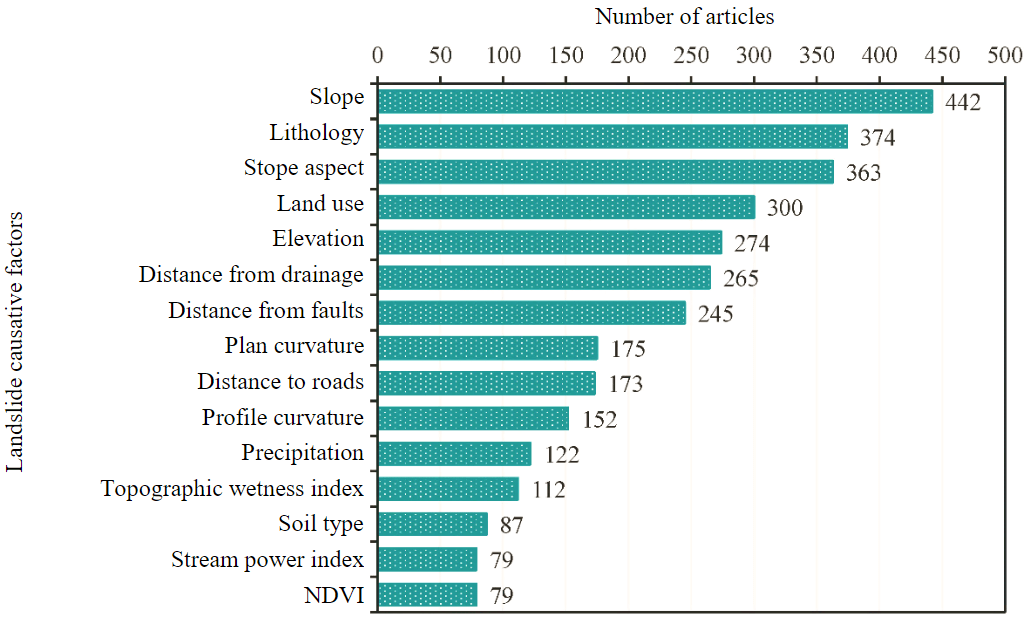
Fig.2. The fifteen most common landslide causative factors
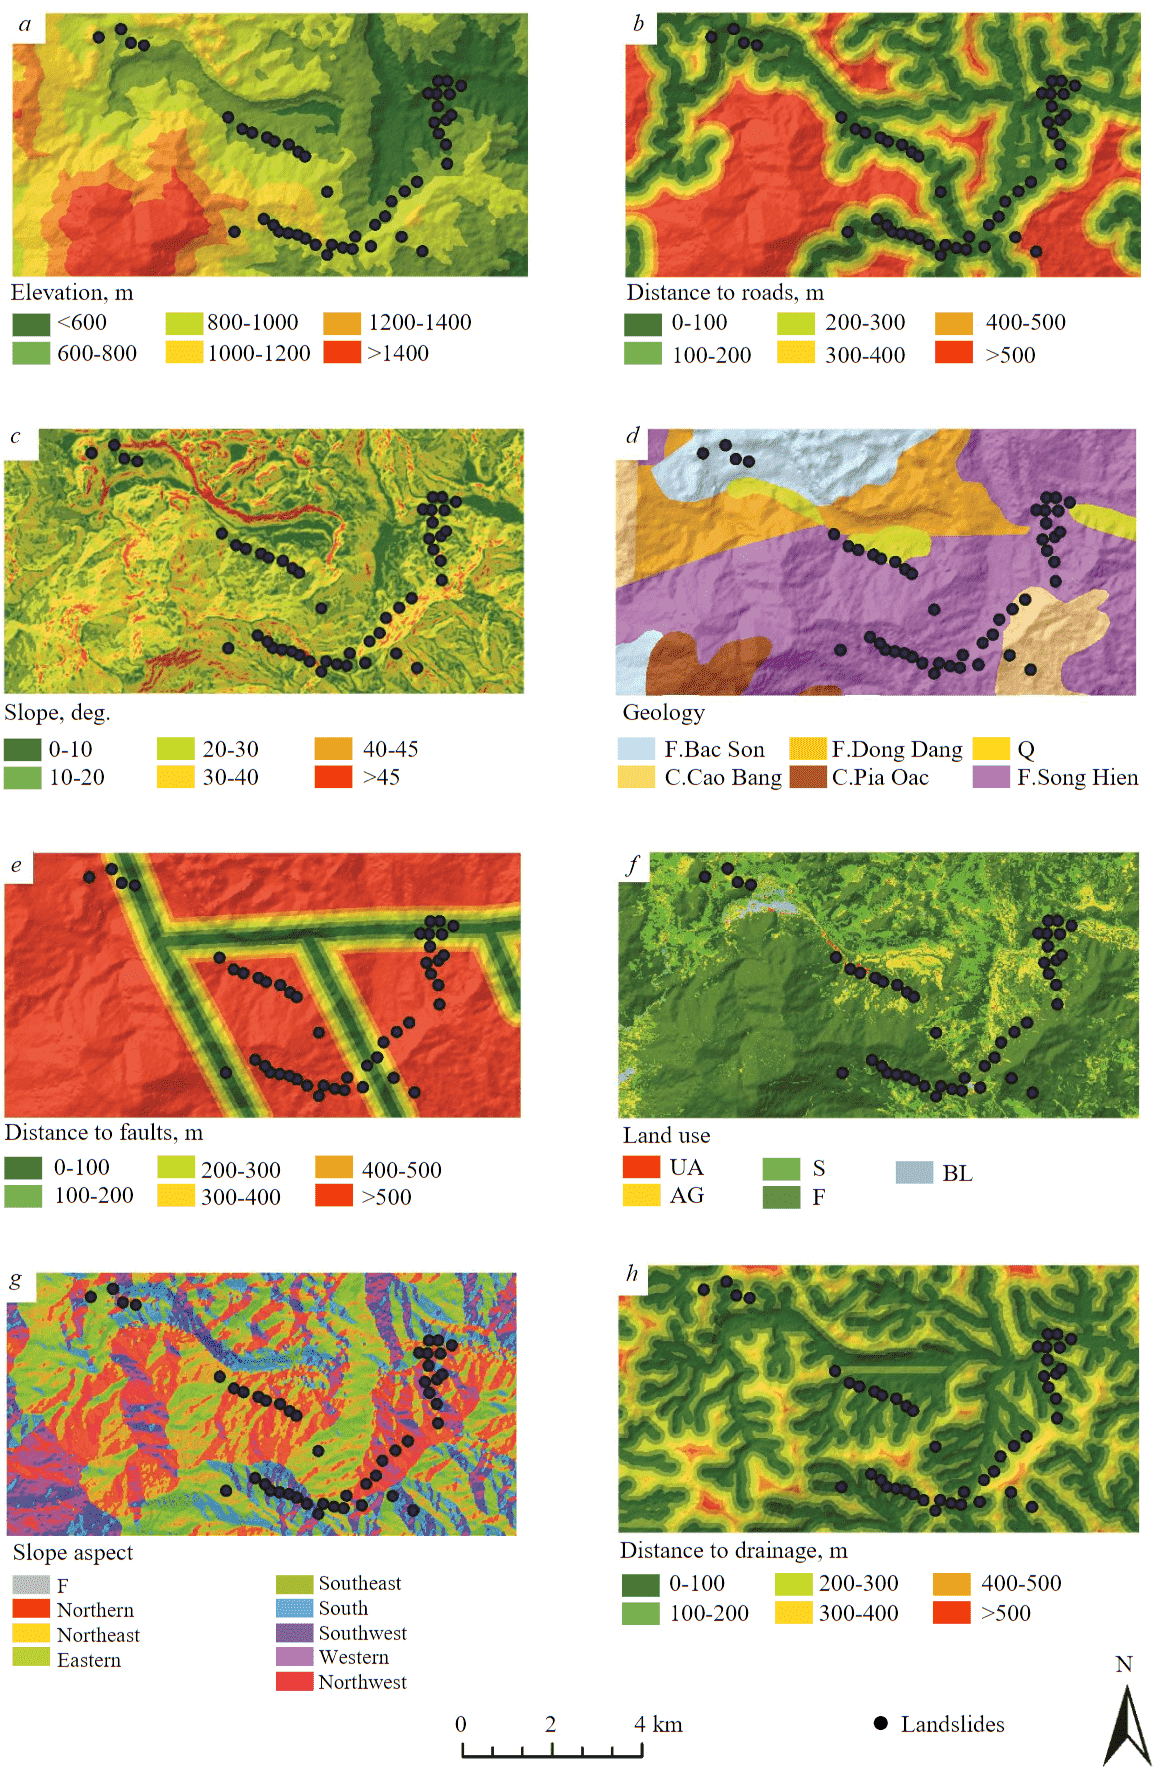
Fig.3. Factor maps: а – elevation; b – distance to roads; c – slope; d – geology; e – distance to faults; f – land use; g – slope aspect; h – distance to drainage
Model validation
The assessment of model validation, which involves comparing the acquired models to actual landslide data, is a critical phase in preparing landslide hazard maps. This task can be completed by comparing the produced maps categorizing the landslide hazards of the study area with the landslide inventory map [3]. A landslide hazard prediction model is considered trustworthy when it accurately categorizes most landslide events into the very high hazard zone and none into the very low hazard zone. Model validation was carried out in this study utilizing the Receiver operating characteristic (ROC) analysis method [36]. ROC analysis is a method for determining the optimal differentiation between two classes produced by a diagnostic test. The ROC curve illustrates the relationship between the Y-axis, which represents sensitivity or the probability of the true-positive rate (accurately predicted events), and the X-axis, which denotes the probability of the false-positive rate (inaccurately predicted events) or 1 – Specificity. The ROC curve approaches the upper and left-hand borders of the resulting graph, indicating that it provides more trustworthy analysis results. Afterward, model performance can be assessed using the area under the ROC curve (AUC); a larger area under the ROC curve indicates a more accurate classification. The AUC value ranges between 0.5 and 1.0, representing models that exhibit perfect or random prediction accuracy, respectively. Based on the Šimundić classification [37], the reliability of the produced maps may be determined as follows using the AUC value, %: 90-100 – excellent; 80-90 – very good; 70-80 – good; 60-70 – sufficient; 50-60 – inadequate. Previous studies have shown that the ROC-AUC approach alone may not provide a comprehensive indicator for evaluating the performance of prediction models [38, 39], as its results depend on the area of the classified hazard zones. Therefore, in this study, the AUC and LRclass [40, 41] indicators were employed to assess the performance of landslide prediction models. The AUC value was used to determine the overall performance of the prediction models, and the prediction performance in each hazard zone of the models was evaluated using the LRclass index.
Discussion of the study results
This study analyzed the relationship between landslide occurrences in the study area and the causative factors that influence their occurrence. An analysis of the landslide susceptibility assessment results of the study area obtained using the FR method revealed that areas with slopes ranging from 30 to 40 deg. and elevations below 600 m faced a high susceptibility to the landslide process. Landslide occurrences are more concentrated at distances of 100 m from roads and 200 m from faults, as well as in urban and agricultural areas. A negative correlation has been determined between the distance to drainage and an increase in the frequency of landslides. Geologically, landslides are primarily formed in the soils of Quaternary deposits and Song Hien formation sediments.
The outcomes of the fractal analysis are shown in Fig.4 and Table. As previously mentioned, the weight of factors was determined utilizing the fractal dimension by equation (6). As indicated by the obtained results, elevation plays the most significant role in the formation of landslides in the study area, followed by, in descending order of importance, slope aspect, slope, distance to faults, distance to drainage, geology, land use, and distance to roads.
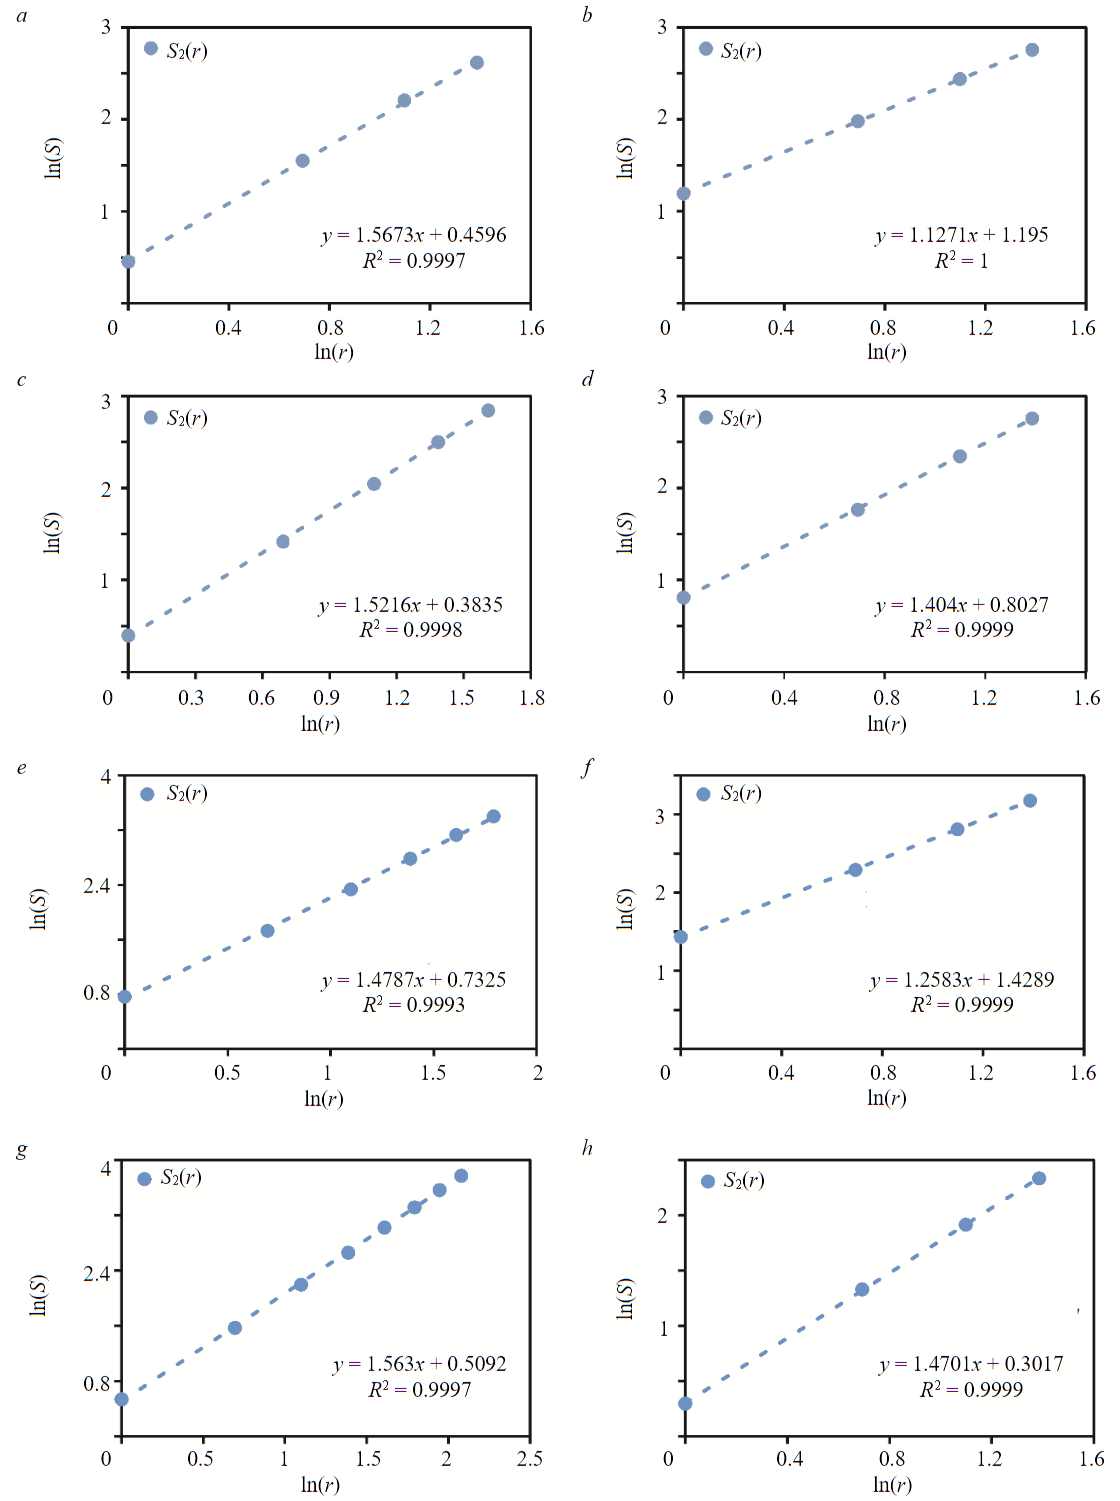
Fig.4. Determination of the fractal dimension of landslide causative factors: а – elevation; b – distance to roads; c – slope; d – geology; e – distance to faults; f – land use; g – slope aspect; h – distance to drainage
Weights of the factors calculated from fractal analysis
|
Factor |
Linear regression formulation |
Correlation coefficient R2 |
Fractal dimension Di |
Weight Wi |
|
Elevation |
y = 1.5673x + 0.4596 |
0.9997 |
1.5673 |
0.138 |
|
Distance to roads |
y = 1.1271x + 1.195 |
1 |
1.1271 |
0.099 |
|
Slope |
y = 1.5216x + 0.3835 |
0.9998 |
1.5216 |
0.134 |
|
Geology |
y = 1.404x + 0.8027 |
0.9999 |
1.4040 |
0.123 |
|
Distance to faults |
y = 1.4787x + 0.7325 |
0.9993 |
1.4787 |
0.130 |
|
Land use |
y = 1.2583x + 1.4289 |
0.9999 |
1.2583 |
0.110 |
|
Slope aspect |
y = 1.563x + 0.5092 |
0.9997 |
1.5630 |
0.137 |
|
Distance to drainage |
y = 1.4701x + 0.3017 |
0.9999 |
1.4701 |
0.129 |
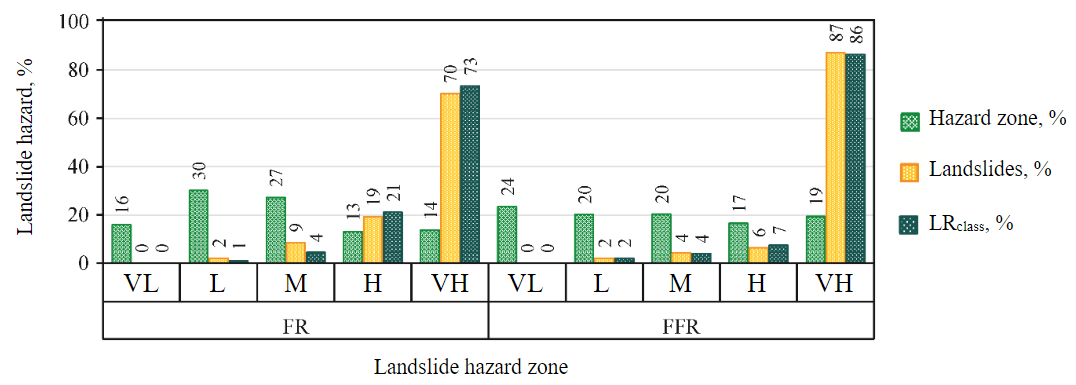
Fig.6. Results of landslide hazard assessment and reliability of models based on LRclass analysis
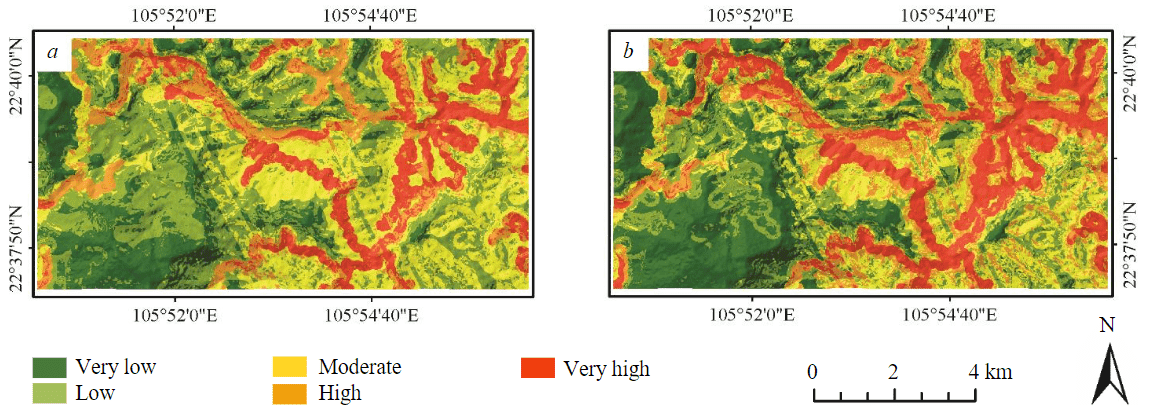
Fig.5. The landslide hazard maps produced using the FR (a) and FFR (b) methods
According to the analysis results using the FR and FFR methods, the landslide susceptibility index (LSI) value ranges from 0.446 to 3.149 and 0.057 to 0.375, respectively. Using the Jenks natural breaks classification method, the study area was classified by landslide hazards based on LSI maps. As a result, the study area was classified into five zones with very low (VL), low (L), moderate (M), high (H), and very high (VH) landslide hazards (Fig.5).
The calculated areas of landslide hazard zones are shown in Fig.6, utilizing the employed methods. Compared to the FR method, the FFR method predicted an extensive area of the very low landslide hazard zone. The FR method, in contrast, yielded a large area encompassing zones of low to moderate landslide hazards. Simultaneously, the FFR method predicted an area of the very high landslide hazard zone (19 %). Figure 6 shows the distribution of landslides in the classified landslide hazard zones according to the number of landslides. Both models have good efficiency. The FR method determined that 70 % of landslides occurred in the very high landslide hazard zone, while the FFR method successfully predicted 87 % of past landslides.
The ROC curves (Fig.7), characterizing the reliability of the assessment results, also proved the high accuracy of the performed landslide hazard prediction. Simultaneously, the analysis revealed that the FR method exhibited “good” prediction performance (AUC = 72 %), while the FFR method demonstrated “very good” prediction performance (AUC = 86 %) [37].
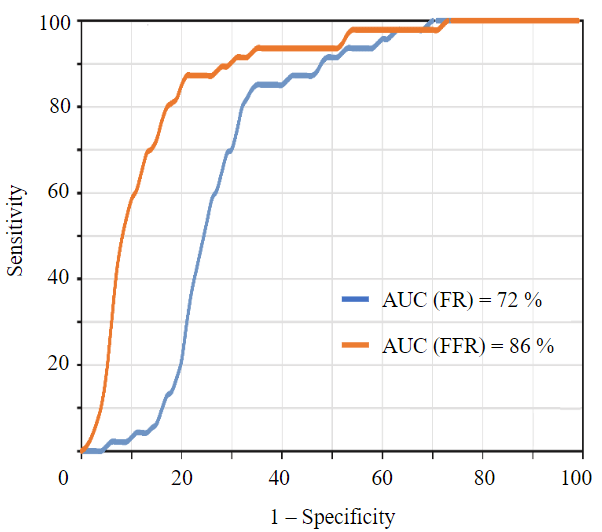
Fig.7. A graph illustrating the reliability of the FR and FFR models by ROC analysis
The outcomes derived from the ROC curve analysis are consistent with the results acquired from calculating the LRclass index (see Fig.6) for the FR model (LRclass = 73 %) and the FFR model (LRclass = 86 %). Additionally, it demonstrates that although the FFR method accurately predicted a large area of the very high landslide hazard zone, it did not overestimate the landslide hazard within the study area. Therefore, it can be concluded that the landslide hazard model derived from the combined Fractal-frequency ratio method exhibits better performance when compared to the traditional statistical Frequency ratio method.
Conclusions
Numerous factors influence the reliability of the landslide hazard assessment, including the prediction methods used. Therefore, two methods were used in this study – the bivariate statistical Frequency ratio method and the combined Fractal-frequency ratio method. A comparison was conducted between the assessment outcomes produced by the FFR method and those produced by the FR method. In addition, the study results showed a significant improvement in the quality of the landslide hazard prediction. According to the FFR model, 24 % of the study area was categorized as a very low landslide hazard zone, while the FR model classified only 16 % of the study area as this hazard zone. In the planning for territory development, including the design of sustainable residential communities that are not susceptible to natural disasters, the obtained result has critical practical significance. A considerable difference in model reliability between the FFR and FR methods (14 % based on ROC analysis and 13 % using the LRclass index) was an unexpected outcome for the authors. Further study is being conducted in the field of verification. Concurrently, the obtained results enable us to draw an important conclusion: the utility of combined methods, including fractal analysis, to improve the accuracy of landslide hazard maps is an exceedingly promising direction of landslide studies.
References
- Quynh Duy Bui, Hang Ha, Dong Thanh Khuc et al. Landslide susceptibility prediction mapping with advanced ensemble models: Son La province, Vietnam. Natural Hazards. 2023. Vol. 116. Iss. 2, p. 2283-2309. DOI: 10.1007/s11069-022-05764-3
- Duong V.B., Fomenko I.K., Vu H.D. et al. Regional assessment of landslide hazard using modified analytic hierarchies process method in geoinformation system (a study of the Sa Pa District, Lao Cai Province, Vietnam). Engineering Geology World. 2021. Vol. XVI. N 2, p. 6-20 (in Russian). DOI: 10.25296/1993-5056-2021-16-2-6-20
- Duong V.B., Fomenko I.K., Nguyen T.K. et al. Application of GIS-based bivariate statistical methods for landslide potential assessment in Sapa, Vietnam. Bulletin of the Tomsk Polytechnic University. Geo Аssets Engineering. 2022. Vol. 333. N 4, р. 126-140 (in Russian). DOI: 10.18799/24131830/2022/4/3473
- Nguyen Thi Hoa, Nguyen Quoc Phi, Pham Dinh Manh. Assessment of the current status of geological hazards in Nguyen Binh district, Cao Bang province using open data sources (In Vie). Earth sciences and natural resource for sustainable development. Hanoi, 2022, p. 510-514. URL: https://ersd.humg.edu.vn/ersd/ersd2022/book5 (accessed 06.07.2023).
- Nguyen Trung Kien, The Viet Tran, Vy Thi Hong Lien et al. Landslide Susceptibility Mapping Based on the Combination of Bivariate Statistics and Modified Analytic Hierarchy Process Methods: A Case Study of Tinh Tuc Town, Nguyen Binh District, Cao Bang Province, Vietnam. Journal of Disaster Research. 2021. Vol. 16. N 4, p. 521-528. DOI: 10.20965/jdr.2021.p0521
- Krivoguz D., Bespalova L. Landslide susceptibility analysis for the Kerch Peninsula using weights of evidence approach and GIS. Russian Journal of Earth Sciences. 2020. Vol. 20. N ES1003. DOI: 10.2205/2020ES000682
- Kharchenko S.V., Shvarev S.V. Forecasting landslide hazards in the vicinity of Krasnaya Polyana based on the linear discriminatory analysis. Vestnik Moskovskogo universiteta. Seriya 5. Geografiya. 2020. N 3, p. 22-33 (in Russian).
- Nguyen T.K., Fomenko I.K., Pendin V.V., Nguyen Q.T. Application of the method of analysis hierarchies (AHP) under the regional landslide hazard assessment (for example area North-West of Laocai in Vietnam). Geoinformatika. 2017. N 2, p. 53-66 (in Russian).
- Anis Z., Wissem G., Vali V. et al. GIS-based landslide susceptibility mapping using bivariate statistical methods in North-western Tunisia. Open Geosciences. 2019. Vol. 11. Iss. 1, p. 708-726. DOI: 10.1515/geo-2019-0056
- Ram P., Gupta V., Devi M., Vishwakarma N. Landslide susceptibility mapping using bivariate statistical method for the hilly township of Mussoorie and its surrounding areas, Uttarakhand Himalaya. Journal of Earth System Science. 2020. Vol. 129. Iss. 1. N 167. DOI: 10.1007/s12040-020-01428-7
- Langping Li, Hengxing Lan, Changbao Guo et al. A modified frequency ratio method for landslide susceptibility assessment. Landslides. 2017. Vol. 14. Iss. 2, p. 727-741. DOI: 10.1007/s10346-016-0771-x
- Sifa S.F., Mahmud T., Tarin M.A., Haque D.M.E. Event-based landslide susceptibility mapping using weights of evidence (WoE) and modified frequency ratio (MFR) model: a case study of Rangamati district in Bangladesh. Geology, Ecology, and Landscapes. 2020. Vol. 4. Iss. 3, p. 222-235. DOI: 10.1080/24749508.2019.1619222
- Feby B., Achu A.L., Jimnisha K. et al. Landslide susceptibility modelling using integrated evidential belief function based logistic regression method: A study from Southern Western Ghats, India. Remote Sensing Applications: Society and Environment. 2020. Vol. 20. N 100411. DOI: 10.1016/j.rsase.2020.100411
- Polykretis C., Grillakis M.G., Argyriou A.V. et al. Integrating Multivariate (GeoDetector) and Bivariate (IV) Statistics for Hybrid Landslide Susceptibility Modeling: A Case of the Vicinity of Pinios Artificial Lake, Ilia, Greece. Land. 2021. Vol. 10. Iss. 9. N 973. DOI: 10.3390/land10090973
- Silalahi F.E.S., Pamela, Arifianti Y., Hidayat F. Landslide susceptibility assessment using frequency ratio model in Bogor, West Java, Indonesia. Geoscience Letters. 2019. Vol. 6. N 10. DOI: 10.1186/s40562-019-0140-4
- Karaman M.O., Çabuk S.N., Pekkan E. Utilization of frequency ratio method for the production of landslide susceptibility maps: Karaburun Peninsula case, Turkey. Environmental Science and Pollution Research. 2022. Vol. 29. Iss. 60, p. 91285-91305. DOI: 10.1007/s11356-022-21931-2
- Mandelbrot B. How Long is the Coast of Britain? Statistical Self-Similarity and Fractional Dimension. Science. 1967. Vol. 156. Iss. 3775, p. 636-638. DOI: 10.1126/science.156.3775.636
- Mandelbrot B.B. Fractal Analysis and Synthesis of Fracture Surface Roughness and Related Forms of Complexity and Disorder. International Journal of Fracture. 2006. Vol. 138. Iss. 1-4, p. 13-17. DOI: 10.1007/s10704-006-0037-z
- Zakharov V. S. Self-similarity of structures and processes in the lithosphere based on the results of fractal and dynamic analysis: Abstract of the dissertation for the degree of Doctor of Geological and Mineralogical Sciences. Moscow: Lomonosov Moscow State University, 2014, p. 35 (In Russian).
- Mandelbrot B.B. The Fractal Geometry of Nature. New York: W.H.Freeman and Company, 1982, p. 460.
- Xiaoming Man, Yanguang Chen. Fractal-Based Modeling and Spatial Analysis of Urban Form and Growth: A Case Study of Shenzhen in China. ISPRS International Journal of Geo-Information. 2020. Vol. 9. Iss. 11. N 672. DOI: 10.3390/ijgi9110672
- Husain A., Reddy J., Bisht D., Sajid M. Fractal dimension of coastline of Australia. Scientific Reports. 2021. Vol. 11. N 6304. DOI: 10.1038/s41598-021-85405-0
- Luxiao Cheng, Ruyi Feng, Lizhe Wang. Fractal Characteristic Analysis of Urban Land-Cover Spatial Patterns with Spatiotemporal Remote Sensing Images in Shenzhen City (1988-2015). Remote Sensing. 2021. Vol. 13. Iss. 22. N 4640. DOI: 10.3390/rs13224640
- Lei Gui, Kunlong Yin, Thomas Glade. Landslide displacement analysis based on fractal theory, in Wanzhou District, Three Gorges Reservoir, China. Geomatics, Natural Hazards and Risk. 2016. Vol. 7. Iss. 5, p. 1707-1725. DOI: 10.1080/19475705.2015.1137241
- Ting-yu Zhang, Ling Han, Heng Zhang et al. GIS-based landslide susceptibility mapping using hybrid integration approaches of fractal dimension with index of entropy and support vector machine. Journal of Mountain Science. 2019. Vol. 16. Iss. 6, p. 1275-1288. DOI: 10.1007/s11629-018-5337-z
- Wei Feng, Yaming Tang, Bo Hong. Landslide Hazard Assessment Methods along Fault Zones Based on Multiple Working Conditions: A Case Study of the Lixian–Luojiabu Fault Zone in Gansu Province (China). Sustainability. 2022. Vol. 14. Iss. 13. N 8098. DOI: 10.3390/su14138098
- Xiaolong Deng, Guangji Sun, Naiwu He, Yonghua Yu. Landslide susceptibility mapping with the integration of information theory, fractal theory, and statistical analyses at a regional scale: a case study of Altay Prefecture, China. Environmental Earth Sciences. 2022. Vol. 81. Iss. 13. N 346. DOI: 10.1007/s12665-022-10470-1
- Hu Q., Zhou Y., Wang S.X. et al. Fractal-based spatial distribution analysis of geological hazards and measurement of spatial association with hazard-related predisposing factors. The International Archives of the Photogrammetry, Remote Sensing and Spatial Information Sciences. 2020. Vol. XLII-3/W10, p. 125-131. DOI: 10.5194/isprs-archives-XLII-3-W10-125-2020
- Changjiang Li, Tuhua Ma, Leling Sun et al. Application and verification of a fractal approach to landslide susceptibility mapping. Natural Hazards. 2012. Vol. 61. Iss. 1, p. 169-185. DOI: 10.1007/s11069-011-9804-x
- Ni Zhihui, Wu Lichun, Wang Ming-hui et al. The Fractal Dimension of River Length Based on the Observed Data. Journal of Applied Mathematics. 2013. Vol. 2013. N 327297. DOI: 10.1155/2013/327297
- Nikhil Prakash, Andrea Manconi, Simon Loew. A new strategy to map landslides with a generalized convolutional neural network. Scientific Reports. 2021. Vol. 11. N 9722. DOI: 10.1038/s41598-021-89015-8
- Gerzsenyi D., Albert G. Landslide inventory validation and susceptibility mapping in the Gerecse Hills, Hungary. Geo-spatial Information Science. 2021. Vol. 24. Iss. 3, p. 498-508. DOI: 10.1080/10095020.2020.1870872
- Su Z., Chow J.K., Tan P.S. et al. Deep convolutional neural network–based pixel-wise landslide inventory mapping. Landslides. 2021. Vol. 18. Iss. 4, p. 1421-1443. DOI: 10.1007/s10346-020-01557-6
- Pospehov G.B., Savón Y., Delgado R. et al. Inventory of Landslides Triggered by Hurricane Matthews in Guantánamo, Cuba. Geography, Environment, Sustainability. 2023. Vol. 16. N 1, p. 55-63. DOI: 10.24057/2071-9388-2022-133
- Pourghasemi H.R., Yansari Z.T., Panagos P., Pradhan B. Analysis and evaluation of landslide susceptibility: a review on articles published during 2005-2016 (periods of 2005-2012 and 2013-2016). Arabian Journal of Geosciences. 2018. Vol. 11. Iss. 9. N 193. DOI: 10.1007/s12517-018-3531-5
- Swets J.A. Measuring the Accuracy of Diagnostic Systems. Science. 1988. Vol. 240. Iss. 4857, p. 1285-1293. DOI: 10.1126/science.3287615
- Šimundić A.-M. Measures of Diagnostic Accuracy: Basic Definitions. The Journal of the International Federation of Clinical Chemistry and Laboratory Medicine. 2009. Vol. 19. Iss. 4, p. 203-211.
- Haijun Qiu, Yaru Zhu, Wenqi Zhou et al. Influence of DEM resolution on landslide simulation performance based on the Scoops3D model. Geomatics, Natural Hazards and Risk. 2022. Vol. 13. Iss. 1, p. 1663-1681. DOI: 10.1080/19475705.2022.2097451
- Sarma C.P., Dey A., Krishna A.M. Influence of digital elevation models on the simulation of rainfall-induced landslides in the hillslopes of Guwahati, India. Engineering Geology. 2020. Vol. 268. N 105523. DOI: 10.1016/j.enggeo.2020.105523
- Park D.W., Nikhil N.V., Lee S.R. Landslide and debris flow susceptibility zonation using TRIGRS for the 2011 Seoul landslide event. Natural Hazards and Earth System Sciences. 2013. Vol. 13. Iss. 11, p. 2833-2849. DOI: 10.5194/nhess-13-2833-2013
- Tran T.V., Alvioli M., Lee G., An H.U. Three-dimensional, time-dependent modeling of rainfall-induced landslides over a digital landscape: a case study. Landslides. 2018. Vol. 15. Iss. 6, p. 1071-1084. DOI: 10.1007/s10346-017-0931-7