Study on the thin layer drying and diffusion mechanism of low rank coal in Inner Mongolia and Yunnan
- 1 — Master, Master of Mineral Processing Engineering China University of Mining and Technology School of Chemical Engineering ▪ Orcid
- 2 — Ph.D., Dr.Sci. PhD Candidate in Mineral Processing Engineering China University of Mining and Technology School of Chemical Engineering ▪ Elibrary
- 3 — Ph.D., Dr.Sci. Associate Professor Key Laboratory of Coal Processing and Efficient Clean Utilization of Ministry of Education, China University of Mining and Technology ▪ Orcid
- 4 — Ph.D., Dr.Sci. Professor Key Laboratory of Coal Processing and Efficient Clean Utilization of Ministry of Education, China University of Mining and Technology ▪ Orcid
- 5 — Ph.D., Dr.Sci. Associate Professor Key Laboratory of Coal Processing and Efficient Clean Utilization of Ministry of Education, China University of Mining and Technology ▪ Orcid
Abstract
Coal is one of the world's most important energy substances. China is rich in coal resources, accounting for more than 90 % of all ascertained fossil energy reserves. The consumption share of coal energy reaches 56.5 % in 2021. Due to the high moisture content of low-rank coal, it is easy to cause equipment blockage in the dry sorting process. This paper considers low-rank coal coming from Inner Mongolia (NM samples) and Yunnan (YN samples). The weight loss performance of the samples was analyzed using thermogravimetric experiments to determine the appropriate temperature for drying experiments. Thin-layer drying experiments were carried out at different temperature conditions. The drying characteristics of low-rank coal were that the higher the drying temperature, the shorter the drying completion time; the smaller the particle size, the shorter the drying completion time. The effective moisture diffusion coefficient was fitted using the Arrhenius equation. The effective water diffusion coefficient of NM samples was 5.07·10–11 - 9.58·10–11 m2/s. The effective water diffusion coefficients of the three different particle sizes of YN samples were 1.89·10–11 - 4.92·10–11 (–1 mm), 1.38·10–10 - 4.13·10–10 (1-3 mm), 5.26·10–10 - 1.49·10–9 (3-6 mm). The activation energy of Inner Mongolia lignite was 10.97 kJ/mol (–1 mm). The activation energies of Yunnan lignite with different particle sizes were 17.97 kJ/mol (–1 mm), 33.52 kJ/mol (1-3 mm), and 38.64 kJ/mol (3-6 mm). The drying process was simulated using empirical and semi-empirical formulas. The optimal model for Inner Mongolia samples was the Two-term diffusion model, and Yunnan samples were the Hii equation was used.
The research work is financially supported by China National Funds for Distinguished Young Scientists (N 52125403), Natural Science Foundation of Jiangsu Province (N BK20200651), National Natural Science Foundation of China (N 52104276, N 52261135540, N 52220105008), International Postdoctoral Exchange Fellowship Program (N PC2021086), The Graduate Innovation Program of China University of Mining and Technology (N 2022WLJCRCZL057), The Postgraduate Research and Practice Innovation Program of Jiangsu Province (N SJCX22_1149).
Introduction
Fossil energy is the fundamental material for economic and social development [1]. China is relatively abundant in coal resources, more than 90 % of the ascertained reserves of all fossil energy sources. The share of low-quality coal such as lignite occupies is about 40 % [2, 3]. The low-rank coal has characteristics of a low degree of coalification, high moisture content, abundant oxygen-containing functional groups, and easy weathering and spontaneous combustion have seriously hindered the development and utilization of low-rank coal powder [4]. The high moisture content not only limits the calorific value of the combustion of low-rank coal but also increases the transportation cost. In addition, low-rank coal below 6 mm is easy to cause equipment blockage in the process of dry coal preparation, which has become a technical problem in dry coal preparation [5]. Thus, the dewatering of low-rank coal is of great strategic importance [6].
Yong Jin et al. [7] research found that flow criteria showed that flowability decreased with increasing moisture content. The flowability and packing properties were different both above and below the critical moisture content. Xian Wu et al. [8] learned through low-temperature drying experiments that there is a time lag between volume shrinkage and water loss, and there are differences in their amounts. Rongtang Liu et al. [9] found by drying experiments of Yimin lignite at different temperatures that only H2O and CO2 are produced at low temperatures. Combustible gases, including CO and chemical gases, can be produced when the drying temperature exceeds 250 °C. B.A.Fu and M.Q.Chen [10] experimentally investigated the kinetics of thin lignite layers during forced convective drying of hot air. Experimental results show that the drying process of lignite presented a combination of the short warm-up period, the first falling rate period and the second falling rate period. H.Zhou et al. [11] investigated the effect of moisture content on high-pressure pulverized lignite dense-phase pneumatic conveying. When interparticle cohesion is strong, particles suffer from severe agglomeration problems, which make the resistance forces increase, leading to poor fluidization or even complete de-fluidization when particles are fluidized. P.Celen et al. [12] dried Turkish lignite using superheated steam and hot air at a temperature of 117 °C. The experiments showed that it took less time to heat the lignite samples with superheated steam compared to hot air. B.A.Fu et al. [13] studied the heat transfer in thin layers of lignite during convective drying with hot air. The effects of hot air temperature and velocity on the temperature of the thin layer were obtained.
In the existing studies, there is a lack of research on the drying mechanism and factor evaluation of low-rank coal below 6 mm. In this paper, the effects of temperature, particle size, organic composition and moisture content on the drying characteristics of low-rank coal will be studied, and the influence mechanism of different factors on the drying process will be analyzed by the kinetic analysis method. It provides data and practical guidance to solve the technical problems of low-rank coal drying that is difficult to screen below 6 mm [14].
Methods
To solve the above technical problems, this paper will use low-grade coal from Zhaotong, Yunnan and Shengli, Inner Mongolia, China to carry out drying experiments. We crushed and screened low-rank coal in Yunnan, and selected samples with particle sizes of –1, 1-3, and 3-6 mm for experiments. All samples with a particle size of –1mm were selected for experiments in Inner Mongolia low-grade coal. To understand the basic physical parameters and characteristics of the sample, the experimental samples were subjected to industrial and elemental analysis using the TGA701 automatic industrial analyzer produced by Deco in the United States and the Elementar Vario MACRO cube elemental analyzer produced by Elementar in Germany.
Before the drying experiment, a thermogravimetric analysis experiment is performed on the sample to determine the appropriate drying temperature for the sample. Thermogravimetric experiments were performed using a TG thermogravimetric (thermal) differential analyzer of NETZSCH, Germany, in this study. About 12 mg of the sample was weighed at a time, loaded into an empty crucible, and purged with air at a flow rate of 50 ml/min. The temperature rise was controlled at a rate of 10 °C/min and the absolute temperature was controlled at 800 °C.
In the isothermal thin-layer drying test a custom-made 27 x 20 x 2 cm aluminum tray was used to hold the samples. The samples were dried using an electric blast oven of model 101A-1ET produced by Shanghai Experimental Instrument Factory Co. Measurements were performed with the aid of an electronic balance, BSA 224S, manufactured by the Sartorius, Germany, accurate to 0.0001 g. To reduce test errors, cover the tray with tin foil to avoid extreme temperatures that cause low-rank coal to adhere or organic matter to corrode the tray. The sample on tin foil was placed in a tray, spread out in a thin layer and put place in a constant temperature drying box for drying. The drying time and the change in the quality of the sample were recorded until the sample is dried to a constant weight. The samples were dried at a drying wind speed of 0.6 m/s. A 10 g sample was taken for each test and dried to a constant weight. It was required to observe the change in the organic composition of the sample before and after drying. In this paper, infrared testing will be used to identify functional groups of the sample [15]. The dry base moisture content and drying speed for each statistical time are calculated and the drying curve is plotted [16, 17]:
- dry base moisture content
- drying speed
where m is the mass of the sample for each test, g; n is the mass of the sample when dried to constant weight, g.
Porous media particles were mainly in the reduced drying stage during the skeletal bony thin layer of the isothermal drying process. The kinetic energy of water molecules was provided by the temperature gradient. The concentration gradient was the main driving force in the migration process of water molecules. The concentration of a substance depended on the time during the diffusion. Therefore, the drying process of low-rank coal can be described by Fick's second law [18-21]
where Mt is the water content of the test sample at time t, g/g; Deff is the effective moisture diffusion coefficient, m2/s.
A second-order approximation to the Fick second diffusion equation with an analytical solution was used to process the data [22, 23]
where L is the thickness of the thin layer, into which the sample is laid flat in the tray, L = 0.002 m; MR is the mass fraction of water content, %.
The mass fraction of water content can be calculated by the following formula [24]:
where M0 is the initial moisture content, %; Me is the water content at equilibrium, %.
Me is negligible compared to M0. The above equation (2) can be simplified to [25, 26]:
The effective moisture diffusion coefficient of porous particles is related to the material composition of the particles, moisture, and the nature of the material itself. Its relationship with temperature obeys the Arrhenius equation [27]:
Taking the logarithm of both sides of the above equation yields [26]:
where D0 determined by the material, m2/s; Ea is the apparent activation energy, J/mol; R is the molar gas constant, J/(mol/k); T is the temperature of the drying medium, K.
In the field of drying characteristics, researchers generally believe that drying is an unsteady process of heat and mass transfer and heat and mass coupling, so they often use model-fitting methods to assist the research [28]. For low-rank coal drying, most of them are currently used in the theory and model of high reliability in the drying fields of food and materials [29, 30]. In this study, 16 classical drying models that are highly used in thin-layer drying research will be used for fitting, including theoretical models, empirical models, semi-empirical models, etc. The correlation coefficient is used as an evaluation index in model reliability discrimination to evaluate the fitting effect of different models. The closer the correlation coefficient R2 is to 1, the better the fitting effect [31]:
where yi is the experimental value; Yi is the theoretically calculated value of the fitted curve, and n represents the number of experimental values.
In this section, the 16 theoretical, empirical and semi-empirical drying models used in the fitting simulation are shown in Table 1. Among them, the theoretical model is derived from the drying-related theory (including the differential equation of moisture diffusion, thermal conductivity equation, etc.), while the semi-empirical model is established by combining the kinetic experimental data with high precision, and the empirical model constructed based on the experimental data can accurately describe the relationship between the moisture content of the material and the drying time during the experiment [32].
At present, researchers have carried out a lot of research work in low-rank coal drying fitting simulation, and the results show that the theoretical model is less applicable in low-order coal drying, and the applicability of empirical and semi-empirical models is stronger. However, empirical or semi-empirical models cannot theoretically analyze the mechanism of mass and heat transfer in the drying process. Therefore, this paper prefers the theoretical model as the best-fitting model and then reveals the drying mechanism from the basic theory.
Table 1
Drying mathematical models
|
Types |
Name |
Finder |
Model formulas |
|
Theoretical |
Single diffusion |
Henderson and Pabis |
формула
|
|
Two-term diffusion |
Sharaf-Eldeen |
формула
|
|
|
Three-term diffusion |
Karathanos |
формула
|
|
|
Semi-empirical equation |
Lemus |
Lemus |
формула
|
|
Lewis |
Lewis |
формула
|
|
|
Logarithmic |
Togrul and Pehilvan |
формула
|
|
|
Page |
Page |
формула
|
|
|
Amendments PageⅠ |
Overhults |
формула
|
|
|
Amendments PageⅡ |
Wang |
формула
|
|
|
Hii |
Hii |
формула
|
|
|
Approximate diffusion |
Yaldiz |
формула
|
|
|
Vema |
Vema |
формула
|
|
|
Empirical |
Chandra |
Chandra |
формула
|
|
Midilli |
Midilli |
формула
|
|
|
Thompson |
Thompson |
формула
|
|
|
Wang |
Wang |
формула
|
Results and discussion
The results in Table 2 are the physical property test results of Inner Mongolia and Yunnan samples. The moisture content of the samples from Inner Mongolia and Yunnan was 41.90 and 21.61 %, respectively. In addition, the carbon content of the Inner Mongolia sample was significantly higher than that of the Yunnan sample, which had more organic elements. It shows that the Yunnan sample has a lower degree of coalification and more organic composition.
Table 2
Industry and elemental analysis of Lignite coal in Inner Mongolia, %
|
Sample |
Industrial analysis |
Elemental analysis |
||||||||
|
Mad |
Ad |
Vad |
Aad |
Fcad |
Cdaf |
Hdaf |
Odaf |
Ndaf |
Sdaf |
|
|
NM |
41.90 |
32.11 |
37.55 |
27.27 |
20.12 |
56.41 |
4.56 |
37.44 |
0.83 |
0.76 |
|
YN |
21.62 |
11.49 |
26.74 |
7.63 |
32.01 |
40.13 |
3.15 |
57.80 |
1.35 |
1.57 |
Note. Mad, Ad, Vad, Aad, and Fcad refer to the moisture, volatile, fixed carbon and ash content on a received dried basis; Hdaf, Ndaf, Odaf and Sdaf refer to the element content on a dry ash-free basis.
The differential thermogravimetric curves (DTG) and thermogravimetric curves (TG) of the samples fitted from the thermogravimetric experimental data were shown in Fig.1. TG and DTG curves of YN and NM samples could be divided into three stages. Among them, the water loss stages of NM samples were: 75-200 °C. The weight loss phase with the organic matter was 500-750 °C. The weight loss stage of spontaneous combustion was after 750 °C. The moisture weight-loss stage of YN samples was 85-220 °C. The weight loss phase with the organic matter was 450-750 °C and the weight loss phase with spontaneous combustion was after 750 °C. This was because evaporation of free and bound water in coal can be completed at 220 °C, most of this water evaporates at 100 °C. With a continued increase of temperature, volatilization of the organic matter in the coal occurs at 250 °C. Even the coal itself undergoes spontaneous combustion at 750 °C [33].
As shown in Fig.2, the experimental results of NM samples showed that the drying time of NM samples at 180 °C was 6 min; the drying time at 160 °C for 7 min; NM samples were dried at 140 °C for 9 min; the drying time at a temperature below 140 °C is more than 10 min. This was because the higher the temperature of the hot air, the higher the temperature of the sample, and the greater the kinetic energy of the water molecules inside the particles, which accelerates the water diffusion process. At the same time, the evaporation rate of water on the surface of the particles increases, which increases the concentration gradient between the surface and the internal water of the particles, since the liquid water migrates to the surface at a faster rate.
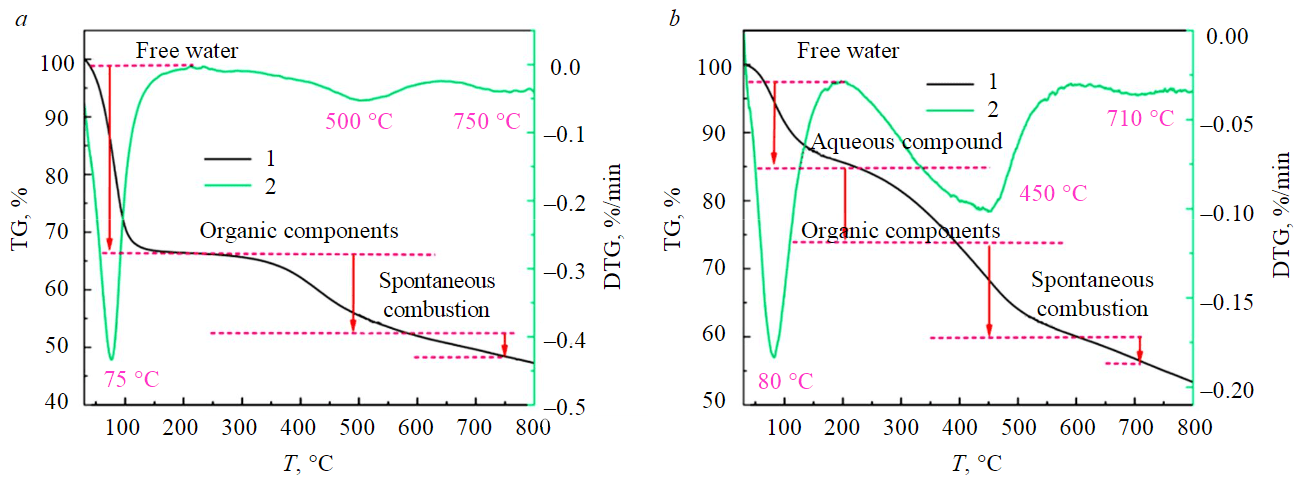
Fig.1. The thermogravimetric curves of NM (a) and YN (b) samples
1 – TG; 2 – DTG
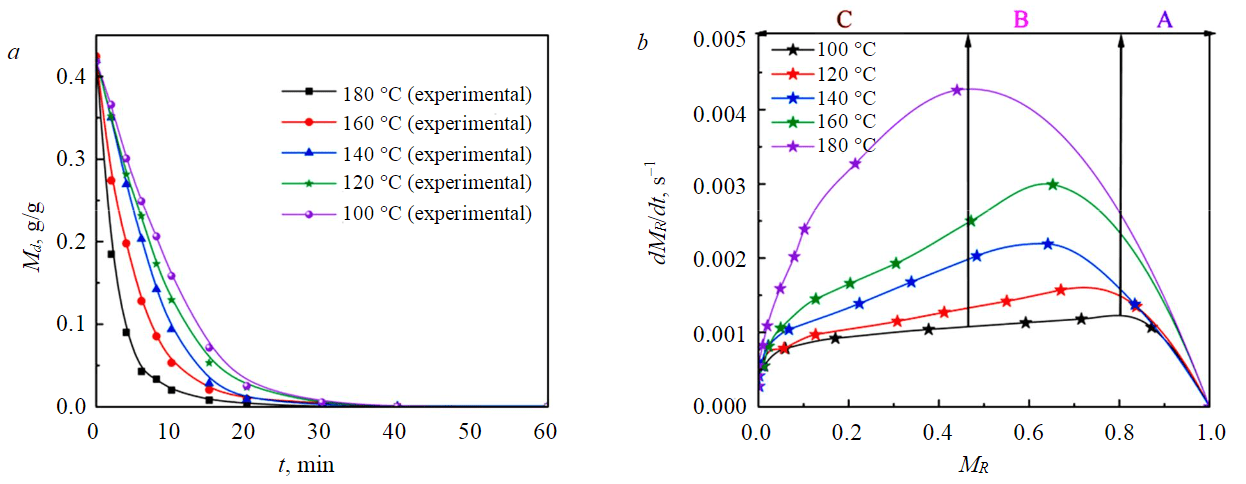
Fig.2. Drying (а) and drying rate (b) curves of –1 mm NM samples at different drying temperatures
When the drying temperature exceeds 160 °C, the effect of increasing the drying temperature on the drying effect was less than that of increasing the temperature below 160 °C. In addition, the higher the drying temperature, the greater the maximum drying rate, and the longer time in the slow-down drying stage.
At lower temperatures, the presence of a constant speed drying period was more pronounced. This was because the huge heat brought by high temperature makes free water evaporate quickly in a short time, and it takes a certain amount of time to absorb heat when drying at low temperatures, so the free water evaporation rate was in a more balanced state [34].
As shown in Fig.3, when the drying temperature is above 140 °C, the drying completion time of YN (–1 mm) samples is about 15 min. When the drying temperature is below 140 °C, the drying completion time of the YN (–1 mm) sample is about 20 min. When the organic composition is high, it will reduce the overall drying efficiency of the sample. When the temperature is less than 140 °C, the difference in the drying process of YN samples before drying is small. When the temperature exceeds 140 °C, the gap in the drying process in the first ten minutes increases. It shows that the organic components begin to significantly affect the drying process when the drying temperature exceeds 140 °C.
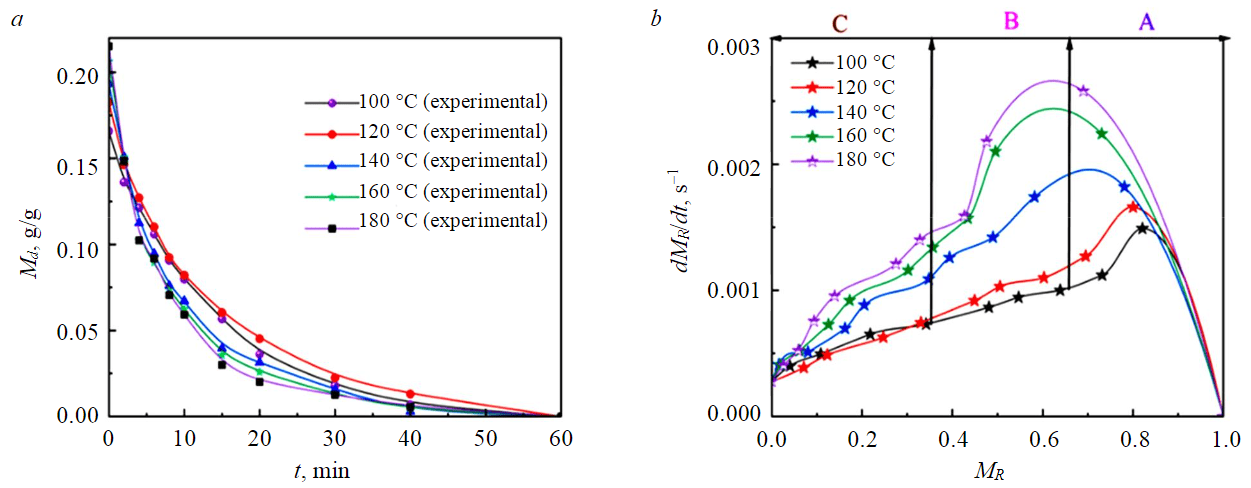
Fig.3. Drying (а) and drying rate (b) curves of –1 mm YN samples at different drying temperatures
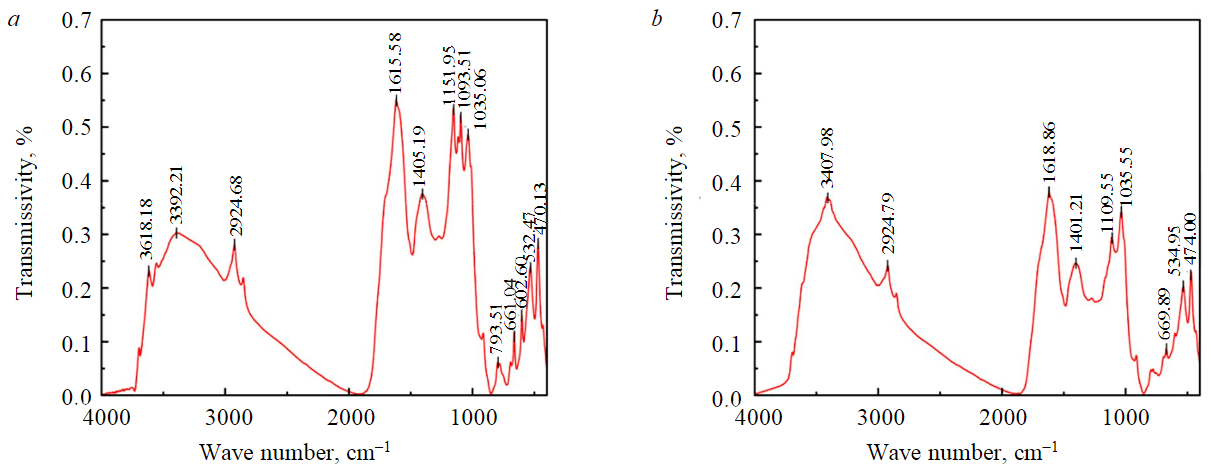
Fig.4. Drying and drying rate curves of YN samples is: before (а) and after (b) drying
In the drying rate curves of different temperatures of YN samples, there are only ramp-up and slow-down stages. The increase speed phase can be thought of as a period in which the initial speed quickly reaches the highest rate. This was because initially, there was a large temperature difference between the sample and the dry hot air. As drying progresses, the temperature difference between the sample temperature and the drying hot air becomes smaller and smaller, and the efficiency of heat transfer between the hot air to the inside of the material layer and the particle gradually decreases. At this time, the water content of the sample was also rapidly reduced due to the rapid evaporation of free water, and the remaining water to be evaporated was considered the internal water of the sample particles. This moisture must first be separated from the internal matter of the particles by heat and then transported to the surface of the particles. The descending drying stage in Fig.3, b illustrates the increase in mass transfer heat transfer resistance during the evaporation of combined water.
In the experimental results, the equilibrium moisture content difference was between 3-6 % when dried at different temperatures for 60 min. This was because the YN sample contains higher S, N and O elements and more organic matter, so the higher the drying temperature, the more volatilization of the components in the YN sample, and the more mass was lost. To demonstrate this, infrared analysis was performed on YN samples before and after drying (Fig.4).
Infrared analysis showed that the sample was rich in organic functional groups such as OH,–C–O–, –C–H, –S–O–, –N=O before drying. However, after drying, organic functional groups such as OH–, C–O, C–H, S–O, N=0 are greatly reduced or even disappear. It shows that the organic components will not only reduce the drying efficiency, but also increase the error of the experiment due to thermal decomposition and volatilization.
The experimental results of different particle sizes show that the larger the particles, the slower the drying process. At the same time, when the drying temperature was lower than 140 °C, the drying completion time of –1 mm samples was significantly smaller than that of 1-3 (Fig.5) and 3-6 mm (Fig.6) samples, the difference in drying completion time between 1-3 and 3-6 mm samples was small. When the drying temperature was greater than 140 °C, the drying completion time of –1 mm samples was significantly faster than 1-3 mm, and the drying end time of 1-3 mm samples was significantly faster than 3-6 mm. This was because the smaller the particles, the easier it was for water molecules to absorb heat and evaporate. In the medium and low-temperature drying process, the driving force of water molecules was mainly determined by the concentration gradient, and the diffusion mechanism plays a leading role. When the drying temperature was higher, the temperature field could provide greater kinetic energy for water molecule migration, and the smaller the particle size, the faster the water evaporates and spreads.
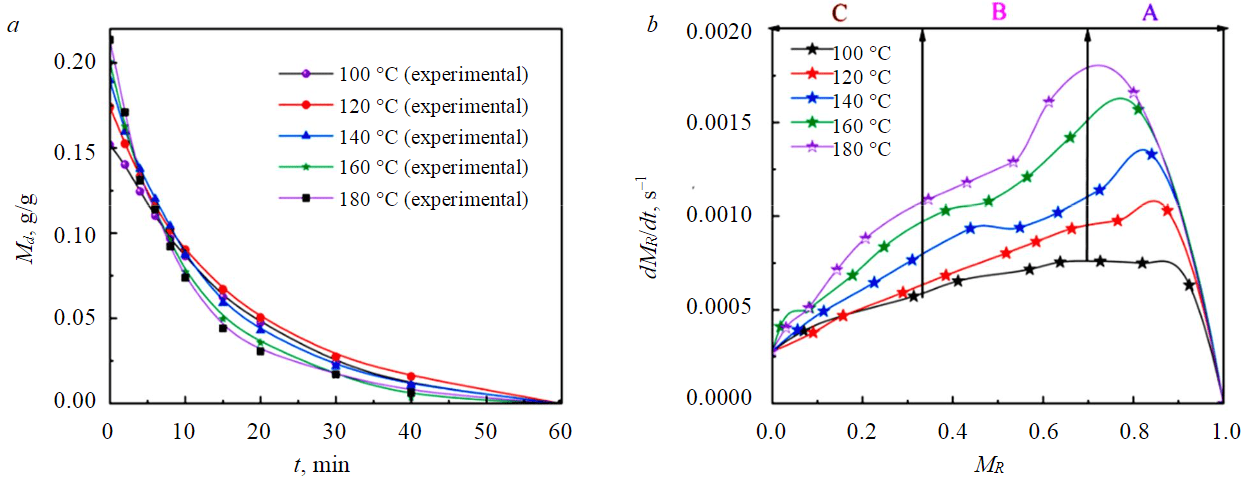
Fig.5. Drying (a) and drying rate (b) curve of 1-3 mm YN samples at different drying temperatures
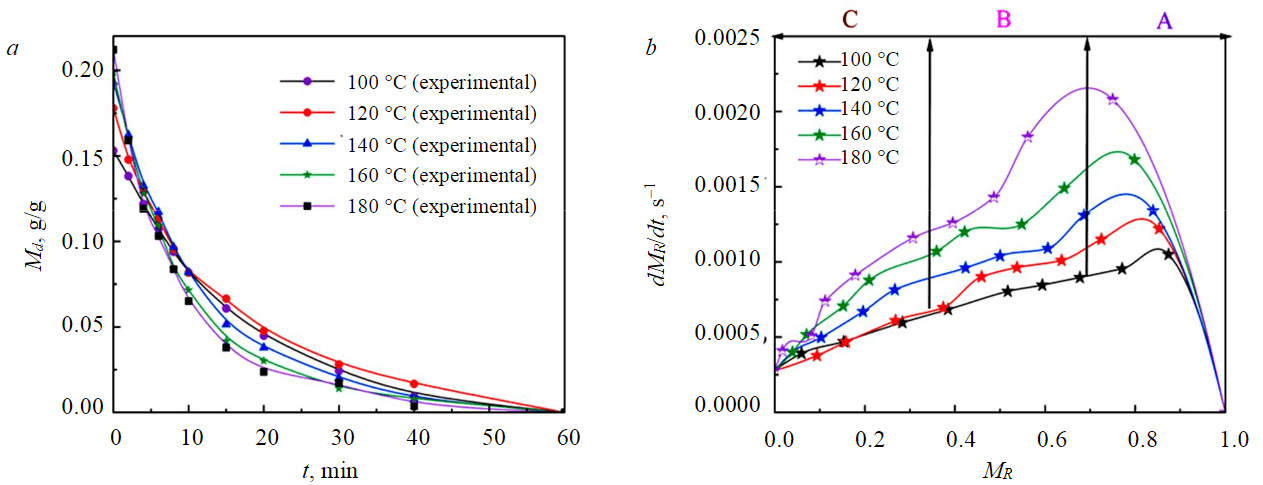
Fig.6. Drying (a) and drying rate (b) curve of 3-6 mm YN samples at different drying temperatures
To quantify the ease of drying completion of each sample, the results of the drying experiments were analyzed kinetically. The results of isothermal drying experiments were organized according to equation (1). The curve of low-order coal lnMR at the corresponding temperature versus time t was obtained. The parameter Deff at the corresponding temperature could be found from the slope of the curve (Table 3).
Table 3
Effective moisture diffusion coefficient Deff at different drying temperatures, m2/s
|
Sample |
Drying temperature, °С |
||||
|
100 |
120 |
140 |
160 |
180 |
|
|
NM –1 mm |
5.07∙10–11 |
6.19∙10–11 |
7.56∙10–11 |
8.14∙10–11 |
9.58∙10–11 |
|
R2 |
0.98647 |
0.98741 |
0.99101 |
0.99706 |
0.95812 |
|
YN –1 mm |
1.89∙10–11 |
2.11∙10–11 |
2.97∙10–11 |
4.49∙10–11 |
4.92∙10–11 |
|
R2 |
0.99373 |
0.97746 |
0.96129 |
0.96738 |
0.98684 |
|
YN 1-3 mm |
1.38∙10–10 |
1.76∙10–10 |
2.53∙10–10 |
3.08∙10–10 |
4.13∙10–10 |
|
R2 |
0.99324 |
0.97819 |
0.99200 |
0.98756 |
0.99626 |
|
YN 3-6 mm |
5.26∙10–10 |
6.59∙10–10 |
8.92∙10–10 |
1.13∙10–9 |
1.49∙10–9 |
|
R2 |
0.96331 |
0.98591 |
0.99429 |
0.98304 |
0.98968 |
For the same millimeters particle size, the effective water diffusion coefficient of NM samples was 5.07·10–11-9.58·10–11 m2/s. The effective water diffusion coefficient of YN samples was small, 1.89·10–11-4.92·10–11 m2/s. Comparative analysis shows that the effective moisture diffusion coefficient increases with the increase in drying temperature. This is because, the higher the temperature, the greater the kinetic energy of water molecules, and the stronger the power to diffuse outward. At the same time, the larger the particle size, the greater the effective water diffusion coefficient, the effective water diffusion coefficient of the YN (1-3 mm) sample was 1.38·10–10-4.13·10–10 m2/s, and the effective water diffusion coefficient of YN (3-6 mm) sample was 5.26·10–10-1.49·10–9 m2/s. This was because particle size was an important positive correlation parameter affecting the effective diffusion coefficient of moisture in the fitted equation. In addition, in the process of diffusion of water molecules, the larger the particle size, the more channels the water molecules diffuse to the outside world, and the more water evaporates per unit of time. However, the effective water diffusion coefficient per unit particle size will decrease, because the larger the particle size, the longer the path of water diffusion to the outside world, which will reduce the diffusion efficiency of water to the outside.
The apparent activation energy was an important parameter of drying kinetics, reflecting the difficulty of drying. This section analyzes the drying characteristics of low-rank coals by comparing the apparent activation energy of low-rank coals with different moisture content and particle sizes. The apparent activation energy was calculated by fitting the effective water diffusion coefficient, and the apparent activation energy of each sample was shown in Table 4 in detail. The apparent activation energy of NM was 10.97 kJ/mol, which was lower than YN's 17.97 kJ/mol. The apparent activation energy of YN samples was positively correlated with the particle size, and the activation energy of particles with particle sizes of 1-3 and 3-6 mm was 18.95 and 20.28 kJ/mol, respectively. From the fitting results, it can be seen that the higher the water content of the sample, the lower the apparent activation energy. This was because the higher the moisture content, the stronger the driving force provided by the moisture concentration gradient, the less energy required for internal moisture to diffuse outward, and the lower the apparent activation energy. The larger the particle size, the greater the apparent activation energy, because the larger the particle size, the longer the path of moisture diffusion to the outside, the more energy required to use, and the larger the particle and the more heat required for the particle to heat up, the apparent activation energy of the sample will increase [35-39].
Table 4
Apparent activation energy values of coal samples
|
Sample |
Ea, kJ/mol |
Т, К |
Size, mm |
Md, % |
|
NM |
10.97 |
373θi453 |
–1 |
41.90 |
|
YN |
17.97 |
373i453 |
–1 |
21.36 |
|
YN |
18.95 |
373i453 |
1-3 |
21.36 |
|
YN |
20.28 |
373i453 |
3-6 |
21.36 |
The experimental data of each sample were fitted using the 16 equations in the table to obtain the optimal drying kinematic model for each sample (Table 5). Meanwhile, the best model for each sample was fitted for five different working conditions, and the test data for each working condition was obtained by averaging six sets of the same tests. The best model for NM samples below –1 mm was two diffusion models, and the best model for YN samples with different particle sizes was the Hii equation. The parameters of the fitting results are shown in Table 5.
The experiments showed a high correlation of fitting results with the experiments: for the YN samples the correlation R2 of –1 mm at 100, 120, 140, 160, 180 °C were 0.9984, 0.9994, 0.9987, 0.9976, 0.9971, respectively. The correlation R2 of 1-3 mm at 100, 120, 140, 160, 180 °C were 0.9989, 0.9993, 0.9976, 0.9991, 0.9982, respectively. The correlation R2 of 3-6 mm at 100, 120, 140, 160, 180 °C were 0.9989, 0.9993, 0.9976, 0.9991, 0.9982, respectively (Fig.7).
So, we could know that the two diffusion models were suitable for simulating samples with high moisture content. Hii models were suitable for simulating samples with low moisture content. A further step shows that the diffusion mechanism driven by concentration gradient plays a dominant role in samples with high water content. The two-dimensional diffusion model can well predict the isothermal thin-layer drying pattern of the high-water content samples. For samples with low water content, the concentration gradient was also one of the driving forces, but it was not the dominant role. Therefore, the diffusion model did not apply to samples with low water content.
Table 5
Fitting results of each sample
|
Samples |
Model |
Grain size, mm |
Temperature, °С |
R2 |
а1 |
а2 |
k1 |
k2 |
n |
|
YN |
Hii |
–1 |
100 |
0.9984 |
–0.2588 |
0.4186 |
0.1236 |
0.1075 |
0.8932 |
|
120 |
0.9994 |
0.0148 |
0.1699 |
10.6822 |
0.0793 |
0.9502 |
|||
|
140 |
0.9976 |
–1.0517 |
1.2452 |
0.6375 |
0.5431 |
0.5707 |
|||
|
160 |
0.9987 |
–0.2042 |
0.4004 |
0.3874 |
0.7343 |
0.4558 |
|||
|
180 |
0.9971 |
–0.1303 |
0.3414 |
0.7614 |
0.3398 |
0.6853 |
|||
|
YN |
Hii |
1-3 |
100 |
0.9989 |
–0.0061 |
0.1581 |
0.1257 |
0.0688 |
0.9843 |
|
120 |
0.9993 |
0.0078 |
0.1701 |
0.3591 |
0.0661 |
10.0437 |
|||
|
140 |
0.9976 |
–0.1059 |
0.2992 |
0.6649 |
0.2652 |
0.7599 |
|||
|
160 |
0.9991 |
–0.0857 |
0.2847 |
10.0299 |
0.3042 |
0.6759 |
|||
|
180 |
0.9982 |
0.0218 |
0.1903 |
20.972 |
0.1006 |
10.0741 |
|||
|
YN |
Hii |
3-6 mm |
100 |
0.9992 |
0.0594 |
0.0915 |
0.0949 |
0.0422 |
1.1440 |
|
120 |
0.9977 |
–3.1667 |
3.3309 |
0.3277 |
0.3126 |
0.7225 |
|||
|
140 |
0.9987 |
–0.0971 |
0.2748 |
0.3509 |
0.1531 |
0.8548 |
|||
|
160 |
0.9958 |
–0.1361 |
0.3264 |
0.9158 |
0.3228 |
0.6994 |
|||
|
180 |
0.9989 |
0.2184 |
–0.0048 |
0.1398 |
329.05 |
0.8481 |
|||
|
NM |
Two-term diffusion |
–1 |
100 |
0.9986 |
–5.8756 |
6.2918 |
0.1955 |
0.1855 |
– |
|
120 |
0.9994 |
–18.929 |
19.345 |
0.2087 |
0.2055 |
– |
|||
|
140 |
0.9976 |
–3.1762 |
30.5939 |
0.2474 |
0.2253 |
– |
|||
|
160 |
0.9966 |
–6.9891 |
7.4073 |
0.2595 |
0.2517 |
– |
|||
|
180 |
0.9994 |
0.3651 |
0.0582 |
0.4969 |
0.1226 |
– |
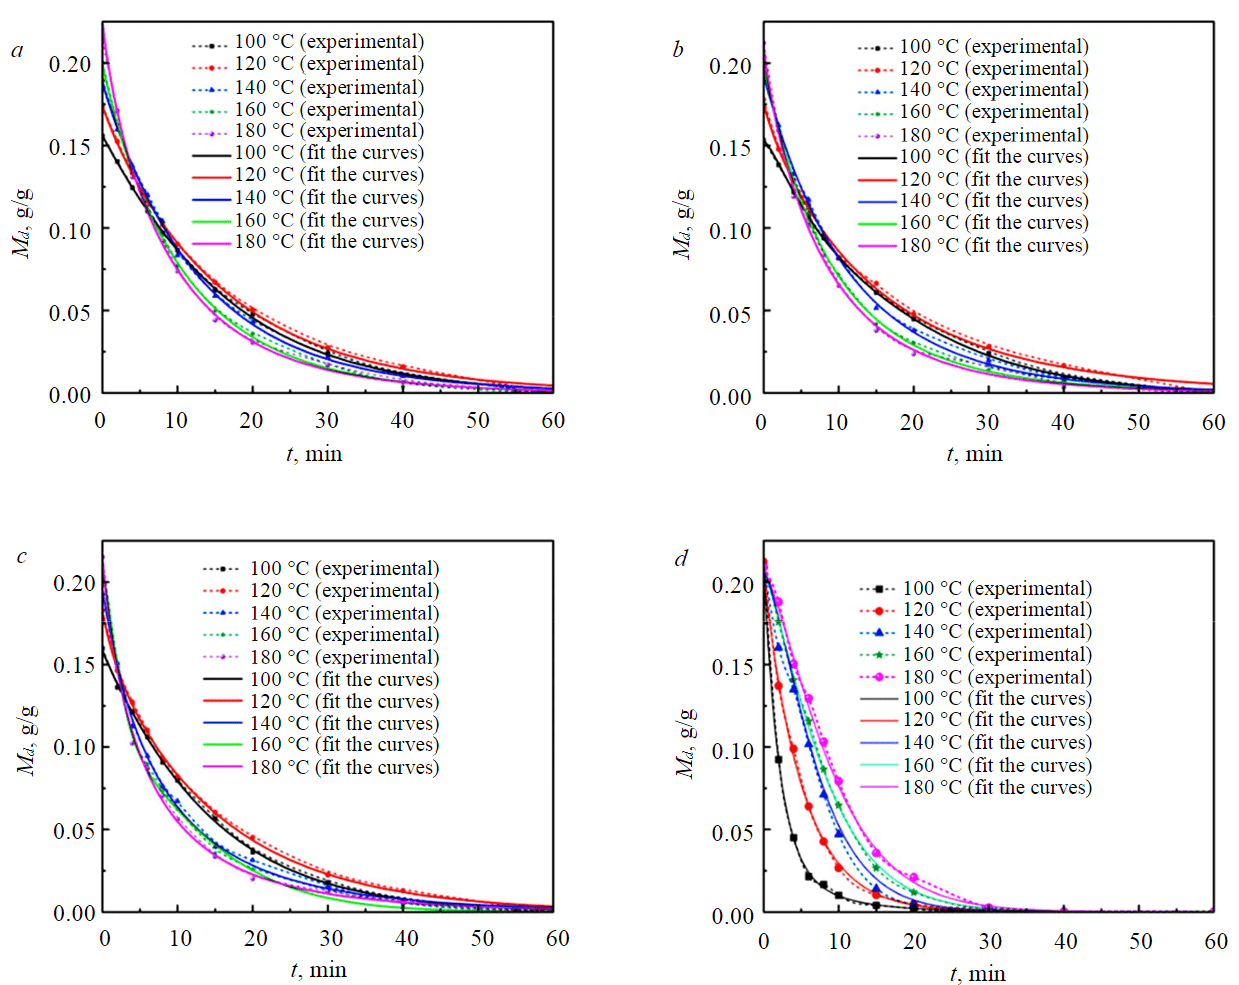
Fig.7. The fit of experimental results on samples at different drying temperatures: 3-6 mm YN samples (а); 1-3 mm YN samples (b); –1 mm YN samples (c); –1 mm NM samples (d)
Conclusions
In this article, thin-layer isothermal drying experiments were carried out on low-rank coal samples such as NM and YN, and the drying process and drying rate curves were drawn based on the data obtained by the experiments, and the effective water diffusion coefficient and apparent activation energy of each sample were calculated by combining the experimental data. Finally, the experimental data were fitted with 16 mathematical models of drying, and the best drying model for each sample was selected. The findings of this work show that:
- Moisture content and temperature are two of the most important factors affecting the drying process. For NM samples, when the temperature is less than 140°C, the drying rate curve has three stages: increasing rate, constant speed and decreasing speed drying. When the temperature is greater than 140 °C, the drying curve has only two stages: increasing speed and decreasing speed drying. For samples with low moisture content, three different particle sizes there are only two drying stages at 100-180 °C drying: increasing and decreasing. When the temperature exceeds 160 °C, increasing the temperature no longer significantly improves the drying efficiency of YN samples. When the temperature exceeds 140 °C, increasing the temperature no longer significantly improves the drying efficiency of NM samples. In addition, the smaller the particle size, the higher the drying efficiency, and increasing the temperature will amplify the influence of particle size on drying efficiency. Organic components also reduce drying efficiency and volatilize at high temperatures in the later stages of drying.
- The higher the moisture content of the sample, the greater the effective water diffusion coefficient. The larger the particle size, the greater the effective moisture coefficient and the smaller the effective moisture coefficient per unit diameter. The higher the temperature, the greater the effective moisture diffusion coefficient. At the same time, the apparent activation energy of samples with low moisture content is higher and increases with particle size. In addition, NM samples are suitable for a double-diffusion theoretical model, and three YN samples with different particle sizes fit the Hii equation.
- This can be known through the analysis of the influencing factors. The moisture content has the greatest influence on the drying process. The second factor is the temperature. When the temperature exceeds a certain range, the increase in temperature will not be obvious to the improvement of drying efficiency. Then, there is the particle size. In low-rank coals below 6mm, the drying effect of the –1 mm sample was the best. Finally, there are organic components, which not only reduce drying efficiency but also increase mass loss when volatilized.
In the next step, this study will further reveal the drying mechanism of low-rank coal with the help of numerical simulation methods, and analyze the mass and heat transfer mechanism of the drying process in the mesoscopic scale.
References
- Aleksandrova T., Nikolaeva N., Kuznetsov V. Thermodynamic and Experimental Substantiation of the Possibility of Formation and Extraction of Organometallic Compounds as Indicators of Deep Naphthogenesis. Energies. 2023. Vol. 16. Iss. 9. N 3862. DOI: 10.3390/en16093862
- Capellán-Pérez I., Mediavilla M., de Castro C. et al. Fossil fuel depletion and socio-economic scenarios: An integrated approach. Energy. 2014. Vol. 77, p. 641-666. DOI: 10.1016/j.energy.2014.09.063
- Shunxuan Hu, Junguo Li, Xin Yang et al. Improvement on slurry ability and combustion dynamics of low quality coals with ultra-high ash content. Chemical Engineering Research and Design. 2020. Vol. 156, p. 391-401. DOI: 10.1016/j.cherd.2020.02.011
- Aleksandrova T.N., Kuskov V.B., Afanasova A.V., Kuznetsov V.V. Improvement of the fine coking coal flotation technology. Obogashchenie Rud. 2021. N 3, p. 9-13 (in Russian). DOI: 10.17580/or.2021.03.02
- Chenyang Zhou, Xuchen Fan, Chenlong Duan, Yuemin Zhao. A method to improve fluidization quality in gas–solid fluidized bed for fine coal beneficiation. Particuology. 2019. Vol. 43, p. 181-192. DOI: 10.1016/j.partic.2017.12.012
- Daegi Kim, Seyong Park, Ki Young Park. Upgrading the fuel properties of sludge and low rank coal mixed fuel through hydrothermal carbonization. Energy. 2017. Vol. 141, p. 598-602. DOI: 10.1016/j.energy.2017.09.113
- Yong Jin, Haifeng Lu, Xiaolei Guo, Xin Gong. Effect of water addition on flow properties of lignite particles. Chemical Engineering Research and Design. 2018. Vol. 132, p. 1020-1029. DOI: 10.1016/j.cherd.2017.11.012
- Wu Xian, Dong Ziwen, Sun Lifeng, Jia Tinggui. Experimental Study of the Volume Drying Shrinkage Characteristics of Lignite under Low Temperatures. ACS Omega. 2022. Vol. 7. Iss. 12, p. 10029-10038. DOI: 10.1021/acsomega.1c05575
- Rongtang Liu, Ming Liu, Xiaoqu Han, Junjie Yan. Drying characteristics and kinetics analyses for Yimin lignite at various temperatures. Drying Technology. 2021. Vol. 39. Iss. 7, p. 912-924. DOI: 10.1080/07373937.2020.1729174
- Fu B.A., Chen M.Q. Thin-layer drying kinetics of lignite during hot air forced convection. Chemical Engineering Research and Design. 2015. Vol. 102, p. 416-428. DOI: 10.1016/j.cherd.2015.07.019
- Haijun Zhou, Yuanquan Xiong, Yu Pei. Effect of moisture content on dense-phase pneumatic conveying of pulverized lignite under high pressure. Powder Technology. 2016. Vol. 287, p. 355-363. DOI: 10.1016/j.powtec.2015.10.026
- Celen P., Erdem H.H. An experimental investigation of single lignite particle dried in superheated steam and hot air. International Journal of Coal Preparation and Utilization. 2018. Vol. 41. Iss. 12, p. 845-854. DOI: 10.1080/19392699.2018.1536047
- Fu B.A., Chen M.Q., Huang Y.W. Heat transfer characteristics on lignite thin-layer during hot air forced convective drying. Fuel. 2015. Vol. 154, p. 132-139. DOI: 10.1016/j.fuel.2015.03.075
- Hosseini T., Zhang L. Process modeling and techno-economic analysis of a solar thermal aided low-rank coal drying-pyrolysis process. Fuel Processing Technology. 2021. Vol. 220. N 106896. DOI: 10.1016/j.fuproc.2021.106896
- Jinzhan Huang, Zhiqiang Li, Biao Chen et al. Rapid detection of coal ash based on machine learning and X-ray fluorescence. Journal of Mining institute. 2022. Vol. 256, p. 663-676. DOI: 10.31897/PMI.2022.89
- Bojian Qi, Yong Yan, Wenbiao Zhang, Xueyao Wang. Measurement of biomass moisture content distribution in a fluidised bed dryer through electrostatic sensing and digital imaging. Powder Technology. 2021. Vol. 388, p. 380-392. DOI: 10.1016/j.powtec.2021.04.096
- Ji Hyeon Park, Jung Hae Park, Soo Chul Kim. A Study on Application of Enzyme Additives to Improve Drying Speed of Urushi Lacquer. Journal of the Korean Wood Science and Technology. 2020. Vol. 48. N 3, p. 326-344. DOI: 10.5658/WOOD.2020.48.3.326
- Huaigang Cheng, Lixiang Wu, Fangqin Cheng. Kinetics of static immersed leaching of low-grade sea-type evaporites based on theoretical and experimental investigation of unsteady-state mass transfer. Journal of Cleaner Production. 2020. Vol. 256. N 120501. DOI: 10.1016/j.jclepro.2020.120501
- Yuwei Wei, Xishan Zhu, Chenquan Deng et al. Study on cracking process of hot pressed tee based on Fick’s second law. Engineering Failure Analysis. 2022. Vol. 134. N 106014. DOI: 10.1016/j.engfailanal.2021.106014
- Lingbo Kong, Xing Yang, Zhihao Hou, Jixian Dong. Mathematical Modeling of Drying Kinetics for Pulp Sheet Based on Fick’s Second Law of Diffusion. Journal of Korea TAPPI. 2020. Vol. 52. N 2, p. 23-31. DOI: 10.7584/JKTAPPI.2020.04.52.2.23
- Cheak Theng Ee, Ching Lik Hii, Sze Pheng Ong et al. Convective Air Drying of Spondias Dulcis and Product Quality. International Journal of Food Engineering. 2019. Vol. 15. Iss. 3-4. N 20180228. DOI: 10.1515/ijfe-2018-0228
- Obradović B. Guidelines for general adsorption kinetics modeling. Hemijska industrija. 2020. Vol. 74. Iss. 1, p. 65-70. DOI: 10.2298/HEMIND200201006O
- Yousuf M. A second-order efficient L-stable numerical method for space fractional reaction–diffusion equations. International Journal of Computer Mathematics. 2018. Vol. 95. Iss. 6-7, p. 1408-1422. DOI: 10.1080/00207160.2018.1435865
- Pengbo Fu, Hao Yu, Qiqi Li et al. Cyclone rotational drying of lignite based on particle high-speed self-rotation: Lower carrier gas temperature and shorter residence time. Energy. 2022. Vol. 244. Part B. N 123005. DOI: 10.1016/j.energy.2021.123005
- Ying Xu, Jiming Wang, Guojie Zhang et al. Evaluation of hydrothermal treatment on physicochemical properties and re-adsorption behaviors of lignite. Energy. 2022. Vol. 244. Part A. N 122597. DOI: 10.1016/j.energy.2021.122597
- Crapse J., Pappireddi N., Gupta M. et al. Evaluating the Arrhenius equation for developmental processes. Molecular Systems Biology. 2021. Vol. 17. Iss. 8. N e9895. DOI: 10.15252/msb.20209895
- Jaeho Cha, Sungho Yoon. Determination of shift factor for long-term life prediction of carbon/fiber epoxy composites using the time-temperature superposition principle. Functional Composites and Structures. 2022. Vol. 4. Iss. 1. N 015003. DOI: 10.1088/2631-6331/ac529e
- Selimefendigil F., Coban S.O., Öztop H.F. An efficient method for optimizing the unsteady heat and mass transport features for convective drying of two porous moist objects in a channel. International Journal of Mechanical Sciences. 2021. Vol. 200. N 10644. DOI: 10.1016/j.ijmecsci.2021.106444
- Joardder M.U.H., Karim M.A. Development of a porosity prediction model based on shrinkage velocity and glass transition temperature. Drying Technology. 2019. Vol. 37. Iss. 15, p. 1988-2004. DOI: 10.1080/07373937.2018.1555540
- Ternes S., Börnhorst T., Schwenzer J.A. et al. Drying Dynamics of Solution-Processed Perovskite Thin-Film Photovoltaics: In Situ Characterization, Modeling, and Process Control. Advanced Energy Materials. 2019. Vol. 9. Iss. 39. N 1901581. DOI: 10.1002/aenm.201901581
- Chicco D., Tötsch N., Jurman G. The Matthews correlation coefficient (MCC) is more reliable than balanced accuracy, bookmaker informedness, and markedness in two-class confusion matrix evaluation. BioData Mining. 2021. Vol. 14. N 13. DOI: 10.1186/s13040-021-00244-z
- Jia-Qing Zhou, Hong-Bin Liu, Changdong Li. A semi-empirical model for water inflow into a tunnel in fractured-rock aquifers considering non-Darcian flow. Journal of Hydrology. 2021. Vol. 597. N 126149. DOI: 10.1016/j.jhydrol.2021.126149
- Xun Zhang, Bin Zeng, Bing Lu et al. Experimental research on spontaneous combustion of coal oxidized by ultraviolet photocatalysis. AIP Advances. 2022. Vol. 12. Iss. 8. N 085226. DOI: 10.1063/5.0098407
- Pengfei Zhao, Liping Zhong, Yuemin Zhao, Zhenfu Luo. Comparative studies on the effect of mineral matter on physico-chemical properties, inherent moisture and drying kinetics of Chinese lignite. Energy Conversion and Management. 2015. Vol. 93, p. 197-204. DOI: 10.1016/j.enconman.2015.01.020
- Jung J., Kobayashi C., Sugita Y. Optimal Temperature Evaluation in Molecular Dynamics Simulations with a Large Time Step. Journal of Chemical Theory and Computation. 2019. Vol. 15. Iss. 1, p. 84-94. DOI: 10.1021/acs.jctc.8b00874
- Meng Liu, Jian Li, Yufeng Duan. Effects of solvent thermal treatment on the functional groups transformation and pyrolysis kinetics of Indonesian lignite. Energy Conversion and Management. 2015. Vol. 103, p. 66-72. DOI: 10.1016/j.enconman.2015.06.047
- Liu Ming Qiang, Jian Zhong Liu, Yu Jie Yu et al. Investigation of Lignite Combustion Characteristics with Thermal Analysis. Advanced Materials Research. 2012. Vol. 614-615, p. 25-30. DOI: 10.4028/www.scientific.net/AMR.614-615.25
- Yanyan Shi, Shuyuan Li, Haoquan Hu. Studies on pyrolysis characteristic of lignite and properties of its pyrolysates. Journal of Analytical and Applied Pyrolysis. 2012. Vol. 95, p. 75-78. DOI: 10.1016/j.jaap.2012.01.008
- Lei Guo, Chenhui Liu, Srinivasakannan C., Gao Jiyun. Microwave upgradation of Yunnan lignite: dielectric properties, drying pattern and kinetics. Journal of Microwave Power and Electromagnetic Energy. 2021. Vol. 55. Iss. 3, p. 248-269. DOI: 10.1080/08327823.2021.1952834