
Evaluation of deformation characteristics of brittle rocks beyond the limit of strength in the mode of uniaxial servohydraulic loading

Abstract
One of the most reliable methods for assessing the physical and mechanical properties of rocks as a result of their destruction are laboratory tests using hard or servo-driven test presses. They allow to obtain reliable information about changes in these properties beyond the limit of compressive strength. The results of laboratory tests of rich sulfide ore samples are presented, which made it possible to obtain graphs of their extreme deformation. Both monolithic samples and samples with stress concentrators in the form of circular holes with a diameter of 3, 5 and 10 mm were tested. It was revealed that during the destruction of the samples, the modules of elasticity and deformation decrease by 1.5-2 times, and in the zone of residual strength – by 5-7 times.
None
Introduction
With an increase in the productivity of underground mining deposits development, in order to maintain the pace of production, it is necessary to open up new horizons, which are often deeper than existing ones. With an increase in the depth of development, the risks of complication of the geotechnical situation increase [1-3], which can manifest themselves in the form of increased rock pressure, including in a dynamic form [4-6]. For example, the depth of development of the Talnakh mines in some areas reaches more than 1000 m with a critical depth of rock-burst hazard of 700 m [7-9]. Accordingly, at such great depths and high stress values, the destruction of the marginal part is characteristic for the rock mass. It manifests itself potentially in a brittle form with the release of elastic energy in the form of a rock burst. Pillars become especially dangerous, since they take on an increased load from the overlying rock strata. In this case, shock-proof measures are used, the purpose of which is to form a local zone of compliance by inducing fracturing by a blasting method [10-12] or by gradual destruction of rocks caused by drilling a line of discharge wells [13, 14]. However, it is quite difficult to assess the change in the physical and mechanical properties of rocks in the resulting zones of compliance. Standard laboratory tests within the framework of GOST standards are aimed at studying the properties of only monolithic rocks, and the assessment of the rock mass disturbance by rating systems focuses more on natural fracturing [15-17]. One of the ways to estimate the change in the modulus of elasticity is to determine the velocity of propagation of longitudinal waves before/after the destruction of the rock mass [18, 19]. But the solution of such a problem may be complicated by the impossibility of elastic wave propagation through the destroyed areas of the rock mass.
With the widespread development of computer technologies, the use of mathematical modeling based on effective numerical methods of finite or discrete elements is prevalent [20-22]. The elastic-plastic models implemented in them make it possible to obtain information (with some assumptions) about the state of the rock mass (pillars) and the redistribution of stresses in it as a result of the destruction of the latter. However, reliable data on the properties of the material is needed to build adequate geomechanical models. So, for ideal elastic-plastic models, it is necessary to know the following parameters: adhesion and the angle of internal friction (or the limits of tensile and compressive strength), modulus of elasticity, Poisson's ratio. For geomechanical models with residual strength, it is necessary to have an idea of the residual strength of rocks. For example, when using the RS2 (Rocscience) program, when developing an elastic-plastic model taking into account the Coulomb – Mohr criterion with residual strength, data from the passport of the residual strength of rocks are required [23, 24]. The frequently used Hook – Brown strength criterion additionally requires workings mapping data to assess the disturbance of the rock mass [25-27]. Therefore, the necessary initial data can be obtained only as a result of laboratory tests and field studies.
It is possible to evaluate the process of rock destruction only when modeling loading close to real conditions. For this purpose, it is possible to conduct sample preparation of cubic or cylindrical shape samples, to test under uniaxial compression conditions in accordance with GOST 21153.2 “Rocks. Methods for determining the ultimate strength in uniaxial compression”. But in this case, the elastic energy accumulated by the press is released, which leads to the destruction of the sample with the fragments distribution. To avoid this, it is necessary to carry out tests on hard or servo-driven presses. In this case, it is possible to get a complete picture of the destruction of samples with the determination of the values of deformations beyond the strength limit of the rock. The methodological bases of such tests are presented in [28-30]. The presented methods have found their application for assessing the rock-burst hazard [31-33]. Such types of tests are very difficult to implement and require modern technological equipment.
A feature of testing on servo-driven presses is also the control of the growth rate of transverse deformations values, and, consequently, obtaining “loops” of decline and loading when leveling the deformation rate of the sample. However, this type of testing is laborious and time-consuming. Thus, in [30] it is indicated that when 70 % of the limit of strength is reached, it is necessary to control the loading by the values of transverse deformations, and the speed of loading by the press should ensure their growth rate of no more than 0.0001 mm/mm/s. A relatively easy-to-implement approach to assessing residual strength is presented in [34], which is more suitable for evaluating the rock mass of sides of open-pits than for underground mining conditions. This paper presents the results of tests for extreme deformation of rich sulfide ores of the Norilsk Industrial district to determine changes in deformation characteristics in the process of destruction. The absence of significant fracturing in the ore rock mass (Fig.1), combined with high hardness and a high brittleness coefficient (the ratio of the compressive strength to the tensile strength), ranging from 9-12 with low values of the compressive strength in the image, make this type of ore rock-burst hazardous.
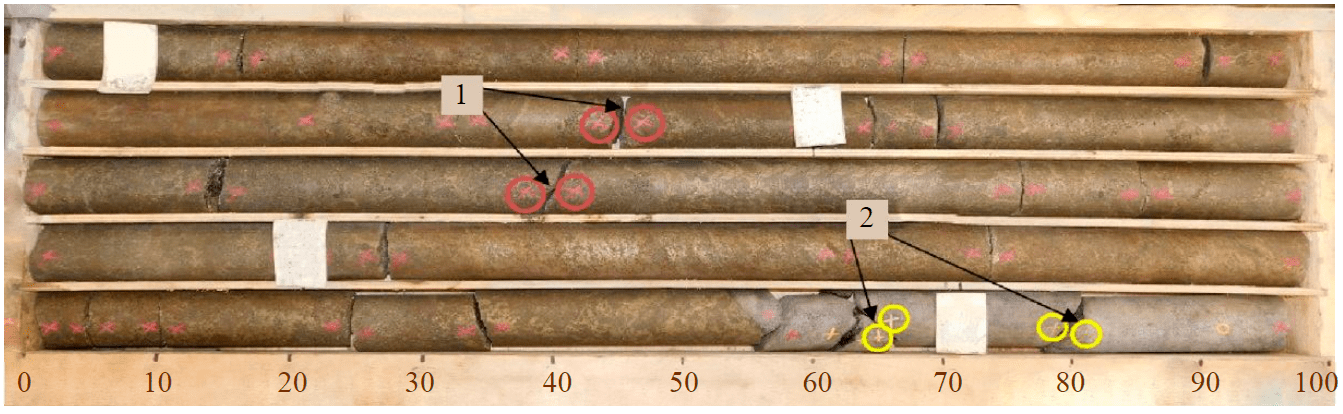
Fig.1. Core of rich sulfide ore in contact with gabbro-dolerites 1 – mechanical damage to the core; 2 – natural cracks
Methodology
Samples from a core of rich sulfide ore were prepared for testing, the diameter of which was 45±1 mm, the ratio of the sample height to diameter was 2:1. The samples were weighed, and non-destructive tests were carried out on them (determination of the propagation velocities of longitudinal and transverse waves and deformation characteristics). Deformation characteristics were determined using GOST 28985 “Rocks. Method for determining deformation characteristics under uniaxial compression” on the H100KU press, using LVDT sensors with an accuracy of 0.5 microns to assess changes in the measurement base during loading/unloading of the sample. In some samples, stress concentrators were created in the form of holes in the center of the longitudinal section of the sample. Samples were considered: standard cylindrical (without holes); with a hole Ø3; 5; 10 mm; with two holes Ø5 mm. Additionally, samples were made with two holes of Ø5 mm and a transverse crack simulating the unloading zone passing through these holes. The distance between the holes was assumed to be three of their diameters. After drilling, the samples with holes were repeatedly tested to determine the deformation characteristics (Young's modules and deformations).
For samples with a single hole of Ø3 and 5 mm, the results of repeated tests did not have significant discrepancies with the initial tests, which is explained by the different measurement base and the installation of sensors at different points. The initial data were accepted. The results of non-destructive testing of samples are presented in Table 1.
Table 1
Physical and mechanical properties of rocks before testing
|
Diameter, mm |
Height, mm |
Modulus of MPa |
Modulus |
Modulus |
Modulus |
Coefficient |
Poisson's |
Hole |
|
44.62 |
90.65 |
48400 |
56700 |
48400 |
56700 |
0.148 |
0.143 |
Without holes |
|
44.54 |
87.67 |
65300 |
68600 |
65300 |
68600 |
0.218 |
0.187 |
|
|
44.63 |
87.99 |
60500 |
64000 |
60500 |
64000 |
0.249 |
0.246 |
|
|
44.58 |
91.92 |
40300 |
45300 |
40300 |
45300 |
0.198 |
0.158 |
|
|
44.80 |
89.26 |
38500 |
44400 |
38500 |
44400 |
0.127 |
0.117 |
|
|
44.96 |
89.53 |
34100 |
37700 |
34100 |
37700 |
0.186 |
0.140 |
|
|
44.94 |
89.80 |
52200 |
52300 |
52200 |
52300 |
0.201 |
0.201 |
|
|
44.47 |
89.12 |
59200 |
61300 |
59200 |
61300 |
0.202 |
0.202 |
One hole Ø3 mm |
|
44.63 |
86.48 |
31900 |
36700 |
31900 |
36700 |
0.151 |
0.151 |
|
|
44.62 |
89.12 |
66100 |
72100 |
66100 |
72100 |
0.203 |
0.194 |
|
|
44.34 |
90.68 |
64100 |
64800 |
64100 |
64800 |
0.229 |
0.221 |
|
|
44.25 |
88.79 |
30300 |
36000 |
30300 |
36000 |
0.154 |
0.166 |
|
|
44.74 |
89.55 |
66700 |
71200 |
66700 |
71200 |
0.224 |
0.219 |
|
|
44.61 |
87.53 |
58400 |
62700 |
58400 |
62700 |
0.205 |
0.201 |
One hole Ø5 mm |
|
44.67 |
89.72 |
79000 |
80800 |
79000 |
80800 |
0.155 |
0.140 |
|
|
44.58 |
87.45 |
65000 |
66600 |
61000 |
62500 |
0.206 |
0.192 |
One hole |
|
44.74 |
88.58 |
81900 |
82200 |
78000 |
78300 |
0.201 |
0.198 |
|
|
44.66 |
88.88 |
50800 |
54100 |
42700 |
45500 |
0.122 |
0.119 |
|
|
44.95 |
90.5 |
43600 |
49300 |
36600 |
41400 |
0.149 |
0.172 |
|
|
44.75 |
89.17 |
50100 |
58000 |
42200 |
47500 |
0.173 |
0.170 |
|
|
44.64 |
88.27 |
63400 |
74800 |
59400 |
69500 |
0.185 |
0.177 |
|
|
44.61 |
87.71 |
48600 |
52200 |
44200 |
47500 |
0.172 |
0.172 |
Two holes |
|
44.69 |
87.99 |
76300 |
76900 |
63100 |
63600 |
0.203 |
0.194 |
|
|
44.65 |
88.71 |
40900 |
44100 |
24900 |
32800 |
0.141 |
0.148 |
|
|
44.94 |
91.24 |
53900 |
59200 |
49700 |
54300 |
0.200 |
0.206 |
|
|
44.54 |
89.70 |
72900 |
76000 |
61100 |
67400 |
0.151 |
0.138 |
|
|
44.62 |
88.76 |
57300 |
65000 |
45900 |
52700 |
0.171 |
0.136 |
|
|
44.65 |
89.35 |
56200 |
64300 |
32200 |
43600 |
0.118 |
0.102 |
Two holes Ø5 mm + transverse crack |
|
45.00 |
89.18 |
38100 |
45000 |
32100 |
38300 |
0.14 |
0.136 |
|
|
44.92 |
89.81 |
37300 |
40800 |
31800 |
31400 |
0.172 |
0.172 |
|
|
44.93 |
90.2 |
39400 |
46600 |
32900 |
40100 |
0.176 |
0.178 |
|
|
44.77 |
89.55 |
44600 |
56900 |
35800 |
43100 |
0.171 |
0.181 |
|
|
44.71 |
86.65 |
31000* |
37400* |
10200 |
– |
– |
– |
* The initial deformation characteristics of the sample were determined taking into account the transverse crack obtained as a result of sample preparation.
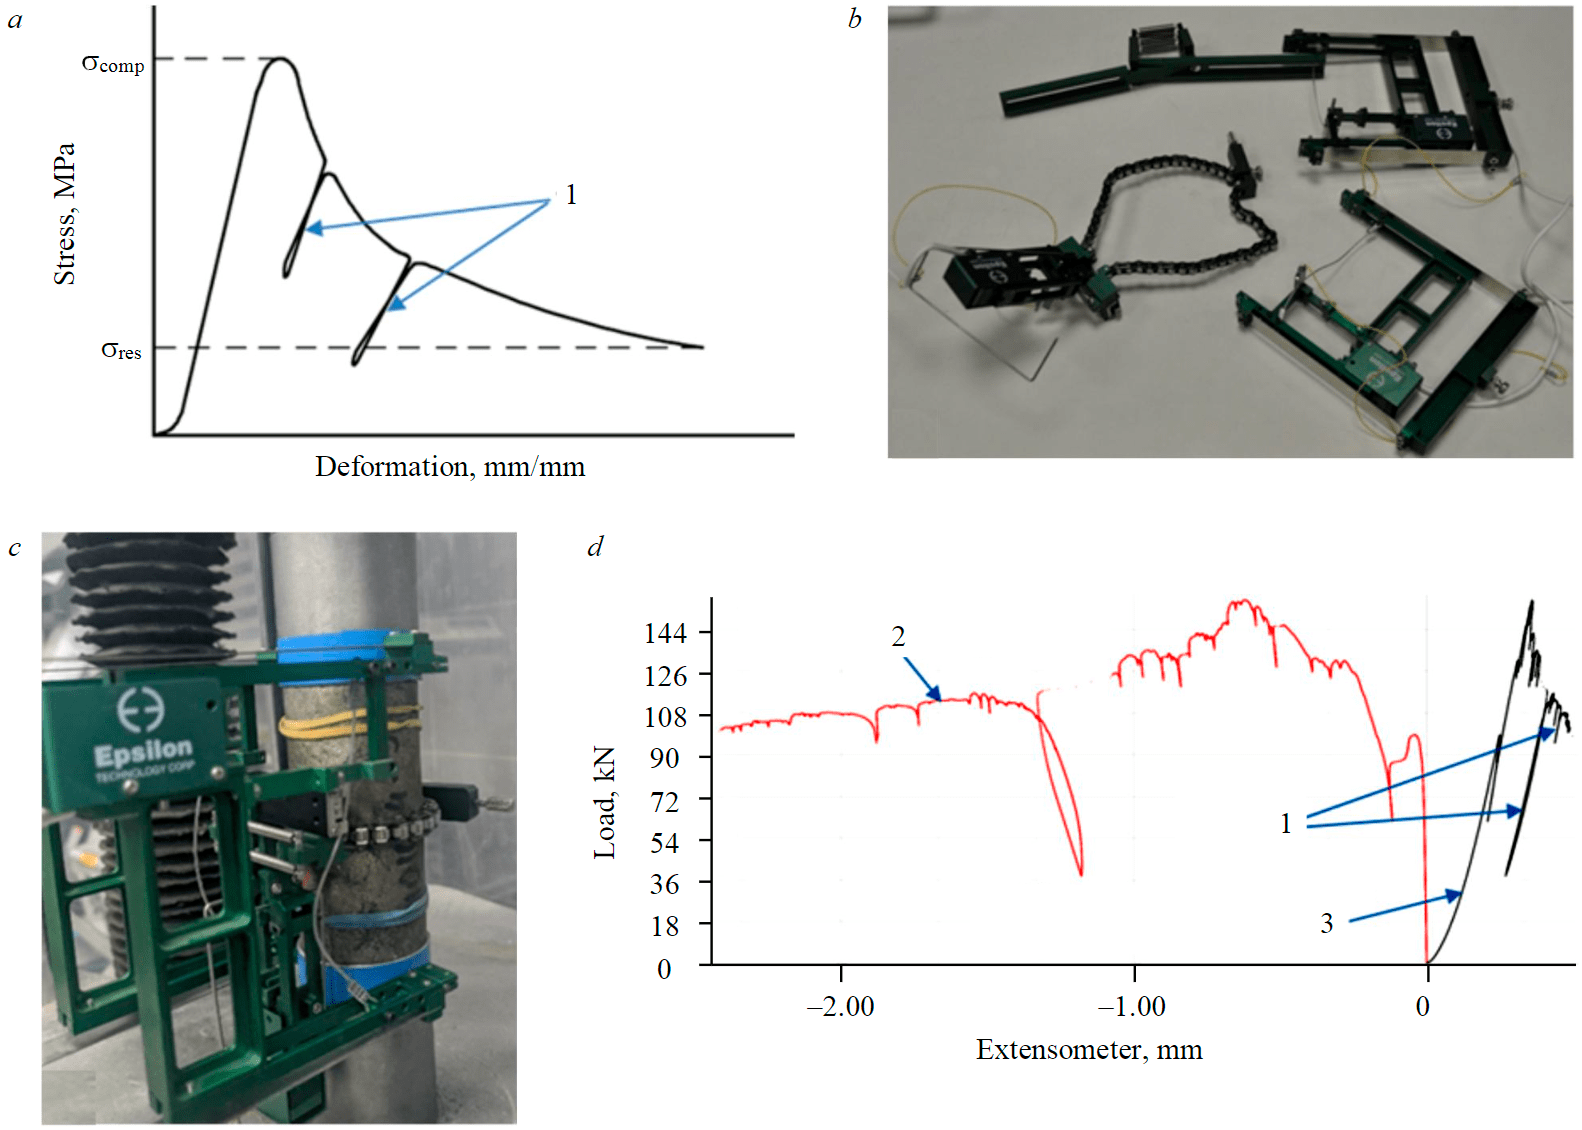
Fig.2. Testing: a – stress – strain graph with “loops” of unloading and loading; b – Epsilon longitudinal and transverse strain extensometers; c – test installation; d – loading graph with “loops” formed by software “Horizont” 1 – “loops”; 2 – movements of the radial extensometer; 3 – movements of the longitudinal extensometer
The methodological basis for determining the modulus of elasticity of a weakened sample was section VI “Assessment of the rock-burst hazard on the brittleness of rocks by means of extreme deformation” of the Methodological Recommendations for assessing the propensity of ore and non-ore deposits to rock bursts. For the tests, a test servo-controlled press TO Super L60 with a maximum load of 300 kN was used. The servo drive allows the testing machine to equalize the load in accordance with a constant deformation rate, which is analogous to the loading mode on hard test presses. A feature of loading with the help of a servo drive is the construction of characteristic “loops” of sharp decline and loading to equalize the rate of deformation with smooth destruction of the sample (Fig.2, a).
In order to obtain a clear decline curve (extreme deformation), the control of maintaining a given deformation rate was carried out by transverse deformations, which made it possible at an early stage to fix the growth of cracks and an increase in cross-section due to dilatancy and prevent the destruction of the sample by elastic energy. Deformations were measured by strain gauges extensometers specialized for testing rocks: transverse – Epsilon 3544-100M-060M-HT2, longitudinal – Epsilon 3542RA2-100M-600M-HT2 (Fig.2, b).
The measurement base of the longitudinal sensors is constant and was equal to 100 mm. Longitudinal deformation was controlled by steel punches, between which a sample was installed (Fig.2, c). When the sample is destroyed, the individual parts formed during the formation of new surfaces experience movements in unpredictable directions and can move relative to each other without reflecting the general direction of deformation. The resulting type of destruction is compressive deformation. For its reliable registration, it is necessary to install a longitudinal extensometer on load plates (punches). This approach reduces the distortion of the measurement results when the sample is destroyed, since it eliminates the loss of contact of the extensometer with the surface. In this case, additional deformations occurring at the contact of the end surface of the sample and the punch are recorded. When interpreting the measurement results, this effect must be taken into account, especially in the area of elastic deformations, where the movements are relatively small.
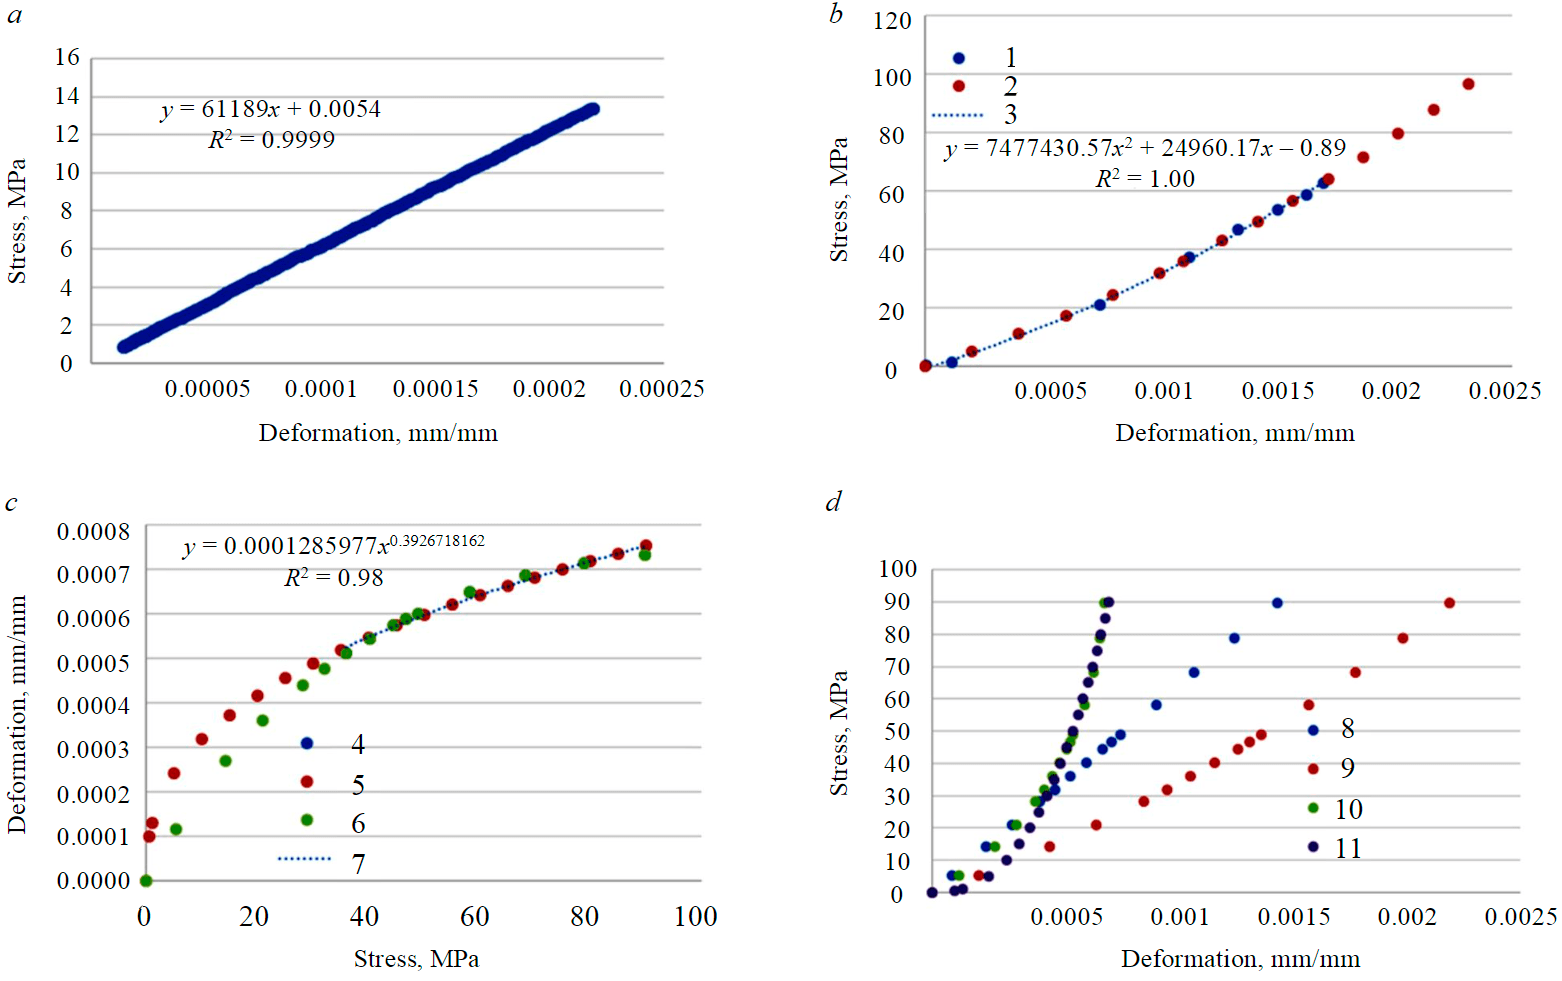
Fig.3. Determination of the calibration function: a – initial test (LVDT) on the loading curve; b – test for extreme deformation (elastic section); c – finding the approximation dependence; d – comparison of the experimental data and the obtained approximation 1 – loading curve (Epsilon); 2 – loading curve (approximation); 3 – polynomial loading curve (Epsilon); 4 – experimental curve (30-90 MPa); 5 – approximation; 6 – experimental curve (0-90 MPa); 7 – power experimental curve (30-90 MPa); 8 – deformations (LVDT); 9 – deformations (Epsilon); 10 – deformation difference (experimental curve); 11 – deformation difference (approximation)
The creation of the test methodology and process control took place through the shell of the specialized software “Horizon” (Fig.2, d), supplied together with the presses TO Super L60. The first stage of testing: compression of the sample at a constant rate of transverse deformations change (changes in the circumference of the sample) 0.02-0.04 mm/min. The calculation of the rate of change in the values of transverse deformations was carried out by recalculation from the loading rate of the sample in 0.1 mm/min. This loading rate is typical for testing rock-burst hazard rocks [35, 36].
After significant destruction of the sample and failure to achieve residual strength, the second (third, if necessary) stage of testing was carried out with an increased loading speed by 2-3 times, since in this case brittle destruction is no longer possible, and an increase in the loading speed only reduces the time of testing.
The values of longitudinal movements were used to analyze the results obtained. The elastic and deformation modulus were determined at the deformation sites beyond the tensile strength at the moments when the servo drive of the press equalized the deformation rate of the sample and formed “loops” of sharp decline and loading on the graph.
Calibration of test graphs
Since movements between loading punches were measured using longitudinal extensometers, the results could be distorted due to the fixation of additional deformations at the ends of the samples, which led to an underestimation of the values of elastic and deformation modulus. Moreover, the difference in values logically increased with increasing hardness of the sample.
To cut off unnecessary deformations, the graphs were calibrated according to the elasticity zone (Fig.3). The calibration assumes that the deviation Δε is a function of f(P), where P is the load on the sample, MPa.
To identify this dependence, the approximating functions of the load branches were determined during the initial determination of deformation characteristics (in the case of samples with holes, the determination of deformation characteristics after drilling) using LVDT sensors (deformations (LVDT) and in the elastic zone during the test for extreme deformation (deformation (Epsilon). The values of deformations on the approximated curves are revealed at the same stress values, the values of Δε are calculated, which is the difference between Epsilon and LVDT deformations, “stress – deformation” graphs are constructed. The greatest convergence was achieved when approximated by a power function.
Calibration of the complete deformation graph was carried out individually for each sample in the required stress interval, therefore, the power approximation of the “stress – deformation” graph (Fig.3, c) is unique in each case. The recalculation of deformations was carried out
according to the formula
where εEps – deformations (Epsilon), mm/mm; Δε(P) – a power function of the type Δε = APB, mm/mm; P – the stress in the sample caused by the press load, MPa; A and B – empirical coefficients. An example of processing the test graph of one of the samples is shown in Fig.4.
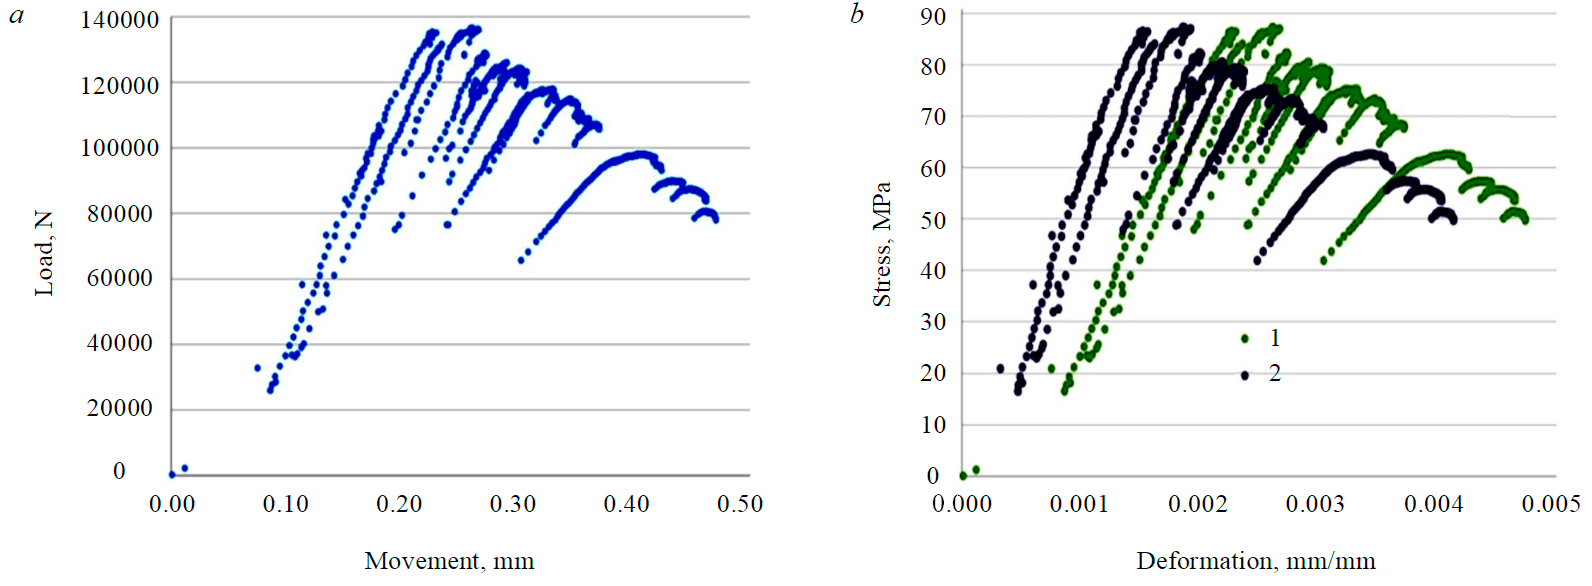
Fig.4. Test graphs: a – initial (load – movement); b – stress – deformation before/after calibration ,1 – initial graph; 2 – calibration
After calibration of the graphs, the elastic and deformation modulus were estimated. In cases where the sample was tested in several stages, in the presence of “loops” of unloading and loading on the shelf of residual strength, the elastic and deformation modulus were determined in these areas.
Results discussion
The results of determining the values of elastic and deformation modulus after calibration are presented in Table 2. However, for some samples, it was not possible to identify the “loops” of unloading and loading.
Table 2
Physical and mechanical properties of samples after testing
|
Holes |
Modulus of deformation (with holes) ED1, |
Modulus of elasticity (with holes) EE1, |
Modulus of deformation (with holes) Epsilon |
Modulus of deformation (with holes) |
Modulus of deformation |
Modulus of elasticity |
ED1/ED4 |
EE1/EE4 |
Uniaxial compressive strength, MPa |
Residual strength, MPa |
|
No |
48400 |
56700 |
25200 |
46000 |
7109 |
11219 |
6.81 |
5.05 |
42.83 |
3.2 |
|
No |
65300 |
68600 |
33800 |
65100 |
17264 |
27047 |
3.78 |
2.54 |
63.24 |
– |
|
No |
60500 |
64000 |
45800 |
65300 |
30397 |
46038 |
1.99 |
1.39 |
87.27 |
– |
|
No |
40300 |
45300 |
31700 |
37200 |
– |
– |
– |
– |
70.88 |
– |
|
No |
38500 |
44400 |
33700 |
38600 |
33598 |
38393 |
1.15 |
1.16 |
71.96 |
3.4 |
|
No |
34100 |
37700 |
32000 |
35900 |
25136 |
25760 |
1.36 |
1.46 |
66.08 |
1.96 |
|
No |
52200 |
52300 |
47400 |
54800 |
8388 |
12402 |
6.22 |
4.22 |
95.54 |
5.4 |
|
One (3 mm) |
59200 |
61300 |
33400 |
47200 |
10349 |
11569 |
5.72 |
5.3 |
49.81 |
2.5 |
|
One (3 mm) |
31900 |
36700 |
22300 |
33100 |
9173 |
8220 |
3.48 |
4.46 |
53.96 |
3.2 |
|
One (3 mm) |
66100 |
72100 |
26400 |
63900 |
36444 |
21045 |
1.81 |
3.43 |
49.88 |
3.89 |
|
One (3 mm) |
64100 |
64800 |
37500 |
62900 |
48613 |
53710 |
1.32 |
1.21 |
47.83 |
2.3 |
|
One (3 mm) |
30300 |
36000 |
28200 |
30200 |
7984 |
7965 |
3.8 |
4.52 |
53.21 |
3.7 |
|
One (3 mm) |
66700 |
71200 |
42833 |
58800 |
– |
– |
– |
– |
87.23 |
– |
|
One (5 mm) |
58400 |
62700 |
31800 |
52900 |
– |
– |
– |
– |
63.26 |
1.0 |
|
One (5 mm) |
79000 |
80800 |
46100 |
76500 |
– |
– |
– |
– |
100.08 |
– |
|
One (10 mm) |
42200 |
47500 |
34600 |
37100 |
– |
– |
– |
– |
64.32 |
1.5 |
|
One (10 mm) |
59400 |
69500 |
30100 |
52000 |
– |
– |
– |
– |
71.20 |
1.0 |
|
One (10 mm) |
61000 |
62500 |
25100 |
58600 |
– |
– |
– |
– |
39.07 |
1.65 |
|
One (10 mm) |
78000 |
78300 |
39100 |
74200 |
29259 |
24976 |
2.67 |
3.14 |
74.05 |
2.0 |
|
One (10 mm) |
42700 |
45500 |
18600 |
43800 |
– |
– |
– |
– |
33.62 |
2.5 |
|
One (10 mm) |
36600 |
41400 |
26400 |
34200 |
18617 |
32614 |
1.97 |
1.27 |
58.60 |
2.2 |
|
Two (5 mm) |
44200 |
47500 |
24200 |
43700 |
15414 |
– |
2.87 |
– |
42.33 |
4.1 |
|
Two (5 mm) |
63100 |
63600 |
43000 |
61800 |
25453 |
17735 |
2.48 |
3.59 |
65.17 |
5.4 |
|
Two (5 mm) |
24900 |
32800 |
17800 |
21200 |
14547 |
12621 |
1.71 |
2.6 |
32.03 |
11.2 |
|
Two (5 mm) |
49700 |
54300 |
36400 |
45200 |
42257 |
41618 |
1.18 |
1.3 |
98.95 |
2.2 |
|
Two (5 mm) |
61100 |
67400 |
52500 |
61900 |
39301 |
39167 |
1.55 |
1.72 |
104.28 |
1.34 |
|
Two (5 mm) |
45900 |
52700 |
34900 |
45500 |
25176 |
24965 |
1.82 |
2.11 |
77.03 |
– |
|
Two (5 mm) + crack |
32200 |
43600 |
27200 |
32200 |
20250 |
– |
1.59 |
– |
52.65 |
4.4 |
|
Two (5 mm) + crack |
32100 |
38300 |
28400 |
32600 |
15908 |
15182 |
2.02 |
2.52 |
56.86 |
3.1 |
|
Two (5 mm) + crack |
31800 |
31400 |
31200 |
32000 |
– |
– |
– |
– |
54.27 |
– |
|
Two (5 mm) + crack |
32900 |
40100 |
30700 |
33000 |
2572 |
5324 |
12.8 |
7.53 |
47.01 |
5.0 |
|
Two (5 mm) + crack |
35800 |
43100 |
30000 |
37400 |
5875 |
– |
6.09 |
– |
38.72 |
6.9 |
|
Two (5 mm) + crack |
10200 |
– |
– |
– |
– |
– |
– |
– |
25.10 |
– |
From the Table 2 it follows that the modulus of elasticity and deformation of the samples, determined to the limit of residual strength, decrease by 1.2-2 times compared to the initial characteristics, and when evaluating the “loops” on the “shelves” of residual strength, a decrease in modulus by 5-7 times is observed. Samples with two holes and a transverse crack were often brought to the shelf of residual strength during testing. However, the number of “loops” is smaller due to the uniform development of plastic deformations due to the presence of a crack, which did not allow to fully assess their deformation characteristics during the destruction process.
Regardless of the effect of the hole on the nature of the load drop, the presence of holes made it possible to keep the destroyed sample in a more stable state than samples without holes. So, out of seven monolithic samples, only three samples kept the shape after destruction, while all samples with holes retained their shape. Perhaps this is due to the fact that in monolithic samples, the destruction was evenly distributed throughout the sample, whereas in samples with holes, it was the holes that concentrated most of the destruction on themselves (Fig.5).
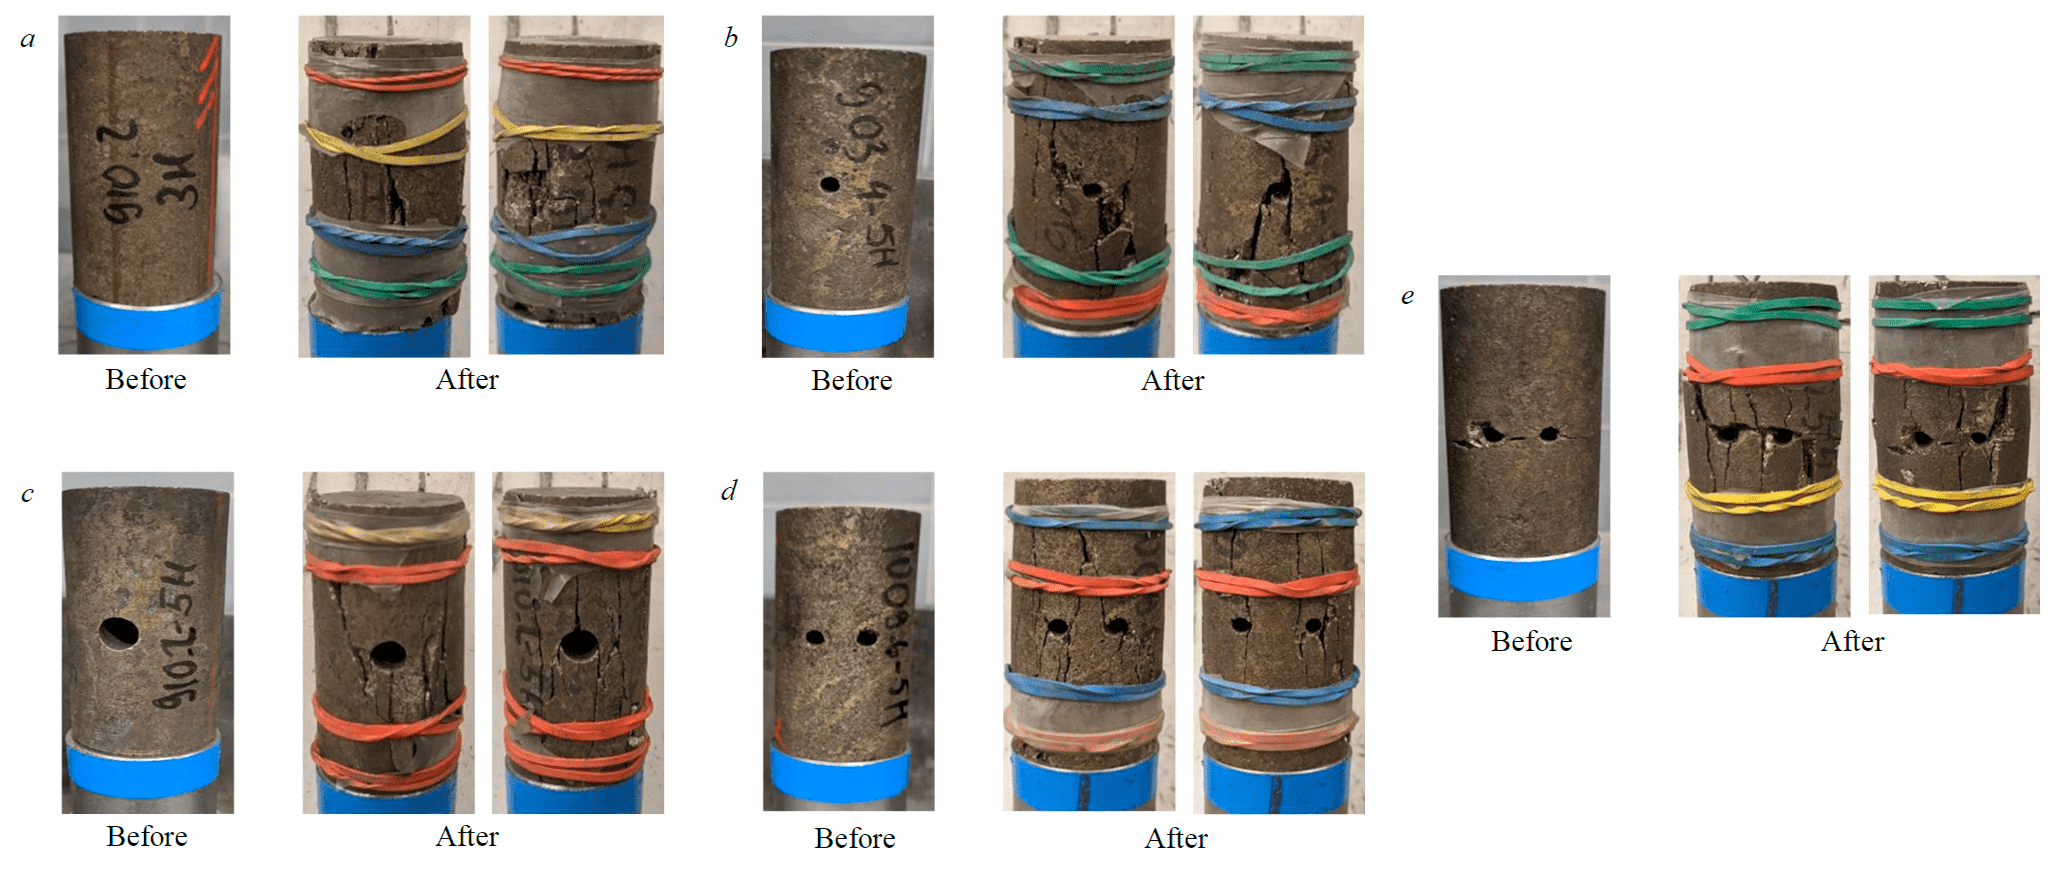
Fig.5. The nature of the destruction of samples after testing with stress concentrators of various configurations: а – standard (without holes): development of vertical fracturing on the sample surface; b – hole Ø3 mm: the concentration of cracks around the circular hole, the development of vertical cracks up and down; c – hole Ø10 mm: the concentration of cracks around the circular hole, the growth of vertical cracks from the axis of the hole; d – two holes Ø5 mm: the concentration of cracks around the hole of circular cross-section, there is a splicing of cracks formed along adjacent holes; e – two holes Ø5 mm + crack: the concentration of cracks around the hole of circular cross-section, the development of vertical crack formation in the “pillar” between the holes
Conclusion
Despite the wide range of possibilities, to assess the destruction of rock under load, the best way is to conduct laboratory tests followed by the construction of graphs of extreme deformations. Extreme tests on servohydraulic test presses with the control of the growth rate of transverse deformations values, due to the construction of “loops” of unloading and loading, allow to estimate the elastic and deformation modules beyond the strength limit of the sample. The tests carried out on the example of samples of rich sulfide ore showed that in the process of destruction, the elastic and deformation modules decrease by about 1.5-2 times, and in the zone of residual strength by 5-7 times.
Stress concentrators (holes Ø3 and 5 mm) slightly affected the change in strength properties and almost did not affect the change in the initial value of the modulus of elasticity and deformation. However, holes of this size were enough to change the nature of the destruction of the samples – cracks developed near the holes. In the case of testing samples without holes, cracking occurred on the surface almost uniformly. The presence of stress concentrators such as two holes of Ø5 mm together with a transverse crack simulating the unloading area allows, due to a noticeable decrease in strength, to conduct tests with a greater probability of achieving the shelf of the residual strength of the sample. However, they significantly reduce the number of “loops” of unloading and loading, which make it possible to accurately estimate the modules of elasticity and deformation.
References
- Rybak J., Khayrutdinov M.M., Kuziev D.A. et al. Prediction of the geomechanical state of the rock mass when mining salt deposits with stowing. Journal of Mining Institute. 2022. Vol. 253, p. 61-70. DOI: 10.31897/PMI.2022.2
- Hongpu Kang, Pengfei Jiang, Yongzheng Wu, Fuqiang Gao. A combined “ground support-rock modification-destressing” strategy for 1000-m deep roadways in extreme squeezing ground condition. International Journal of Rock Mechanics and Mining Sciences. 2021. Vol. 142. N 104746. DOI: 10.1016/j.ijrmms.2021.104746
- Jian Zhou, Chao Chen, Kun Du et al. A new hybrid model of information entropy and unascertained measurement with different membership functions for evaluating destressability in burst-prone underground mines. Engineering with Computers. 2020. Vol. 38, p. 381-399. DOI: 10.1007/s00366-020-01151-3
- Rasskazov I.Yu, Saksin B.G., Usikov V.I., Potapchuk M.I. Rock mass geodynamics and mining-induced rockbursting at Nikolaev complex deposit. Gornyi zhurnal. 2016. N 12, p. 23-25 (in Russian). DOI: 10.17580/gzh.2016.12.03
- Tyupin V.N. Estimation of Critical Depth of Deposits by Rock Bump Hazard Condition. Journal of Mining Institute. 2019. Vol. 236, p. 167-171. DOI: 10.31897/PMI.2019.2.167
- Sidorov D.V., Potapchuk M.I., Sidlyar A.V., Kursakin G.A. Assessment of Rock-Burst Hazard in Deep Layer Mining at Nikolayevskoye Field. Journal of Mining Institute. 2019. Vol. 238, p. 392-398. DOI: 10.31897/PMI.2019.4.392
- Pleshko M.S., Davydov A.A., Silchenko Yu.A., Kaledin O.S. Effective lining solutions for super-deep shaft SKS-1 in Skalisty mine in difficult geomechanical conditions. Gornyi zhurnal. 2020. N 6, p. 57-62 (in Russian). DOI: 10.17580/gzh.2020.06.08
- Sergunin M.P., Alborov A.E., Andreev A.A., Buslova M.A. Stress assessment ahead of stoping front with widening stress relief zone – A case study of the Oktyabrsky and Talnakh deposits. Gornyi zhurnal. 2020. N 6, p. 38-41 (in Russian). DOI: 10.17580/gzh.2020.06.06
- Balandin V.V., Leonov V.L., Kuranov A.D., Bagautdinov I.I. Application of generalized Hoek–Brown criterion to selection and design of mine support systems for the Oktyabrsky copper–nickel deposit: Case study. Gornyi zhurnal. 2019. N 11, p. 14-18 (in Russian). DOI: 10.17580/gzh.2019.11.01
- Konicek P., Schreiber. Rockburst prevention via distress blasting of competent roof rocks in hard coal longwall mining. Journal of the Southern African Institute of Mining and Metallurgy. 2018. Vol. 118, p. 235-242. DOI: 10.1759/2411-9717/2018/v118n3a6
- Vennes I., Mitri H., Chinnasane D.R., Yao M. Effect of Stress Anisotropy on the Efficiency of Large-Scale Destress Blasting. Rock Mechanics and Rock Engineering. 2021. Vol. 54, p. 31-46. DOI: 10.1007/s00603-020-02252-7
- Saadatmand Hashemi A., Katsabanis P. Tunnel face preconditioning using destress blast-ingblasting in deep underground excavations. Tunnelling and Underground Space Technology. 2021. Vol. 117. N 104126. DOI: 10.106/j.tust.2021.104126
- Karpov G. N., Kovalski E. R., Smychnik A. D. Determination of rock destressing parameters at the ends of disassembling room. Mining informational and analytical bulletin. 2019. N 8, p. 95-107 (in Russian). DOI: 10.25018/0236-1493-2019-08-0-95-107
- Sidlyar A.V., Potapchuk M.I., Tereshkin A.A. Geomechanical Confirmation of Safe Mining at Nikolaevskoye Polymetallic Deposit, Which Is Rock Bursts Dangerous. Mining informational and analytical bulletin. 2017. N 7, p. 184-194 (in Russian). DOI: 10.25018/0236-1493-2017-7-0-184-194
- Hoek E., Brown E.T. The Hoek-Brown failure criterion and GSI – 2018 edition. Journal of Rock Mechanics and Geotechnical Engineering. 2019. Vol. 11. Iss. 3, p. 445-463. DOI: 10.1016/j.jrmge.2018.08.001
- Winn K. Multi-approach Geological Strength Index (GSI) Determination for Stratified Sedimentary Rock Masses in Singapore. Geotechnical and Geological Engineering. 2020. Vol. 38, p. 2351-2358. DOI: 10.1007/s10706-019-01149-9
- Hoek E., Diedrierichs M.S. Empirical estimation of rock mass modulus. International Journal of Rock Mechanics & Mining Sciences. 2006. Vol. 43. Iss. 2, p. 203-215. DOI: 10.1016/j.ijrmms.2005.06.005
- Nikolenko P.V., Shkuratnik V. L., Chepur M. D. Sensitization of ultrasonic stress control in rock mass by heating. Mining informational and analytical bulletin. 2021. N 11, p. 159-168 (in Russian). DOI: 10.25018/0236_1493_2021_11_0_159
- Rajaoalison H., Zlotkowski A., Rambolamanana G. Mechanical Properties of Sandstone using non-Destructive Method. Journal of Mining Institute. 2020. Vol. 241, p. 113-117. DOI: 10.31897/PMI.2020.1.113
- Protosenya A.G., Iovlev G.A. Prediction of Spatial Stress-Strain Behavior of Physically Nonlinear Soil Mass in Tunnel Face Area. Mining informational and analytical bulletin. 2020. N 5, p. 128-139. DOI: 10.25018/0236-1493-2020-5-0-128-139
- Protosenya A.G., Verbilo P.E. Analysis of the jointed rock mass mechanical characteristics anisotropy under conditions of apatite-nepheline mineral deposits. Topical Issues of Rational Use of Natural Resources: Proceedings of the XV International Forum-Contest of Students and Young Researchers under the auspices of UNESCO, 13-17 May 2019, St. Petersburg, Russia. Saint Petersburg Mining University, 2019, p. 187-197.
- Aushev E.V., Cherepovskiy A.A., Lysenko M.V., Pozolotin A.S. Geomechanical evaluation of the mining situation in the formation of the dismantling chamber and the production of dismantling. Ugol. 2019. N 11 (1124), p. 20-26. DOI: 10.18796/0041-5790-2019-11-20-26
- Peiqi Xi, Yuming Huo, Defu Zhu et al. Development and application of triangulation joint network based on an FEM program (RS2). Journal of Geophysics and Engineering. 2022. Vol. 19. Iss. 2, p. 245-254. DOI: 10.1093/jge/gxac013
- Dang V.K., Do N.A., Dinh V.D. Estimating the radial displacement on the tunnel boundary by rock mass classification systems. International Journal of GEOMATE. 2022. Vol. 22. N 9, p. 9-15. DOI: 10.21660/2022.92.19
- Zareifard M.R. A new semi-numerical method for elastoplastic analysis of a circular tunnel excavated in a Hoek – Brown strain-softening rock mass considering the blast-induced damaged zone. Сomputers and Geotechnics. 2020. Vol. 122. N 103476. DOI: 0.1016/j.compgeo.2020.103476
- Jinwang Li, Caihua Shen, Xiufeng He et al. Numerical solution for circular tunnel excavated in strain-softening rock masses considering damaged zone. Scientific Reports. 2022. Vol. 12. N 4465. DOI: 10.1038/s41598-022-08531-3
- Bertuzzi R. Revisiting rock classification to estimate rock mass properties. Journal of Rock Mechanics and Geotechnical Engineering. 2019. Vol. 11. Iss. 3, p. 494-510. DOI: 10.1016/j.jrmge.2018.08.011
- Stavrogin A.N., Tarasov B.G. Experimental physics and mechanics of rocks. St. Petersburg: Nauka, 2001, p. 342 (in Russian).
- Stavrogin A.N., Protosenya A.G. Mechanics of deformation and destruction of rocks. Moscow: Nedra, 1992, p. 224 (in Russian).
- Eberhardt E. The complete ISRM suggested methods for rock characterization, testing and monitoring: 1974-2006. Commission on Testing Methods, International Society for Rock Mechanics. 2009, p. 628.
- Kozyrev A.A., Kuznetsov N.N., Fedotova I.V., Shokov A.N. The Determination of Rockburst Hazard Degree of Hard Rocks by the Test Results under Uniaxial Compression. Izvestiya vysshikh uchebnykh zavedenii. Gornyi zhurnal. 2019. N 6, p. 41-50 (in Russian). DOI: 10.21440/0536-1028-2019-6-41-50
- Aynbinder I.I., Ovcharenko O.V. Potential rockburst hazard research at the project mining depth at the Valunistoe deposit. Mining informational and analytical bulletin. 2022. N 6, p. 35-45 (in Russian). DOI: 10.25018/0236_1493_2022_6_0_35
- Biryuchev I.V., Makarov A.B., Usov A.A. Geomechanical model of underground mine. Part II. Application. Gornyi zhurnal. 2020. N 2, p. 35-44 (in Russian). DOI: 10.17580/gzh.2020.02.04
- Pavlovich A.A., Korshunov V.A., Bazhukov A.A., Melnikov N.Y. Estimation of Rock Mass Strength in Open-Pit Mining. Journal of Mining Institute. 2019. Vol. 239, p. 502-509. DOI: 10.31897/PMI.2019.5.502
- Zavacky M., Stefanak J. Strains of rock during uniaxial compression test. The Civil Engineering Journal. 2019. Vol. 3. N 32, p. 398-403.
- Tao Qin, Hongru Sun, Heng Liu et al. Experimental Study on Mechanical and Acoustic Emission Char-acteristics of Rock Samples under Different Stress Paths. Shock and Vibration. 2018. Vol. 2018. N 4813724. DOI: 10.1155/2018/4813724