Adaptive approach formation using machine vision technology to determine the parameters of enrichment products deposition
- 1 — Ph.D. Associate Professor Saint Petersburg Mining University ▪ Orcid
- 2 — Ph.D. Associate Professor Saint Petersburg Mining University ▪ Orcid ▪ Elibrary ▪ Scopus ▪ ResearcherID
- 3 — Engineer Saint Petersburg Mining University ▪ Orcid

Abstract
In this paper, an adaptive approach has been developed for automatic initialization of the thickening curve using machine vision technology, which makes it possible to determine with high accuracy the material parameters necessary for the design of thickening and clarification apparatuses. Software has been developed that made it possible to search for the coordinates of the condensation critical point in automatic mode. Studies on two samples of materials (tailings of apatite-containing ores and gold-bearing concentrate) were carried out and made it possible to statistically prove the reproducibility of the results obtained using the parametric criteria of Fisher and Bartlett. It has been established that the deposition curves are approximated with high accuracy by the Weibull model, which, together with the piecewise linear approximation, makes it possible to formalize the method for determining the critical point coordinates. The empirical coefficients of the Weibull model for two samples are found, and the final liquefaction and settling rates of the studied materials are determined.
None
Introduction
One of the fundamental points of the sustainable development concept in environmental terms is the rational use of natural resources, ensuring their suitability for both our contemporaries and future generations [1-3]. According to experts, about 22 % of the total water circulation is used for industrial needs and, according to rough estimates, this figure will increase by 2 % in three years.* When enriching mineral raw materials, the resulting products contain a significant amount of water, as well as residual concentrations of reagents and slurry fractions. Proper management of these products prior to shipment to the consumer, including their dehydration and damming, is a key element of modern production aimed at maintaining high environmental standards. [4, 5]. According to average indicators, at processing plants, the consumption of production water per 1 ton of processed ore, depending on the type of processed raw materials, ranges from 4 to 10 m3, at some gravity plants it reaches 15 m3/t [6]. In addition to concentrates dewatering, thickening processes are key to wastewater treatment and tailings disposal. Thickening of tailings at the processing plant allows for recycling water supply, minimizing the need for fresh water intake, and also reduces the amount of water discharged to tailings, which, in turn, reduces the risk of accidents. All this puts the processes of dehydration and thickening on a par with the main processes that significantly affect the entire technological chain [7].
Despite its importance, the process of designing thickeners and clarifiers is reduced to calculating the specific surface area of the thickener based on the results of sedimentation studies in static or dynamic conditions using the Coe – Clevenger method proposed more than 100 years ago [8]. The universally recognized phenomenological model of condensation was published at the end of the last century [9, 10] and allowed the development of software for the design and simulation of traditional industrial thickeners with the following parameters: unit area, concentration profile and solids content in the thickener. But mathematical models are useless if the experimental parameters that determine the proposed equations are not available [11].
Currently, there are problems associated with laboratory studies of the sedimentation process and, above all, with the initialization and interpretation of sedimentation curves obtained at the stage of laboratory testing of the thickening process [3]. These problems are associated, for the most part, with the human factor, since the quality of the test directly depends on the experience and competence of the researcher. In addition, the process of conducting the experiment is complicated by several pronounced factors: the transience of the process, the need for parallel fixation of several parameters. For some types of pulps, situations may arise in which the possibility of visual control and determination of the liquid-suspension boundary is complicated by the characteristics of the material being worked with.
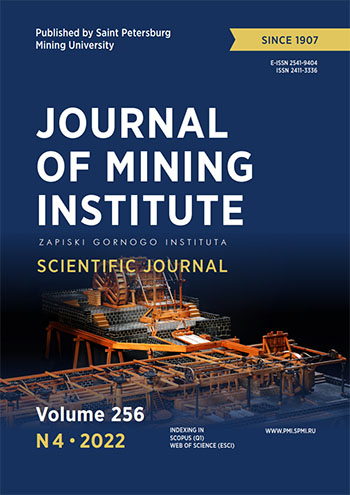
Many researchers have been involved in solving this problem, among the most significant solutions are the SediRack system developed by Cettem, which, regardless of the operator, automatically determines and issues the necessary parameters for calculating the condensation unit area. SediRack is a laboratory device that allows simultaneous testing of five samples, each of which differs in concentration or addition of a flocculant (Fig.1).* The height of the water-suspension interface is measured automatically in each test tube using a video camera. The recorded data is processed online by a program that gives the initial settling rate in each of the five tubes. Using this information, the program calculates the solid flux density and unit area according to the Coe – Clevenger method for each investigated concentration.
However, this software can only work with the device shown in Fig.1, a, which significantly limits the work with this product. A similar problem is inherent in other similar installations [12-14]. Meanwhile, the current state of technology makes it possible to implement this kind of concept using machine learning algorithms and computer vision on any available test bench.
The introduction of such algorithms is actively used at processing plants, but the scope of their application is very limited [15, 16]. In paper [17] the authors analyzed studies on this topic in the field of mineral processing. Most of the work is related to machine vision, which is probably due to the desire to find indirect methods for measuring parameters such as particle size or chemical composition, using images as a cheaper and faster alternative to sample analysis. It may also indicate the relatively widespread adoption of machine vision systems in industry, as well as research activities to improve the results achieved with machine vision systems. Many of the technologies categorized as machine vision are empirical models that relate process parameters (such as content or recovery) to machine vision characteristics (such as bubble size, particle size, or statistical descriptions of texture) [18-20].
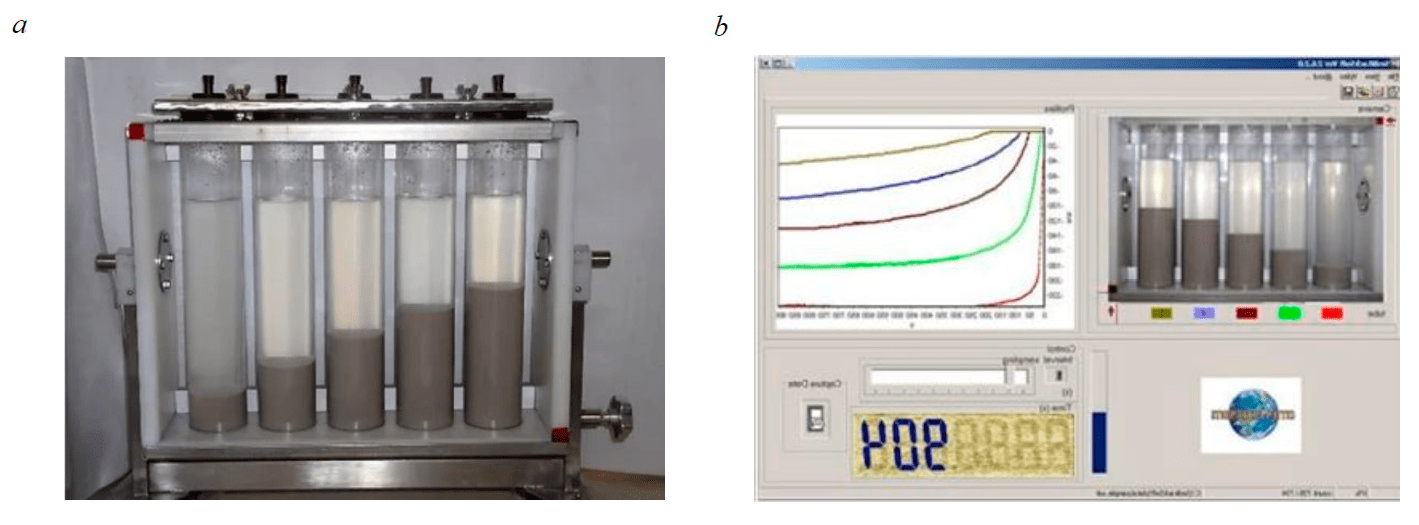
Fig.1. SediRack workbench: а – settling point for deposition curves; b – data processing dialog box (en.cettem.com)
In the field of mineral processing, grain edge detection and segmentation tasks have been implemented to detect particle or bubble boundaries and obtain other information, such as particle (bubble) size distribution, foam stability, or even the content of a useful component. An alternative approach involves extracting lower dimensional abstract features from high dimensional images; these features may correlate with the parameters of interest (particle size or chemical composition), but do not directly measure these parameters.
Feature extraction methods are closely related to dimensionality reduction methods, such as principal component analysis. Whether an image processing or feature extraction approach (or both) is used, the next step in applying machine vision is to correlate the features and/or parameters obtained from images with process conditions, variables, or key performance indicators such as variety, chemical or particle size distribution [17].
The purpose of this work was to develop an adaptive approach using machine vision technology to determine the parameters of the deposition of enrichment products by automating the process of data capture when conducting studies of the deposition kinetics.
Methodology
In order to calculate the required thickener area, a cylinder deposition test must be performed. The testing methodology involves the use of transparent cylinders with a capacity of 0.5 [21, 22], 1 [23] or 2 l [24]. In this work, testing was carried out in cylinders with a capacity of 1 l, which corresponds to domestic practice [25]. To initialize the periodic settling curve, the cylinder was filled with pulp with a given concentration of solids, then non-intensive mixing was carried out by turning the cylinder tenfold to ensure complete pulp homogenization while maintaining the original settling properties. During the standard test, after homogenization, a timer was started to monitor the change in the position of the suspension-liquid interface at various time intervals (0; 0.5; 1; 2; 3; 4; 5; 10 or more minutes). The time could be changed depending on the dynamics of the deposition of a particular sediment sample. As a general rule, the slurry-liquid interface is measured more frequently at the start of a test because the sediment settles relatively quickly. Further, the frequency of measurements decreases, since the phase boundary moves more slowly, the rate of solid phase deposition decreases sharply. Observation was stopped if the position of the boundary did not change within 2-3 h.
When carrying out this technique, difficulties arise, the main of which is the impossibility of an accurate visual determination of the phase boundary. Also, typically, a sharp transition from one stage to another occurs, which cannot be clearly defined even in the presence of illumination. Among other problems the transience of sedimentation processes should be noted, especially for gravity concentrates or flocculated pulps. Mechanical measurement in this case is impossible, as in the case of testing pulps without a clear separation boundary.
In this work, two representative samples were taken for testing: gold-bearing concentrate from the processing plant of the Olimpiadninsky deposit with a bulk density of 1.39 g/cm3 (sample 1); tai-lings from the processing plant ANOF-2 of the Kirov group of deposits with a bulk density of 1.19 g/cm3 (sample 2) [26, 27]. Bulk density was determined in accordance with GOST 25732-88. Characteristics of particle size distribution for sample 1: d50 = 69; d80 = 93 µm; for sample 2: d50 = 57.5; d80 = 87 µm.
The mineral composition of sample 1 is mainly represented by arsenopyrite and pyrrhotite (25.2 and 37.7 %, respectively), there are pyrite, antimony minerals, chalcopyrite, as well as iron oxides and hydroxides, the content of non-metallic minerals (quartz, carbonates, micas, Ti minerals) about 27.7 %. Sample 2 contains a significant amount of nepheline (60.36 %), as well as identified feldspar (7.40 %), aegirine (11.64 %), sphene, titanomagnetite, ilmenite, biotite, eudialyte and others minerals (in aggregate less than 5 %).
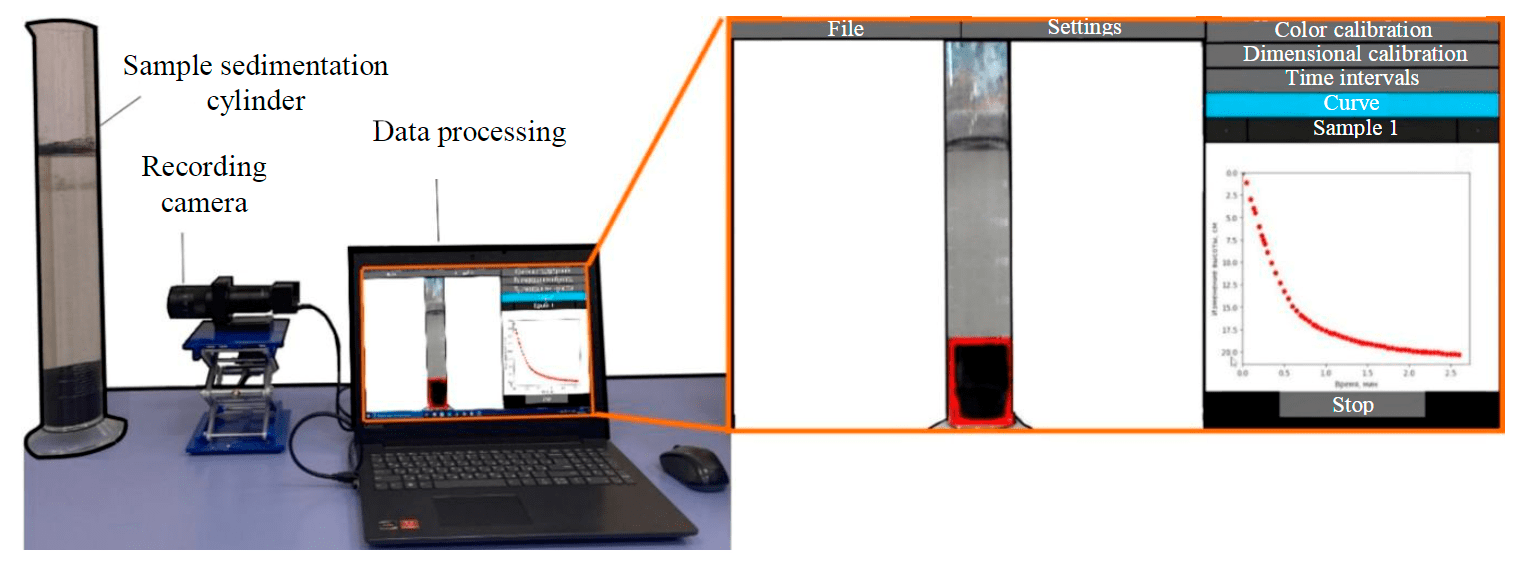
Fig.2. Experimental workbench for determination of deposition curves and developed software interface
The L:S ratio was set equal to 5:1, MS-203 reagent was used as a flocculant at a consumption of 100 g/t. Since in this work it was not required to establish the dependence of the settling rate on the solids content and choose the most suitable flocculant, these indicators were chosen based on the results of preliminary tests to increase the settling rate in order to test the capabilities of the data processing system at a high settling rate.
The automatic system for monitoring the movement of the phase boundary consisted of a camera for fixing the deposition process and an information processing unit with installed software (Fig.2). Preliminary tests of the system showed that satisfactory results are achieved with a camera resolution of two megapixels.
The high-level programming language Python was used to develop the software. The choice of language is justified by its prevalence in solving problems of machine learning, computer vision, as well as a large selection of ready-made libraries.
Discussion of the results
The scheme of the program for determining deposition curves is shown in Fig.3.
When choosing a method for detecting a tracked object (the level of a clarified liquid column), a freely distributed library of computer vision algorithms, OpenCV, was used. In this case, the principle of the program is based on the step-by-step processing of the image through various operations to select and search for the desired contour. The use of this package allows you to fine-tune the software in the process of work. The image coming from the camera is subjected to a Gaussian blur to eliminate noise and small, non-functional details in the image.
The main sign of distinguishing the contours of objects in this program is the level of contrast between the color of the settling material and the column of clarified liquid. This approach makes it possible to unambiguously identify the observed liquid column and determine the boundary between the clarified liquid and the suspension. The definition of the contour occurs due to the image binarization. The criteria for assigning a value to a pixel are determined by the user by setting the boundaries of the intensities of the pixel properties, and if the pixel has parameters that are within the specified boundaries, it is assigned a value of 1, otherwise – 0. For convenience, the image is translated from the standard RGB color scheme (red, green, blue) in more intuitive – HSB (hue, saturation, brightness), in which color is determined not by a combination of three basic color elements, but by hue, saturation and brightness. Which allows you to calibrate images without using color palette values.
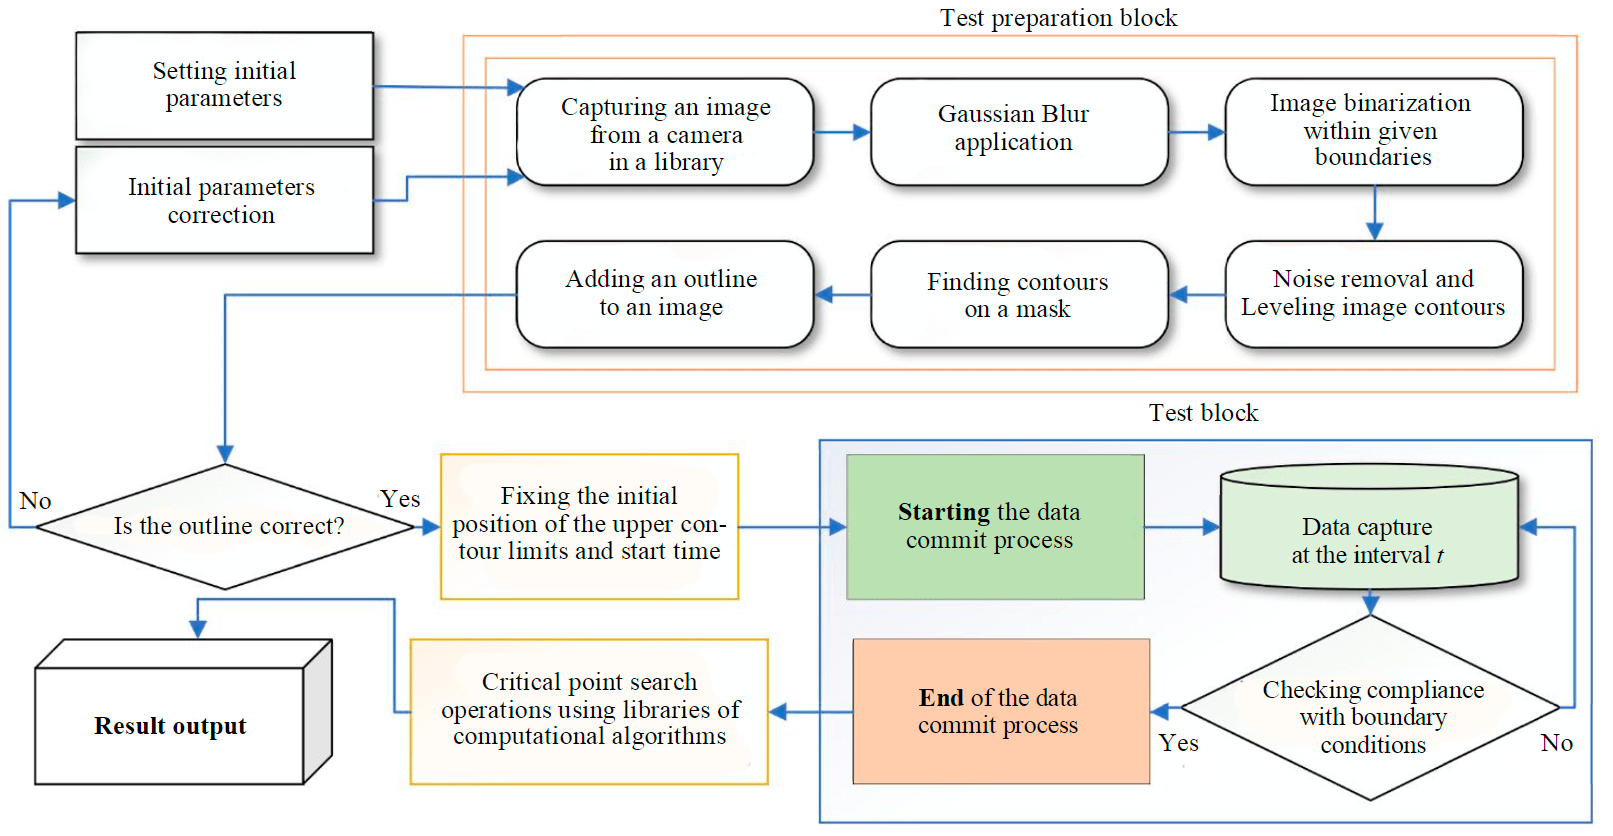
Fig.3. Algorithm of the developed software
At the next step, the binarized image – the mask – is subjected to morphological transformations to eliminate noise and small elements that arise due to light fluctuations and when working with the image. Two algorithms are successively applied to the resulting mask: erosion and dilation. The idea of erosion is as follows: a square matrix of a given size with an odd number of elements iterates over each pixel of the image, assigning it a value of 1 or 0, depending on whether the condition is met.
If the central pixel of the matrix is surrounded only by pixels with a value of 1 within this matrix, it is also assigned the value 1, otherwise it acquires the value 0. This transformation allows you to remove small highlights in the binarized image, making the contours more even , which is required when determining the boundary between the clarified liquid and the deposited material. However, it becomes obvious that the zero value is also acquired by pixels on the border of large image elements, i.e. the contour dimensions are reduced in proportion to the size of the matrix used in the function. Therefore, to restore the true contours of objects, the dilatation method with the opposite principle of operation is used. A matrix of the same size, bypassing the pixels of the image, sets the point to 1 if at least one of the pixels in the matrix is 1. Thus, the size of the white areas increases, i.e. the true size of the observed object is restored, and due to the preliminary removal of noise, an increase in the noise area in the image is not observed (Fig.4).
The development program also solved the problem of finding the contour with the largest area (if there are several contours in the image). Since the contours are a continuous closed curve passing along the border of the black and white areas, in fact, a search is made for a white object on a black background. The resulting array of contours is sorted in decreasing order of allocated area, and only the first contour representing the pulp column is transmitted for further tracking. The resulting contour fits into a rectangle, the upper edge of which is subsequently used to track the position of the desired boundary. For convenience of perception by the user, the found contours are transferred to a color image (Fig.4).
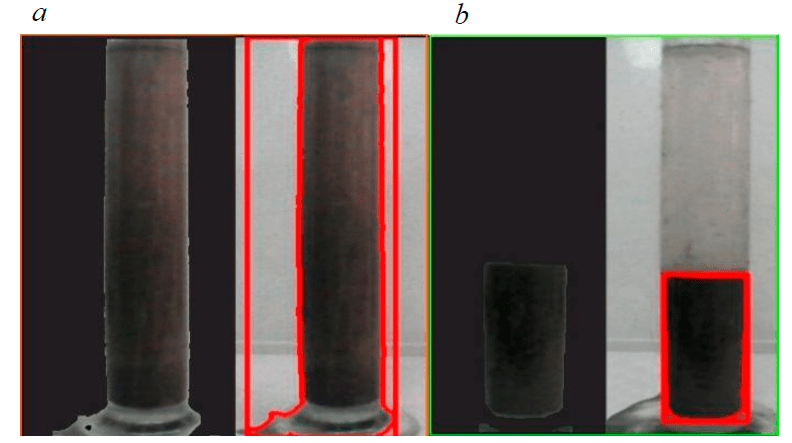
Fig.4. Masks and images with outline: a – mask with inaccurate color calibration; b – correctly calibrated mask
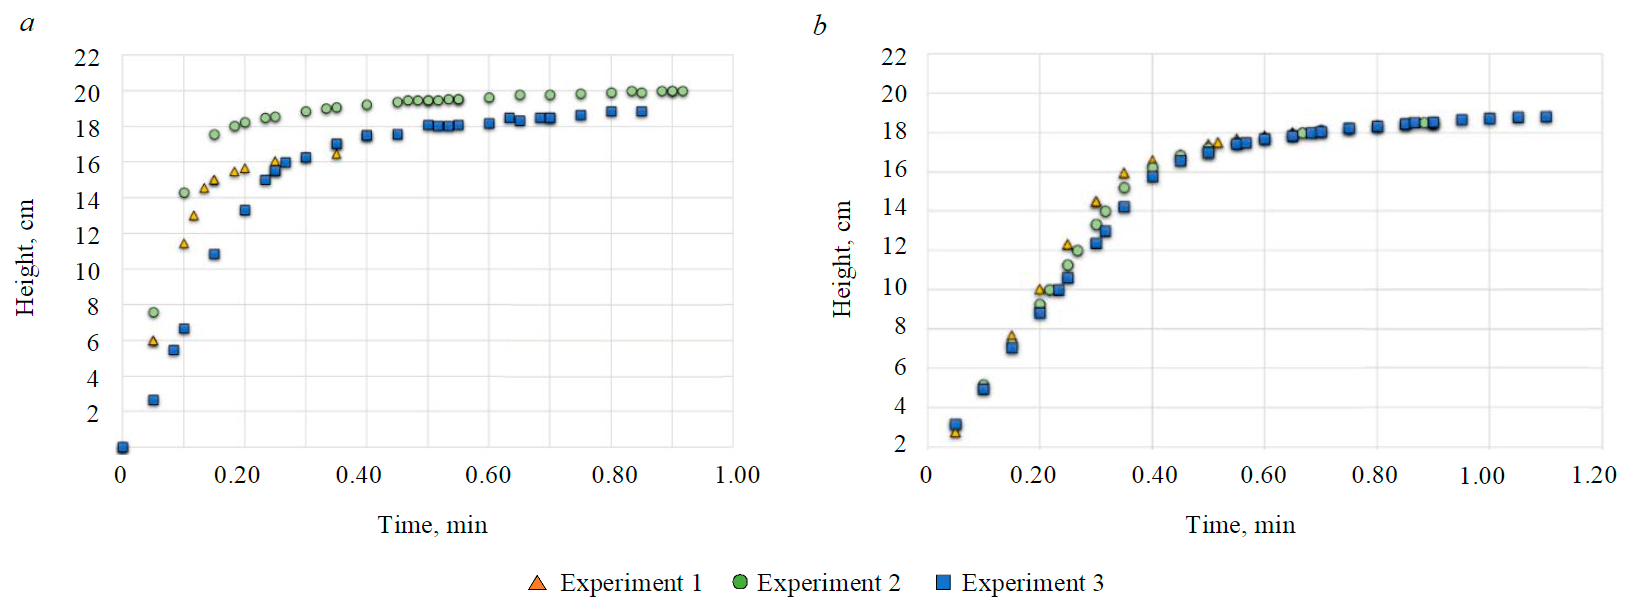
Fig.5. Initialized deposition curves for samples 1 (a) and 2 (b)
In order to check the reproducibility of the results for each sample, the experiment was repeated three times. The obtained sets of points for each of the experiments for samples 1 and 2 are shown in Fig.5.
The regression analysis of the data obtained made it possible to establish that for all samples in all experiments, the most appropriate Weibull model is the approximating model of this type [28-31]:
where h – clarified layer height, cm; t – settling time, min; a, b, c, d – empirical coefficients (see Table).
Weibull model empirical coefficients
|
Experiment number |
Empirical Coefficients |
Determination coefficient R2 |
Standard error |
|||
|
a |
b |
c |
d |
|||
|
Sample 1 |
||||||
|
1 |
16.29 |
16.27 |
43.37 |
1.52 |
0.9974 |
0.30 |
|
2 |
19.60 |
19.71 |
19.85 |
1.21 |
0.9932 |
0.35 |
|
3 |
18.36 |
18.58 |
12.68 |
1.41 |
0.9972 |
0.28 |
|
Sample 2 |
||||||
|
1 |
18.33 |
18.65 |
8.20 |
1.40 |
0.9976 |
0.35 |
|
2 |
18.56 |
18.40 |
6.44 |
1.36 |
0.9961 |
0.39 |
|
3 |
18.76 |
18.08 |
5.67 |
1.36 |
0.9964 |
0.34 |
Statistical analysis on three samples, carried out using the parametric Fisher and Bartlet test [32-34], showed statistical equality of variances in three experiments. This means that the differences in sample data are only due to random causes. Therefore, the program processes the results correctly, and this is statistically proven. Therefore, the true curve was further taken to be averaged from the results of the measurements.
Most of the methods used in practice for calculating thickeners (methods of Kinch, Biscay Jr., Talmadge and Fitch, Roberts, Coe – Clevenger and Altman [35, 36]) lies the finding of the so-called critical point, which is the transition from the sedimentation phase to the compression phase of the sediment. At this moment, the volume of the suspension is determined (according to the cylinder graduation), hcr and tcr, as well as the ratio of L:S at this moment, which is taken as the final one. Further thickening of the suspension is considered impractical, since the compaction of the suspension is very slow.
The coordinates of the critical point are determined by a graphical method, which causes errors and cannot be considered a reliable result. To solve this problem, when processing the obtained data, it is proposed to use a combination of the Weibull model and piecewise linear approximation. In the proposed approach, the following sequence of actions is performed:
- The sequence of points that were fixed during the experiment is approximated by a piecewise linear function. For the maximum capture of the deposition sedimentation and compression area, the approximating straight lines are selected automatically. After a piecewise linear approximation, data on the point of intersection of linear functions is returned, as well as their angular coefficients.
- The resulting slopes are used to determine the angles of rotation of the lines by calculating the arc tangent and determining the angle of rotation of the bisector. The angle between the abscissa axis and the bisector is calculated by adding the angles of two lines intersecting at a point, subtracting the value of π and dividing the result by 2. The number π is added to the sum, since the angles values in the calculation are in the range from −π/2 до π/2, and the desired bisector must have an angle in the range from 0 to −π/2. According to the calculated angle value, the bisector equation is determined.
- The same sequence of points is approximated by a continuous function.
- Using the equation of the bisector and the found Weibull function, you can find the coordinates of the point of their intersection, which will be the desired critical point.
Processing of the averaged curves (according to the height of the settled layer) is shown in Fig.6.
The final (or critical) liquefaction (L:S ratio by volume) at the moment tcr, based on the found coordinates of the critical point, can be determined in this way:
where R – radius of the cylinder used for deposition, m; Ms – mass of solid in the pulp, kg; ρ, Δ – solid and liquid phases density, respectively, kg/m3.
Specific settling rate at samples critical point
The results of calculations of the parameters of the thickening of the sample 1: tcr 0.39 min; hcr 15.37 cm; Rcr 1.46 cm; νcr 39.41 cm/min; samples 2: tcr 0.20 min; hcr 15.67 cm; Rcr 1.49 cm; νcr 78.35 cm/min.
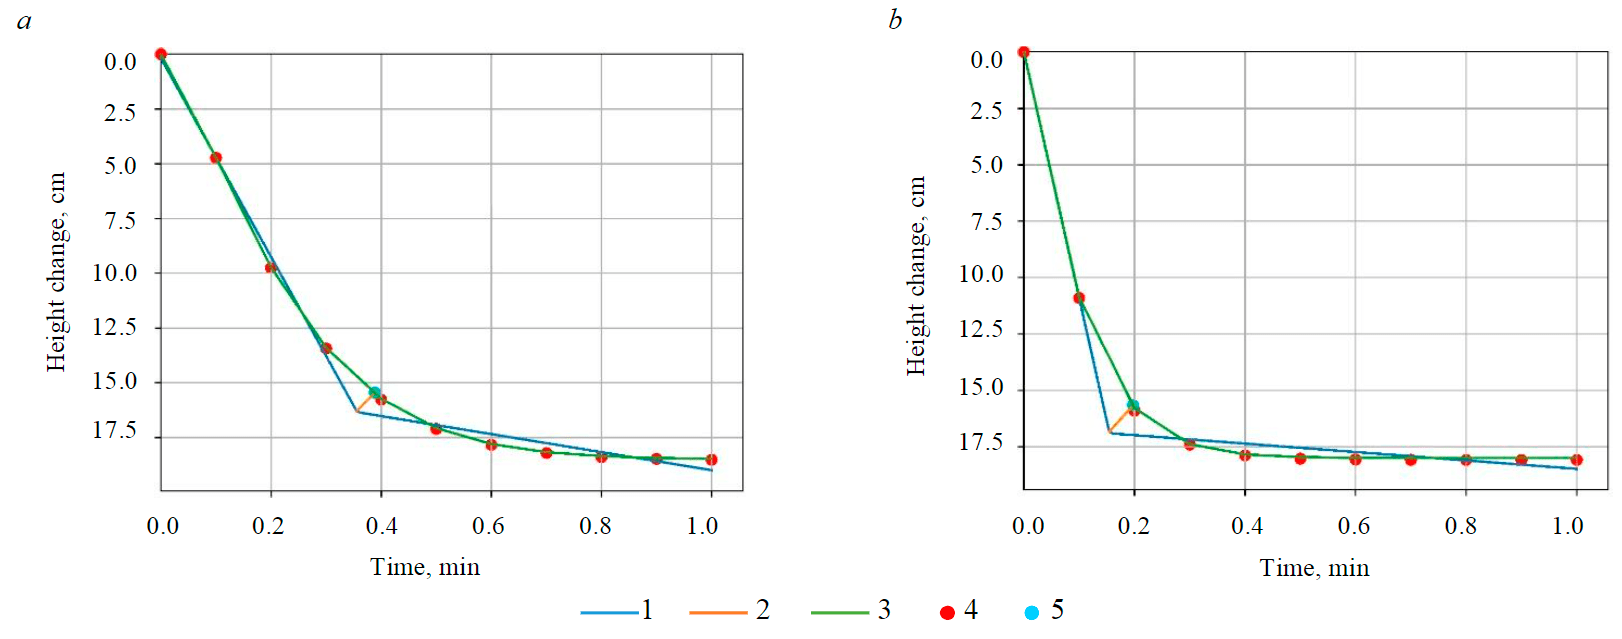
Fig.6. The results of determining the coordinates of the critical point for samples 1 (a) and 2 (b) 1 – piecewise linear approximation; 2 – bisector; 3 – approximation by the Weibull function; 4 – experimental data; 5 – critical point
To speed up the process, the final dilution is maintained above the critical value, for which a point on the curve corresponding to the required dilution can be determined instead of the critical point. Then, with the required dilution, the value h is calculated.
Conclusion
As a result of the study, an automated software solution was proposed using machine vision technology for testing in cylinders and calculating the main parameters in the design of thickening and clarification apparatus. The possibility of fine tuning for specific test conditions eliminates the need for specialized equipment.
It has been established that the obtained deposition curves are approximated by the Weibull model, the use of which, together with the piecewise linear approximation, makes it possible to find the coordinates of the critical point and other parameters with sufficient accuracy.
Despite the lack of a unified approach to the design of devices for gravitational settling, the test for deposition in cylinders is de facto generally recognized and depends to a greater extent on the experience and qualifications of the researcher. The developed software and methodical approach to the calculation make it possible to minimize the human factor and obtain reliable results.
Conducted studies prove that the proposed solution is capable of capturing data even at high deposition rates. In the study of pulps without a clear separation boundary, the algorithms embedded in the processing unit, due to morphological operations of background subtraction, allow fixing the slightest changes in the color gamut and determining the phase boundary.
Machine vision technologies for enrichment processes are undergoing a phase of rapid development, and this example shows only one of the possible ways of development. The proposed approach, after appropriate adaptation, can be used to test new types of flocculants and coagulants without conducting full-scale tests, which is relevant in conditions of certain types of reagents shortage. This area of application is not the only one, and the approach can be adapted to control the foam-pulp phases in flotation enrichment, as well as in the study of various ores for enrichability.
References
- Litvinenko V., Bowbriсk I., Naumov I., Zaitseva Z. Global guidelines and requirements for professional competencies of natural resource extraction engineers: Implications for ESG principles and sustainable development goals. Journal of Cleaner Production. 2022. Vol. 338. N 130530. DOI: 10.1016/j.jclepro.2022.130530
- Romasheva N., Dmitrieva D. Energy Resources Exploitation in the Russian Arctic: Challenges and Prospects for the Sustainable Development of the Ecosystem. Energies. 2021. Vol. 14. N 8300. DOI: 10.3390/en14248300
- Boyko N.A., Chvileva T.A., Romasheva N.V. The impact of coal companies on the socio-economic development of coal mining regions and its assessment. Ugol’. 2019. N 11, p. 48-53 (in Russian). DOI: 10.18796/0041-5790-2019-11-48-53
- Diaz P., Salas J.C., Cipriano A., Núnez F. Random forest model predictive control for paste thickening. Minerals Engineering. 2021. Vol. 163. N 106760. DOI: 10.1016/j.mineng.2020.106760
- Cacciuttolo C., Holgado A. Management of Paste Tailings in Chile: A Review of Practical Experience and Environmental Acceptance. PASTE 2016 – Proceedings of the 19th International Seminar on Paste and Thickened Tailings, 5-8 July 2016, Santiago, Chile, 2016, р. 1-15.
- Aleksandrova T.N., O’Connor C. Processing of platinum group metal ores in Russia and South Africa: current state and prospects. Journal of Mining Institute. 2020. Vol. 244, p. 462-473. DOI: 10.31897/PMI.2020.4.9
- Bauman A.V. Concentrating plants thickening circuits and return water systems design problem areas. Obogashchenie rud. 2016. N 3, p. 58-62 (in Russian). DOI: 10.17580/or.2016.03.10
- Kirnarskiy A.S. The Coe-Clevenger Equation and the Development of Water and Sludge Management Technology at Coal Concentration Plants. Ugol' Ukrainy. 2016. N 6-7, p. 62-66 (in Russian).
- Concha F., Segovia J.P., Vergara S. et al. Audit industrial thickeners with new on-line instrumentation. Powder Technology. 2017. Vol. 314, p. 680-689. DOI: 10.1016/j.powtec.2017.03.040
- Betancourt F., Concha F., Uribe L. Settling velocities of particulate systems part 17. Settling velocities of individual sphe-rical particles in Power-Law non-Newtonian fluids. International Journal of Mineral Processing. 2015. Vol. 143, p. 125-130.DOI: 10.1016/j.minpro.2015.07.005
- Segovia J.P., Concha F., Sbarbaro D. On the control of sludge level and underflow concentration in industrial thickeners.18th IFAC World Congress, 28 August – 2 September 2011, Milano, Italy. IFAC Proceedings Volumes. 2011. Vol. 44. Iss. 1, p. 8571-8576. DOI: 10.3182/20110828-6-IT-1002.02667
- Fedorova E.R., Vasileva N.V., Pupysheva E.A. Algorithm to distribute feed pulp between paralleled thickeners during red-sludge thickening and washing in alumina production. Journal of Physics: Conference Series. 2019. Vol. 1333. Iss. 4. N 042007.DOI: 10.1088/1742-6596/1333/4/042007
- Khaynikke F., Libervirt Kh., Kyunel' R., Aleksandrova T.N. The advantage of selective grinding with high-pressure roller presses in combination with pneumatic classification. Obogashchenie rud. 2022. N 1, p. 3-7. DOI: 10.17580/or.2022.01.01
- Grabsch A.F., Yahyaei M., Fawell P.D. Number-sensitive particle size measurements for monitoring flocculation responses to different grinding conditions. Minerals Engineering. 2020. Vol. 145. N 106088. DOI: 10.1016/j.mineng.2019.106088
- Heras de las J.L.B., Gutiérrez-Lavín A., Mahamud-López M.M. et al. Towards a Unified Model on the Description and Design of Process Operations: Extending the concept of Separation Units to Solid-fluid Sedimentation. Recent Innovations in Chemical Enginee-ring (Formerly Recent Patents on Chemical Engineering). 2019. Vol. 12. Iss. 1, p. 15-53. DOI: 10.2174/2405520412666181123094540
- François P., Locatelli F., Laurent J., Bekkour K. Experimental study of activated sludge batch settling velocity profile. Flow Measurement and Instrumentation. 2016. Vol. 48, p. 112-117. DOI: 10.1016/j.flowmeasinst.2015.08.009
- McCoy J.T., Auret L. Machine learning applications in minerals processing: A review. Minerals Engineering. 2019. Vol. 132, p. 95-109. DOI: 10.1016/j.mineng.2018.12.004
- Zhukovskiy Y.L., Kovalchuk M.S., Batueva D.E., Senchilo N.C. Development of an algorithm for regulating the load sche-dule of educational institutions based on the forecast of electric consumption within the framework of application of the demand response. Sustainability. 2021. Vol. 13 (24). N 13801. DOI: 10.3390/su132413801
- Mashevskiy G.N., Ushakov E.K., Yakovleva T.A. Digital technology for optimizing the sodium sulphide dosage during copper ore flotation. Obogashchenie rud. 2016. N 3, p. 18-33 (in Russian). DOI: 10.17580/or.2021.03.04
- Boikov A.V., Payor V.A., Savelev R.V. Technical vision system for analysing the mechanical characteristics of bulk materials. Journal of Physics: Conference Series. 2018. Vol. 944. N 012021. DOI: 10.1088/1742-6596/944/1/012021
- Bahmani-Ghaedi A., Hassanzadeh A., Sam A., Entezari-Zarandi A. The effect of residual flocculants in the circulating water on dewatering of Gol-e-Gohar iron ore. Minerals Engineering. 2022. Vol. 179. N 107440. DOI: 10.1016/j.mineng.2022.107440
- Lianfu Zhang, Hongjiang Wang, Aixiang Wu et al. A zone settling velocity function to characterize settling properties of suspensions in thickening applications. Minerals Engineering. 2022. Vol. 177. N 107386. DOI: 10.1016/j.mineng.2021.107386
- Dubey A., Patra A.S., Sarkar A.N. et al. Synthesis of a copolymeric system and its flocculation performance for iron ore tailings. Minerals Engineering. 2021. Vol. 165. N 106848. DOI: 10.1016/j.mineng.2021.106848
- Leite A.M.C., Reis É.L. Cationic starches as flocculants of iron ore tailing slime. Minerals Engineering. 2020. Vol. 148. N 106195. DOI: 10.1016/j.mineng.2020.106195
- Chernigov D.A., Bogorodskiy A.V., Nabiulin R.N., Mineeva T.S. Research into thickening processes of concentrates of gold-bearing ores. iPolytech Journal. 2021. Vol. 25. N 3, p. 391-401 (in Russian). DOI: 10.21285/1814-3520-2021-3-391-401
- Aleksandrova T.N., Kuznetsov V.V., Ivanov E.A. Investigation of the water hardness ions impact on the copper-nickel ores flotation probability. Mining Informational and Analytical Bulletin. 2022. N 6-1, p. 263-278 (in Russian). DOI: 10.25018/0236_1493_2022_61_0_263
- Gurman M.A., Aleksandrova T.N., Shcherbak L.I. Flotation beneficiation of low-grade gold- and carbon-bearing ore. Gornyy zhurnal. 2017. N 2, p. 70-74 DOI: 10.17580/gzh.2017.02.13
- Puri S., Verma A. Color removal from secondary treated pulp & paper industry effluent using waste driven Fe–TiO2 composite. Chemosphere. 2022. Vol. 303. Part 3. N 135143. DOI: 10.1016/j.chemosphere.2022.135143
- Yugen Li, Huimei Zhang, Min Chen et al. Strength criterion of rock mass considering the damage and effect of joint dip angle. Scientific Reports. 2022. Vol. 12. N 2601. DOI: 10.1038/s41598-022-06317-1
- Xianliang Wang, Jianhai Zhang, Li Qian et al. Nonlinear statistical damage constitutive model of granite based on the energy dissipation ratio. Scientific Reports. 2022. Vol. 12. N 5460. DOI: 10.1038/s41598-022-09503-3
- Oliveira Ferreira de D.J., Mattos Fiuza de M.P., Cardoso M., Oliveira de I.M. Use of the Weibull model on sizing thickeners – Part I: Sedimentation curve representation. The Canadian Journal of Chemical Engineering. 2021. Vol. 99. Iss. 3, p. 708-724.DOI: 10.1002/cjce.23904
- Larsson R. Bartlett correction of an independence test in a multivariate Poisson model. Statistica Neerlandica. 2022, p. 1-27. DOI: 10.1111/stan.12265
- Sorokina I.I., Astahov M.V., Slavkina E.V. Statistical Analysis of Test Results of Metal-Composite Compounds Under Action of Shear. International Conference on Industrial Engineering. Springer, Cham, 2021, p. 456-463. DOI: 10.1007/978-3-030-54814-8_54
- Cavalcanti A.B., Botter D.A., Barroso L.P. et al. Improved score tests for exponential family nonlinear models. Communications in Statistics – Theory and Methods. 2021. Vol. 50. Iss. 15, p. 3731-3745. DOI: 10.1080/03610926.2019.1710202
- Oliveira Ferreira de D.J., Galery R.,Cardoso M., Oliveira de I.M. Use of the Weibull model on sizing thickeners – Part II: Methods of thickener sizing. The Canadian Journal of Chemical Engineering. 2021. Vol. 99. Iss. 3, p. 708-724. DOI: 10.1002/cjce.24438
- Aixiang Wu, Zhuen Ruan, Jiandong Wang. Rheological behavior of paste in metal mines. International Journal of Minerals, Metallurgy and Materials. 2022. Vol. 29. N 4, p. 717-726. DOI: 10.1007/s12613-022-2423-6