Distribution of trace elements controlled by sector and growth zonings in zircon from a miaskite pegmatite of the Vishnegorsky massif, the Southern Urals
- 1 — Ph.D. Junior Researcher Institute of Precambrian Geology and Geochronology of the RAS ▪ Orcid
- 2 — Ph.D., Dr.Sci. Leading Researcher South Ural Federal Scientific Center of Mineralogy and Geoecology of the Ural Branch of the RAS ▪ Orcid
- 3 — Ph.D. Associate Professor Saint Petersburg Mining University ▪ Orcid
- 4 — Postgraduate Student Saint Petersburg Mining University ▪ Orcid

Abstract
Data on the content and distribution of trace and rare-earth elements (SIMS method) in sectors and growth zones of a large zircon crystal from miaskite pegmatites of the Vishnegogorsky massif are presented. The morphology of the zircon crystal is a combination of a dipyramid {111} and prism {010}. It has been established that the growth sector of dipyramid {111} is characterized by almost one order of magnitude higher contents of Y, Nb, REE, Th; higher Th/U and Eu/Eu* values; REE distribution spectra are flatter compared to prism {010} growth sector. A regular decrease in the content of trace and rare-earth elements in the direction from the central zone to the marginal zone of crystal growth was revealed. A smooth regression of zircon crystallization temperature of zircon from 960 °C in the central zone to 740 °C in the marginal zone of the dipyramid sector and 700-650 °C in the prism sector has been revealed, which may be a reflection of thermal evolution of the crystallization process. It is assumed that crystallization of the central zone of zircon occurred at early stages from a relatively trace-еlement-rich melt. The crystallization was completed at lower temperatures, probably, simultaneously with the formation of REE-concentrating minerals, which resulted in natural decrease of content of trace and rare-earth elements in the melt and, consequently, in zircon crystallizing from it.
None
Introduction
All minerals acquire a zonal and sectoral structure as they grow. Researchers explain the origin of sector zoning of crystals by differences in crystallization force, differences in relative growth rates of faces of different simple forms, correlation of crystal growth rate and diffusion of elements near the surface layer of the crystal lattice, and different adsorption of cations on the surface of faces of different simple forms. Existing models are based on the preferential adsorption of impurity elements by different faces of simple forms, the ratio of face growth rate, and the diffusion of impurity elements [1]. Numerous studies have been conducted to determine the relationship between zircon morphology and magma source [2], its chemical composition [3, 4], evolution and geological setting, as well as temperature and cooling rate [5, 6]. All models have been reproduced in laboratory growth systems, but the formation of zoning and sectors in natural zircon crystals remains poorly understood. Therefore, the study of crystals with sector and growth zonings is relevant.
A variety of rock-forming and accessory minerals, such as orthopyroxene [7], clinopyroxene [8], garnet [9], calcite [10], apatite [11], fluorite [12], xenotime and florencite [13, 14], columbite [15], beryl [16-18] have shown different composition within the crystal. Many studies have focused on zircon composition with pronounced growth and sector zoning within the crystal [2, 19, 20]. Given the importance of zircon for petrochronological studies [21], it is of particular importance to study its sectoral chemical heterogeneity within different simple forms. The redistribution of impurity elements between zones of different concentrations in zircon may affect the results of (U-Th)/He thermochronology models due to the non-uniform distribution of radiogenic He in zircon and its subsequent anisotropic diffusion. Variations in REE, Th, U, Pb content, and the Th/U ratio can influence the results of U-Th-Pb dating. Some authors [22] describe an example of such a zircon. The anisotropic diffusion of Ti in zircon in different crystallographic directions [23] negatively affects the reliability of the Ti-in-zircon thermometer [24].
A typical zircon crystal from pegmatite vein N 5 of the Vishnevogorsky massif is a suitable object for studying the composition of the growth sectors of different simple forms. According to the results of neutron radiography of zircon from pegmatite vein N 5 [25], all crystals of comparable size have the same zoning pattern: a similar number of zones and a sequence of alternating light and dark bands. Some differences can only be observed in the width of the zones and also in the zoning of the crystal rims. In addition, the zircon under study is characterized by pronounced zoning and sector zoning and has a large size. The nature and differences in the distribution of trace elements in the growth sectors of the tetragonal dipyramid {111} and tetragonal prism {010}, as well as various growth zones within each of the presented simple forms, were investigated. Although zircon from pegmatites of the Vishnevogorsky massif has been extensively studied, modern local analysis of trace elements distribution by sectors of crystals has not been applied.
Methods
Zircon samples were prepared according to the method, described in [26]. A zircon crystal was cut along the elongation axis L4 [001] and embedded in an epoxy resin. An approximate central cross-section of the crystal was brought to the surface of the sample. Cathodoluminescence (CL) imaging of zircon was carried out on a CamScan MX2500S scanning electron microscope equipped with a CLI/QUA 2 detector (CIR VSEGEI). The composition and distribution of major elements in zircon and the presence and composition of mineral phase inclusions were studied using a back-scattered electron microscope JEOL JSM-6510LA with ED spectrometer JED-2200 (IPGG RAS). The REE and rare elements content in zircon was determined by the SIMS on the Cameca IMS-4f ion microprobe (YB IRT RAS) according to the method described by several researches [27, 28]. The detection accuracy is 10-15 % for elements above 1 ppm and 10-20 % for elements with a concentration of 0.1-1 ppm, with a detection limit of 5-10 ppb and a crater size of approximately 20 µm. When constructing the REE distribution spectra, the composition of zircon was normalized to the composition of chondrite CI [29]. The zircon crystallization temperature was calculated using a Ti-in-zircon thermometer [24].
A total of 35 local analyses of trace and rare-earth element content were carried out. From them 20 points are located within the growth sector of the prism {010}, 15 points belong to the growth sector of the dipyramid {111}, analytical points 4, 5, 29 belong to the zone of ambiguous crystallographic form – the zone of overgrowing of the cavity inside the growth sector of the dipyramid (Fig.1).
Geological settings
The Ilmeno-Vishnevogorsky alkaline-carbonatite complex is located at the junction of the Middle and Southern Urals in the core of the Sysert-Ilmenogorsky anticlinorium, which has a two-storey structure and a long formation history. The Ilmeno-Vishnevogorsky complex, stretching from north to south for more than 150 km with a maximum width of 4-6 km, consists of two massifs, the Vishnevogorsky and Ilmenogorsky (Fig.2). The massifs are connected by a central alkaline band, which is represented by fenites, feldspar metasomatites, carbonatites, and miaskitic bodies.
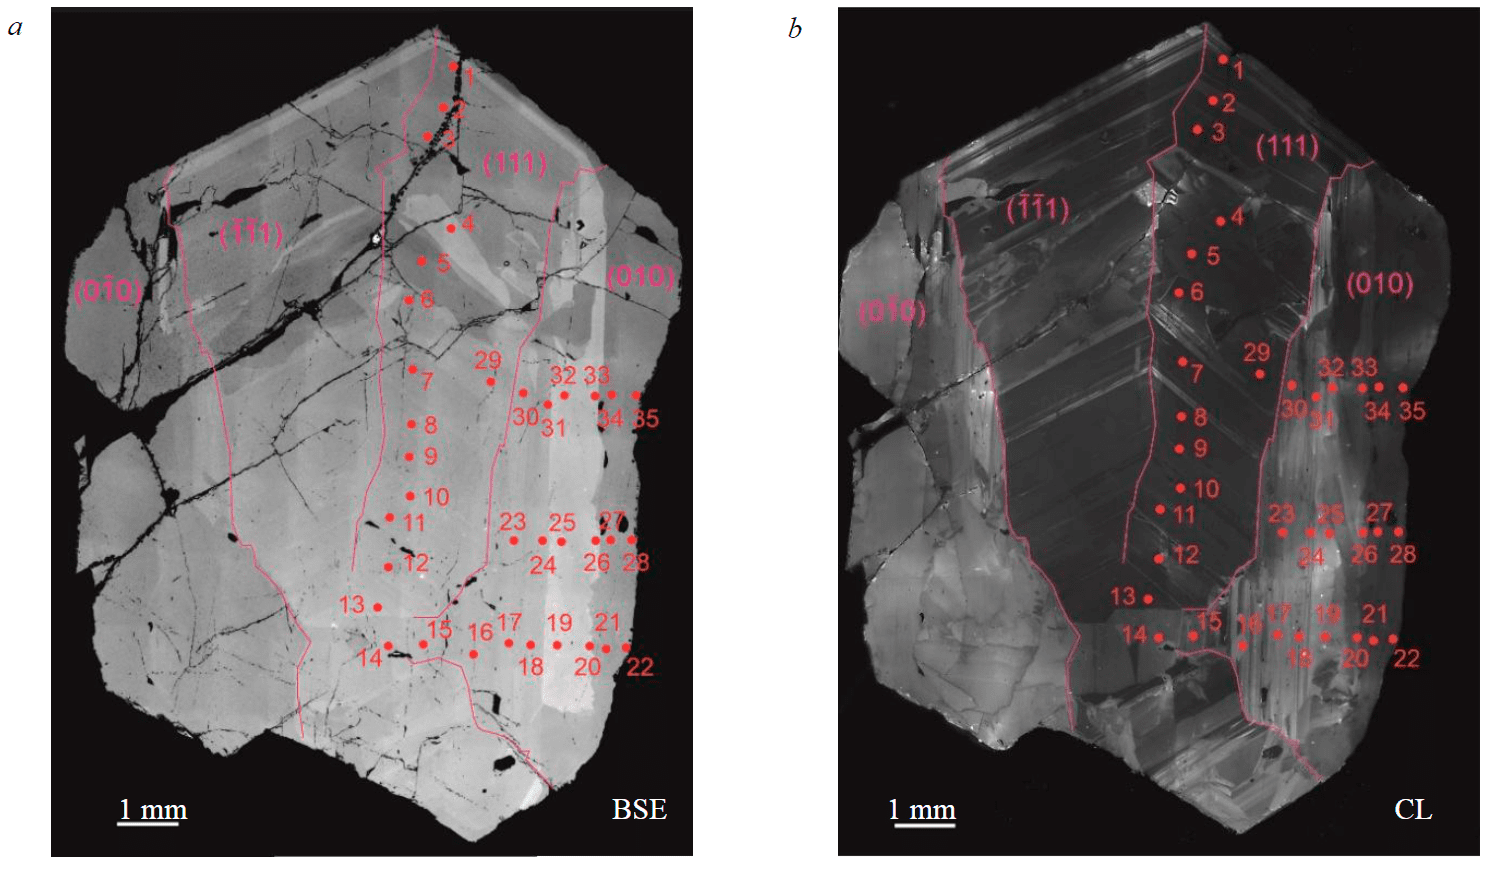
Fig.1. BSE (a) and CL (b) images of a zircon crystal from miaskitic pegmatites of the Vishnevogorsky Massif with applied analytical points (numbers correspond to the table). The lines indicate the boundaries of the growth sectors of simple forms
The Vishnevogorsky massif extends in submeridional direction for 25 km, with a width of 4 km. The massif occurs in metamorphic rocks of the Riphean Ilmenogorsk sequence (gneisses, shales, amphibolites, and quartzites). In the endocontact zone, the rocks of the Vishnevogorsky massif are fenitized to varying degrees. The main body of the massif is composed of biotitic two-feldspar nepheline syenites (miaskites), which consist of microcline-perthite, nepheline, and acidic plagioclase (oligoclase-albite, and albite), and ferruginous biotite with an admixture of calcite. Ilmenite, magnetite, zircon, and apatite occur among the accessory minerals. Secondary minerals are represented by albite, sericite, cancrinite, analcime, sodalite, and natrolite. The predominant rocks are light-gray medium-grained miaskites with coarse- and fine-grained variations of a patchy-striped texture. Lenticular bodies of alkaline pegmatites up to 0.5-1.0 m thick are widespread among the miaskites. The rocks are biotite-bearing feldspar-nepheline and nepheline-cancrinite-feldspar varieties and often contain cancrinite, vishnevite, sodalite, and natrolite. The accessory minerals are ilmenite, zircon, pyrochlore, magnetite, titanite, fluorapatite, pyrrhotite, chalcopyrite, pyrite, and molybdenite. The chemical composition of the main rocks of the Vishnevogorsky Massif (miaskites and carbonatites) and the distribution of rare-earth elements in them are described in [30].
The zircon under study belongs to pegmatite vein N 5. Previously zircon and pyrochlore were mined in this area. The vein is about one meter thick, reaches six meters in some places, the contact with the miaskites is sharp, and there are no signs of miaskites alteration at the contact with the veins. Layered or crosscutting pegmatite apophyses in miaskite are typical, as well as small individual lenticular segregations of pegmatite in miaskite [25]. The pegmatite bodies consist of medium-grained nepheline-microcline aggregate with areas of coarse-grained microcline. The rocks contain potassium feldspar, nepheline, albite, biotite, zeolites, and calcite. Pegmatite bodies have different structures. There are zonal bodies with an aplite-shaped peripheral zone (up to 0.1 m) and a zone of the graphic structure of nepheline with feldspar (0.5-1 m) and a microcline core [31]. Some cavities are along the periphery and composed of faceted microcline crystals with ilmenite, zircon, and pyrochlore, located mainly at the base of the druse. Inside the cavities, there is a loose brown-black mass (resulting from the dissolution of calcite), in which there are partially faceted crystals of ilmenite, zircon, annite, fluorapatite, and pyrochlore [31].
Distribution of trace and rare-earth elements in zircon from miaskitic pegmatite of the Vishnevogorsky massif, ppm
|
Components |
Dipyramid (111) |
Ambiguous zone |
Prism (010) |
||||||||||||||||||||||||||||||||
|
1 |
2 |
3 |
6 |
7 |
8 |
9 |
10 |
11 |
12 |
13 |
14 |
4 |
5 |
29 |
15 |
16 |
17 |
18 |
19 |
20 |
21 |
22 |
23 |
24 |
25 |
26 |
27 |
28 |
30 |
31 |
32 |
33 |
34 |
35 |
|
|
La |
0.10 |
0.07 |
0.06 |
0.08 |
0.08 |
0.08 |
0.11 |
0.27 |
0.38 |
0.59 |
0.87 |
0.47 |
0.03 |
0.05 |
0.03 |
0.44 |
0.15 |
0.04 |
0.05 |
0.02 |
0.04 |
0.09 |
0.03 |
0.03 |
0.05 |
0.07 |
0.02 |
0.04 |
0.08 |
0.05 |
0.04 |
0.05 |
0.05 |
0.04 |
0.01 |
|
Ce |
8.70 |
3.92 |
3.07 |
1.38 |
2.61 |
8.24 |
8.09 |
14.9 |
17.5 |
27.7 |
38.5 |
14.6 |
0.30 |
0.71 |
0.20 |
15.5 |
1.80 |
0.24 |
0.28 |
0.33 |
0.43 |
0.76 |
0.50 |
0.19 |
0.32 |
0.30 |
0.32 |
0.55 |
0.61 |
0.20 |
0.29 |
0.40 |
0.44 |
0.54 |
0.50 |
|
Pr |
0.51 |
0.13 |
0.08 |
0.03 |
0.07 |
0.49 |
0.46 |
1.02 |
1.23 |
2.23 |
3.36 |
1.69 |
0.01 |
0.02 |
0.02 |
1.76 |
0.08 |
0.02 |
0.01 |
0.01 |
0.01 |
0.02 |
0.01 |
0.02 |
0.01 |
0.01 |
0.03 |
0.01 |
0.01 |
0.01 |
0.01 |
0.02 |
0.01 |
0.01 |
0.01 |
|
Nd |
6.40 |
2.09 |
1.48 |
0.37 |
1.12 |
6.37 |
5.66 |
10.5 |
11.1 |
25.1 |
34.1 |
17.8 |
0.07 |
0.08 |
bdl |
17.5 |
0.96 |
0.05 |
0.06 |
0.02 |
0.09 |
0.06 |
0.02 |
0.05 |
0.06 |
0.07 |
0.08 |
0.05 |
0.03 |
0.03 |
0.11 |
0.04 |
0.07 |
0.02 |
0.04 |
|
Sm |
6.23 |
3.20 |
2.28 |
0.76 |
1.66 |
5.77 |
5.76 |
8.30 |
8.86 |
19.6 |
24.0 |
13.9 |
0.05 |
0.09 |
0.05 |
13.0 |
1.30 |
0.07 |
0.05 |
0.07 |
0.18 |
0.16 |
0.06 |
0.11 |
0.07 |
0.17 |
0.08 |
0.08 |
0.07 |
0.06 |
0.14 |
0.12 |
0.22 |
0.04 |
0.05 |
|
Eu |
3.00 |
1.86 |
1.39 |
0.52 |
1.17 |
2.62 |
2.59 |
3.55 |
4.01 |
8.36 |
10.2 |
6.28 |
0.01 |
0.01 |
bdl |
5.72 |
0.77 |
0.04 |
0.02 |
0.03 |
0.09 |
0.09 |
0.02 |
0.06 |
0.04 |
0.08 |
0.04 |
0.03 |
0.02 |
0.03 |
0.09 |
0.05 |
0.10 |
0.01 |
0.02 |
|
Gd |
17.4 |
11.8 |
8.99 |
5.47 |
9.07 |
14.6 |
14.3 |
19.9 |
21.8 |
43.8 |
50.8 |
33.5 |
0.05 |
0.11 |
0.05 |
32.0 |
6.81 |
0.23 |
0.24 |
0.28 |
0.67 |
0.70 |
0.16 |
0.55 |
0.37 |
0.86 |
0.56 |
0.41 |
0.43 |
0.33 |
0.91 |
0.55 |
0.86 |
0.34 |
0.21 |
|
Dy |
44.4 |
32.0 |
27.6 |
22.9 |
29.8 |
36.9 |
39.0 |
48.4 |
51.3 |
84.6 |
97.8 |
76.8 |
0.37 |
0.87 |
0.41 |
71.0 |
62.2 |
1.95 |
1.69 |
2.29 |
3.65 |
3.79 |
1.63 |
3.80 |
2.34 |
4.64 |
3.18 |
2.14 |
2.08 |
2.15 |
4.82 |
3.56 |
5.12 |
1.99 |
1.55 |
|
Er |
63.1 |
48.6 |
47.1 |
40.9 |
48.7 |
54.7 |
57.3 |
69.6 |
73.8 |
102 |
113 |
93.2 |
1.01 |
2.22 |
1.17 |
95.7 |
175 |
5.18 |
4.41 |
6.69 |
9.36 |
11.1 |
4.67 |
10.0 |
6.82 |
11.6 |
9.19 |
6.20 |
6.27 |
6.4 |
13.14 |
8.56 |
15.3 |
5.79 |
4.64 |
|
Yb |
100 |
83.3 |
78.0 |
71.5 |
79.6 |
88.9 |
92.8 |
107 |
117 |
143 |
153 |
156 |
1.35 |
7.37 |
4.63 |
155 |
330 |
18.4 |
12.2 |
13.5 |
24.6 |
33.7 |
15.3 |
28.7 |
22.9 |
34.5 |
27.2 |
19.4 |
20.0 |
18.8 |
33.3 |
25.4 |
39.8 |
18.2 |
15.7 |
|
Lu |
15.0 |
11.6 |
11.0 |
10.8 |
12.4 |
13.4 |
13.5 |
15.7 |
16.2 |
20.8 |
22.4 |
22.8 |
0.67 |
1.22 |
0.57 |
23.2 |
54.0 |
2.66 |
2.30 |
2.96 |
4.35 |
5.42 |
2.37 |
5.02 |
3.40 |
5.82 |
4.74 |
3.30 |
3.52 |
3.31 |
5.65 |
3.93 |
6.71 |
3.10 |
2.41 |
|
Li |
0.05 |
0.02 |
0.02 |
0.01 |
0.02 |
0.04 |
0.05 |
0.02 |
0.05 |
0.06 |
0.15 |
0.07 |
0.004 |
0.004 |
0.002 |
0.04 |
0.01 |
0.002 |
0.002 |
0.004 |
0.004 |
0.002 |
0.004 |
0.001 |
0.002 |
0.003 |
0.002 |
0.003 |
0.004 |
0.002 |
0.002 |
0.002 |
0.003 |
0.003 |
0.003 |
|
P |
69.9 |
29.4 |
20.9 |
16.9 |
200 |
114 |
9.38 |
34.8 |
94.6 |
138 |
213 |
454 |
85.9 |
143 |
0.28 |
433 |
225 |
bdl |
95.9 |
31.7 |
73.1 |
bdl |
29.3 |
39.5 |
11.0 |
65.3 |
55.3 |
28.7 |
38.8 |
102.3 |
74.2 |
142 |
50.2 |
89.4 |
bdl |
|
Ca |
22.3 |
8.89 |
11.1 |
7.63 |
9.96 |
9.96 |
7.25 |
4.65 |
14.5 |
54.8 |
88.3 |
89.5 |
7.55 |
7.40 |
4.09 |
109 |
7.25 |
3.50 |
6.24 |
5.33 |
5.56 |
1.19 |
3.31 |
2.59 |
2.55 |
7.15 |
3.19 |
3.26 |
5.96 |
3.89 |
2.44 |
4.16 |
3.26 |
4.32 |
4.14 |
|
Ti |
27.2 |
14.7 |
13.4 |
9.28 |
12.3 |
21.2 |
22.3 |
40.2 |
49.7 |
61.4 |
75.8 |
15.2 |
3.36 |
4.32 |
3.05 |
26.3 |
9.28 |
3.17 |
2.97 |
3.53 |
4.39 |
6.60 |
3.18 |
3.42 |
3.54 |
3.61 |
3.65 |
3.42 |
3.40 |
3.24 |
3.51 |
4.23 |
4.07 |
3.31 |
3.24 |
|
Sr |
1.00 |
0.68 |
1.28 |
1.17 |
1.08 |
0.52 |
0.74 |
0.71 |
0.95 |
1.08 |
1.40 |
0.96 |
1.43 |
0.54 |
0.62 |
0.93 |
0.85 |
0.78 |
0.81 |
1.13 |
1.07 |
0.37 |
0.48 |
0.48 |
0.40 |
0.25 |
0.93 |
0.53 |
0.52 |
0.71 |
0.58 |
0.95 |
0.64 |
0.24 |
0.41 |
|
Y |
323 |
246 |
229 |
194 |
242 |
287 |
285 |
358 |
393 |
578 |
651 |
507 |
7.28 |
12.9 |
5.92 |
512 |
679 |
22.8 |
18.8 |
29.4 |
40.4 |
50.0 |
21.4 |
42.6 |
27.8 |
48.8 |
40.6 |
28.6 |
28.3 |
25.4 |
49.3 |
38.1 |
59.1 |
27.3 |
21.6 |
|
Nb |
324 |
166 |
162 |
80.9 |
108 |
195 |
218 |
483 |
603 |
576 |
785 |
199 |
77.9 |
52.4 |
11.8 |
225 |
32.6 |
16.6 |
23.0 |
19.4 |
21.9 |
22.4 |
13.5 |
14.9 |
15.4 |
13.9 |
19.8 |
16.2 |
12.1 |
13.2 |
8.7 |
12.6 |
13.8 |
12.9 |
14.8 |
|
Ba |
2.00 |
1.69 |
1.50 |
1.35 |
2.02 |
1.97 |
1.33 |
1.21 |
1.09 |
2.15 |
1.65 |
1.73 |
0.63 |
0.78 |
0.94 |
1.69 |
0.30 |
0.63 |
0.67 |
1.73 |
0.90 |
1.08 |
0.98 |
0.76 |
0.90 |
0.93 |
1.27 |
0.88 |
1.58 |
1.41 |
1.05 |
1.56 |
0.90 |
1.63 |
0.86 |
|
Hf |
16365 |
14829 |
15422 |
16343 |
13943 |
12640 |
14151 |
14640 |
13847 |
13015 |
15441 |
15756 |
22073 |
9801 |
16292 |
12056 |
13800 |
18573 |
14726 |
25222 |
20993 |
9231 |
7706 |
16571 |
14499 |
16834 |
22239 |
8267 |
7916 |
17143 |
15314 |
23688 |
22294 |
7945 |
7692 |
|
Th |
98.4 |
67.7 |
59.8 |
31.8 |
48.7 |
79.2 |
83.0 |
137 |
164 |
494 |
621 |
216 |
0.58 |
1.27 |
0.38 |
137 |
17.7 |
0.36 |
0.43 |
0.71 |
1.98 |
1.72 |
1.75 |
0.72 |
0.65 |
1.30 |
0.89 |
1.18 |
1.44 |
0.49 |
1.06 |
1.42 |
1.28 |
1.07 |
1.67 |
|
U |
1.15 |
1.01 |
0.81 |
0.74 |
0.89 |
0.86 |
0.74 |
1.00 |
1.14 |
0.93 |
1.24 |
0.80 |
1.35 |
0.42 |
0.41 |
0.76 |
0.50 |
0.54 |
0.61 |
0.94 |
0.79 |
0.31 |
0.70 |
0.59 |
0.46 |
0.72 |
0.85 |
0.53 |
0.82 |
0.77 |
0.44 |
0.94 |
0.82 |
0.56 |
0.77 |
|
Th/U |
85.4 |
67.2 |
73.7 |
42.9 |
54.7 |
92.3 |
112 |
137 |
144 |
532 |
500 |
270 |
0.42 |
3.04 |
0.92 |
182 |
35.4 |
0.65 |
0.71 |
0.76 |
2.51 |
5.59 |
2.51 |
1.23 |
1.43 |
1.81 |
1.06 |
2.21 |
1.76 |
0.64 |
2.44 |
1.51 |
1.55 |
1.92 |
2.17 |
|
Eu/Eu* |
0.88 |
0.92 |
0.94 |
0.78 |
0.92 |
0.87 |
0.87 |
0.84 |
0.88 |
0.87 |
0.89 |
0.89 |
0.45 |
0.36 |
– |
0.86 |
0.79 |
0.86 |
0.46 |
0.72 |
0.77 |
0.80 |
0.59 |
0.73 |
0.82 |
0.63 |
0.50 |
0.51 |
0.27 |
0.69 |
0.78 |
0.60 |
0.69 |
0.38 |
0.48 |
|
Ce/Ce* |
9.19 |
9.63 |
10.8 |
6.66 |
8.67 |
9.97 |
8.80 |
6.92 |
6.21 |
5.84 |
5.47 |
3.95 |
3.70 |
5.68 |
2.33 |
4.27 |
4.06 |
1.97 |
3.89 |
4.85 |
4.79 |
4.16 |
5.91 |
2.26 |
3.95 |
2.62 |
3.05 |
6.56 |
5.63 |
1.85 |
3.21 |
3.33 |
4.18 |
5.79 |
11.5 |
|
ΣREE |
265 |
199 |
181 |
155 |
186 |
232 |
240 |
300 |
323 |
477 |
548 |
438 |
3.91 |
12.8 |
7.12 |
431 |
634 |
28.9 |
21.3 |
26.2 |
43.5 |
55.9 |
24.7 |
48.6 |
36.4 |
58.1 |
45.5 |
32.3 |
33.1 |
31.3 |
58.5 |
42.7 |
68.7 |
30.1 |
25.2 |
|
ΣLREE |
15.7 |
6.22 |
4.70 |
1.86 |
3.88 |
15.2 |
14.3 |
26.8 |
30.3 |
55.6 |
76.8 |
34.6 |
0.41 |
0.87 |
0.25 |
35.3 |
2.99 |
0.34 |
0.40 |
0.39 |
0.57 |
0.94 |
0.57 |
0.28 |
0.44 |
0.45 |
0.44 |
0.66 |
0.72 |
0.30 |
0.46 |
0.51 |
0.57 |
0.61 |
0.56 |
|
ΣHREE |
240 |
187 |
173 |
152 |
180 |
208 |
217 |
261 |
280 |
393 |
437 |
383 |
3.44 |
11.8 |
6.82 |
377 |
629 |
28.4 |
20.9 |
25.7 |
42.7 |
54.7 |
24.1 |
48.1 |
35.9 |
57.4 |
44.9 |
31.5 |
32.3 |
30.9 |
57.9 |
42.0 |
67.8 |
29.4 |
24.6 |
|
LuN/LaN |
1393 |
1530 |
1879 |
1228 |
1524 |
1574 |
1203 |
565 |
414 |
339 |
249 |
465 |
234 |
223 |
203 |
507 |
3482 |
677 |
482 |
1446 |
1040 |
588 |
757 |
1857 |
616 |
830 |
2004 |
720 |
423 |
630 |
1309 |
748 |
1354 |
767 |
2363 |
|
LuN/GdN |
6.95 |
8.00 |
9.88 |
16.0 |
11.0 |
7.37 |
7.65 |
6.39 |
6.03 |
3.84 |
3.56 |
5.51 |
113 |
87.2 |
101 |
5.9 |
64.2 |
91.7 |
77.4 |
85.0 |
52.3 |
62.7 |
121 |
73.4 |
73.7 |
55.0 |
67.9 |
65.6 |
67.0 |
82.0 |
50.3 |
57.7 |
63.0 |
73.0 |
93.8 |
|
SmN/LaN |
96.2 |
69.9 |
64.8 |
14.3 |
33.9 |
113 |
85.1 |
49.6 |
37.6 |
53.2 |
44.4 |
47.1 |
3.12 |
2.77 |
2.82 |
47.0 |
13.9 |
3.08 |
1.86 |
5.57 |
6.97 |
2.89 |
3.07 |
7.00 |
2.08 |
3.97 |
5.92 |
2.95 |
1.40 |
2.00 |
5.55 |
3.72 |
7.47 |
1.69 |
8.24 |
|
T(Ti),°C |
840 |
778 |
770 |
736 |
762 |
814 |
819 |
883 |
907 |
933 |
960 |
781 |
655 |
674 |
648 |
836 |
736 |
651 |
646 |
659 |
675 |
708 |
651 |
656 |
659 |
660 |
661 |
656 |
656 |
652 |
658 |
672 |
669 |
654 |
652 |
Note. bdl – below detection limit.
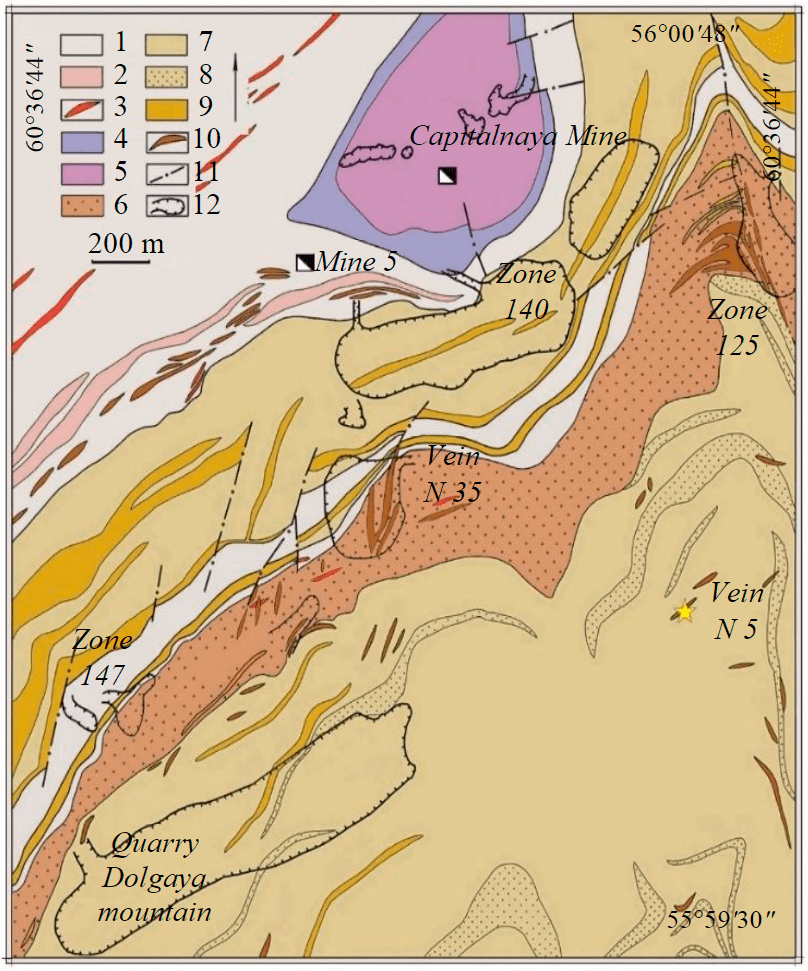
Fig.2. Northern part of the Vishnevy Mountains (according to [32] with amendments) 1 – gneisses, amphibolites and crystalline schists (PR1); 2 – veined granites (Pz1?); 3 – granitic pegmatites (Pz2-3?); 4, 5 – gabbroids (4) and serpentinites (5) of the Buldymsky massif (PR1); 6 – pyroxene, amphibole-pyroxene, and biotite-pyroxene fenites (Pz1); 7-9 – biotite (7), muscovitized (8) and albitized (9) miaskites with carbonatite zones (Pz1-2); 10 – miaskite and syenite pegmatites (Pz2); 11 – main faults; 12 – quarries outlines; the asterisk shows the place of zircon sampling
Zircon crystals in the veins are unevenly distributed. The color of the crystals is predominantly light brownish-gray, with a more intense color of the {111} face. On the cut, the zircon rims a few millimeters wide are almost transparent. According to [25], three morphological types of zircon crystals were distinguished within the vein: the predominant type is isometric dipyramidal crystals with a predominance of the {111}, {221}, and {100} forms; short-prismatic crystals with well-developed dipyramid {221}; short prismatic crystals with poorly developed dipyramid {221}.
Results
Morphology and internal structure of the crystal
The studied sample is a large zircon crystal 13 x 10 (8) mm in size (see Fig.1) and belongs to the third crystallographic type of zircon [25] – short columnar with weakly developed dipyramid {221}. The predominant simple forms are the tetragonal dipyramid {111} and the tetragonal prism {010}. The crystal is light brown, and the prism zones {010} are almost colorless (therefore translucent at depth) and contain small amounts of micro-inclusions, mainly rock-forming minerals.
Most zircon crystals from the miaskitic pegmatite vein N 5 of the Vishnevogorsky massif, including the studied one, have a high degree of spatial heterogeneity – zoning and sector growth. Zoning is expressed by the presence of zones with alternating layers of light- and dark-colored bands on BSE or CL images (see Fig.1). The zoning of the crystal under study is more contrasting in CL images. The light bands vary in thickness from 5-10 to 100-300 µm. The thickness of the dark bands is considerably bigger than the light ones and usually ranges from 80 to 700 µm. The sectoral growth is due to the presence of growth pyramids formed by the simultaneous growth of faces of different crystallographic forms.
The crystal under study has a complex internal structure. There is an asymmetry of growth pyramids and a change in the trajectory of the growth lines of the dipyramid top. The crystal can be divided into three zones by the change in the ratio of the dipyramid and prism growth sectors. Analytical points 12-15 are located in the central zone of the crystal, which occupies about 10 % of the entire cross-sectional area along the L4 axis. The length of the dipyramid faces is almost twice the length of the prism ones. Zoning is only observed in the CL image equally for the faces of the dipyramid and prism. Thin (5-10 µm) light bands on a dark background are also observed in CL image. The light bands have relatively constant thickness within both the dipyramid and the prism. The dark band within the prism is almost twice thicker.
The other internal zone occupies the greater part of the crystal cross-section – about 70 % (analytical points 1-11, 16-20, 23-26, 29-33). The length of the prism faces increases concerning the length of the dipyramid faces. The growth sectors of the prism differ from those of the dipyramid in a less contrasting zoning, but with increased frequency and thickness of the light bands in the CL. The edges of the prism and dipyramid sectors are blurred, which may indicate the partial dissolution of the original and the overgrowth of new prism faces. Within this zone in the growth pyramids <111> and <111-> there is an area where the crystallographic forms are difficult to define, represented as a growth sector of another simple form. These can be the signs of a tetragonal dipyramid growth sector <131>. For an accurate determination, additional studies (for example, tomography) are required. There are also areas of probably secondary overgrowth of <111> and <111-> faces (analytical points 4, 5, and 29), which are dark patches without zoning in CL (Fig.1, b).
The outer (rim) section of the zircon, which occupies about 30% of its entire cross-sectional area, shows a dramatic change in the shape of the crystal: the complete disappearance of the dipyramid growth sectors and active growth of the prism. Analytical points 21, 22, 27, 28, 34, and 35 belong to this area. The growth sectors <010> and <011-> in this section are characterized by traces of dissolution of neighboring faces and a complete lack of zoning.
General patterns of trace elements distribution in a crystal
The crystal under study is generally characterized by a low content of impurity elements. The Hf has the highest concentrations among them, as well as Y, Nb, REE, and P (see table). The Hf content varies from 7700 to 25000 ppm, averaging 15000 ppm per crystal. The Nb content ranges from 8 to 780 ppm, with an average value of 140 ppm. The total REE and Y content are at the same level, ranging from 4-630 ppm (mean value is 150 ppm) and 6-680 ppm (mean value is 190 ppm) respectively. The rare-earth composition of zircon is dominated by HREE with the content being an order of magnitude higher than that of LREE. The P content varies widely from 0.3 to 450 ppm. The contribution of other impurity elements to the composition of zircon is minimal. It is worth noting the very low content of U in zircon, usually not exceeding 1 ppm. The Th content varies from less than 1 to 620 ppm, averaging 71 ppm. The Th/U ratio shows a wide range from 0.42 to 621, with an average value of 73.7.
The binary diagrams of zircon composition (Fig.3) clearly show two distinct groups of points. The first group includes analytical points of compositions located in sector <111>, the second group includes analytical points located in sector <010> and points of ambiguous crystallographic form in the area of the former dipyramid faces (points 4, 5, and 29). There are strong positive correlations between HREE and LREE (Fig.3, a) and Y and REE (Fig.3, b), characteristic of zircon, indicating the joint isomorphism of these elements [33, 34]. According to the Th and U, as well as REE and P ratios, the composition points do not form a linear trend characteristic of these elements but are located as distant clusters from each other (Fig.3, c, d). Similar interposition is characteristic of other elements (Fig.3, e, f).
The REE spectra of the studied zircon crystal also fall into two groups (Fig.4), differing in configuration and REE content level. They all present differentiated spectra from LREE to HREE (LuN/LaN ranging from 202 to 3480), which is typical for magmatic zircon [33, 35].
Distribution of trace elements in the growth sectors of the dipyramid {111} and prism {010}
Zircon in the <111> dipyramid growth sector is characterized by higher (compared to the <010> prism sector) concentrations of all analyzed impurity elements except Hf. In the growth sector <111> the Hf content is relatively stable and varies between 12600-16300 ppm, with a mean value of 14700 ppm (see Table). In addition, a significant contribution to the trace-element composition of zircon is made by Y and Nb. The average content of these elements for the dipyramid growth sector is 360 and 325 ppm, respectively, which is more than 5-13 times higher than in the prism growth sector. It can also be noted that the Th and P content is significant, averaging 175 and 120 ppm, respectively. Zircon in sector <111> is characterized by a very low U content (no more than 1.2 ppm) and hence there is an extremely high Th/U ratio of 43-532, averaging 176.
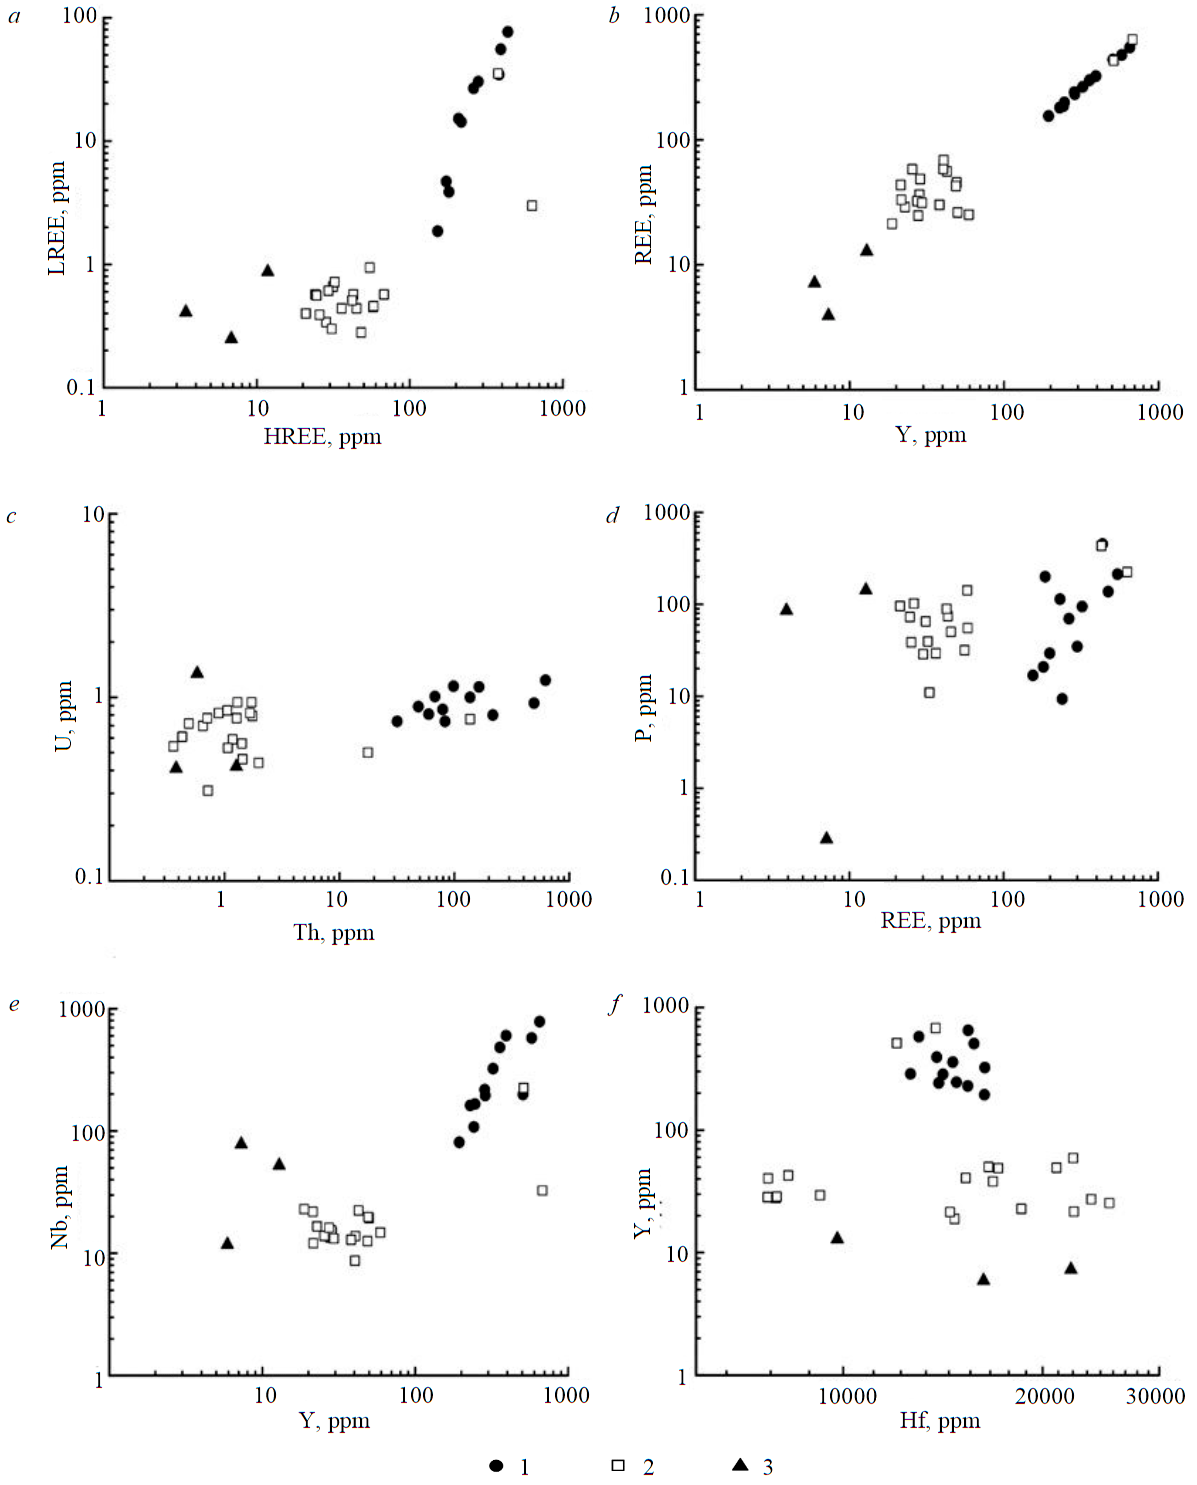
Fig.3. Ratios: HREE-LREE (a), Y-REE (b), Th-U (c), REE-P (d), Y-Nb (d), Hf-Y (e) in zircon 1 – points on the dipyramid (111); 2 – points on the prism (010); 3 – an area of undefined faces
The REE spectra of zircon in the dipyramid growth sector are located in the upper part of the diagram (Fig.4), they are characterized by an increased content of both LREE and HREE. The total REE content averages about 300 ppm, of which the vast majority belongs to HREE (averaging about 260 ppm), while LREE makes only 25 ppm. In this regard, the REE spectra in the dipyramid growth sector have a differentiated distribution from LREE to HREE (the mean value of LuN/LaN ratio is 1030). In the HREE region, these spectra are less differentiated (mean value of LuN/GdN is 8) and are steeper in the LREE region (the mean value of SmN/LaN is 59). The REE spectra show a pronounced Ce-anomaly (Ce/Ce* averages – 7.7) and an almost absent Eu-anomaly (Eu/Eu* averages – 0.9). All spectra belonging to the dipyramid growth sector are parallel to each other and differ only by slight variations in REE content levels.
Zircon in the prism growth sector <010> has extremely low concentrations of impurity elements. The only significant impurity is Hf, which reaches the highest value among all points, reaching 7700-25200 ppm with the mean value of 15100 ppm, which is slightly higher than its content in the <111> sector. The content of all other impurity elements is very low and generally does not exceed 5-60 ppm (see table). The Th/U ratio is limited to the range of 0.6-5.6, averaging 1.8. In the prism growth sector, analytical points 15 and 16 are isolated and located in the central zone of the crystal. They contain relatively high levels of impurities, corresponding to, or even higher than those in the growth sector of the dipyramid (e.g. HREE – 630 ppm and Y – 680 ppm). The REE distribution spectra are similar to those of the dipyramid sector. The spectra of the remaining points from the prism growth sector are at the bottom of the diagram (Fig.4), due to the low content of both LREE (0.5 ppm) and HREE (39 ppm). The spectra are differentiated with a regular increase from LREE to HREE (LuN/LaN ratio averages – 1034). There is a pronounced Ce-anomaly (Ce/Ce* is 4.4) and a weak negative Eu-anomaly (Eu/Eu* has an average value of 0.6). The spectra of LREE in the <010> sector are weakly differentiated (SmN/LaN ratio is 4.2), and the HREE part of spectra is steeper (LuN/GdN ratio is 73), in contrast to sector <111>. In addition, most of the REE spectra belonging to the <010> sector show an atypical negative trough for zircon in the Nd region.
The REE distribution spectra for zircon in the zone of ambiguous crystallographic forms (points 4, 5, and 29), which are difficult to diagnose due to the lack of reliable morphological features, are similar in outline to the REE spectra for the prism growth sector (Fig.4). The difference is that the HREE content is almost an order of magnitude lower (7.4 ppm on average). The content of other impurity elements is insignificantly lower or corresponds to their value in the <010> sector (Fig.3).
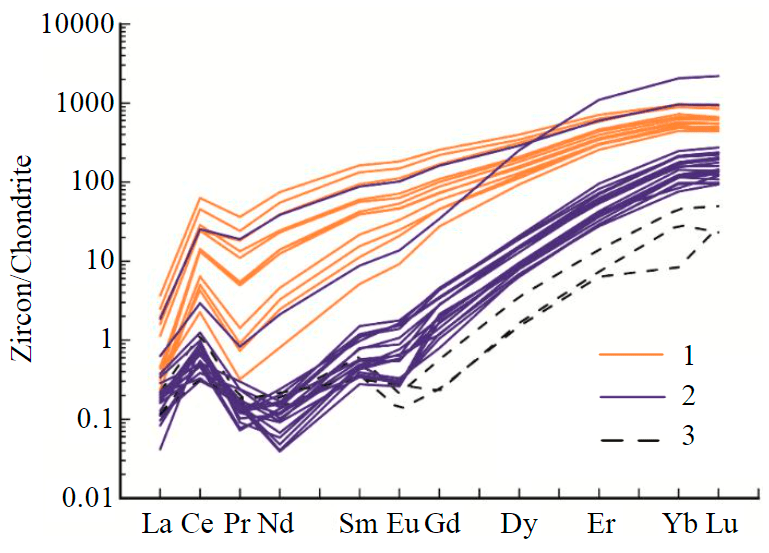
Fig.4. REE spectra in zircon 1 – (111); 2 – (010); 3 – undefined zone
Distribution of trace elements within crystal growth zones
During the growth of the zircon crystal the ratio of pyramids of simple forms changed: from the crystal central zone to the margin zone the role of the prism (010), (010-) and faces (111), (110-) dipyramids increased, other dipyramids faces were suppressed. In addition, zircon crystallization was accompanied by partial dissolution and possibly by recrystallization of the prism faces and partly the dipyramid faces near the major fissure (see Fig.1). In this regard, it is necessary to consider the character of rare elements' distribution in different growth zones within a dipyramid (points 14-1) (Fig.5, a) and a prism (points 15-22) (Fig.5, b). The profile located in the dipyramid growth sector is represented by fourteen points (points 14-1) (Fig.5, a) from the crystal core to its rim. All points belong to the dark zircon bands. Points 14, 9, 2, and 1 fall in the light areas. The composition of the light (in CL) bands differs from that of the dark ones less significantly than the composition of the different growth zones of the dipyramid. Thus, the central zone (points 14-12) has the maximum content of all trace elements except for Hf, which is at the level of the mean value for the entire crystal (about 14000 ppm). The content of such elements as Y (561 ppm), REE (473 ppm), Nb (446), Th (367), P (30), Ca (85), and Ti (45 ppm) is increased. The content of the other elements does not exceed 1-2 ppm (see Table). The transition from the crystal central zone (points 14-13) to its rim is accompanied by a natural reduction in the content of impurity elements. REE content is gradually decreasing to 155 ppm, Y to 194 ppm, Nb to 81 ppm, Th to 32 ppm, Ti to 9 ppm, and Ca to 8 ppm. In the zone of the ambiguous crystallographic form (points 4, 5, and 29) the content of trace and rare-earth elements are worth considering separately, as this area differs dramatically from the rest of the profile points. It is characterized by the lowest content of almost all impurities: Hf (9800 and 22100 ppm) and P (86 and 143 ppm) content level is around or slightly above mean values. In the dipyramid rim zone (points 3, 2, and 1) the impurity element content increases slightly but remains mostly at a low level. In the direction from the central zone to the rim, the Ce/Ce* value increases from 4 to 9; the Eu/Eu* ratio remains stable throughout the profile, except for the zone of ambiguous crystallographic form.
The analytical profile points (points 15-22, Fig.5, b) of the prism growth sector are located mostly in the light (in CL) bands. Only the rim zone (points 21 and 22) lies entirely in the dark area, with no zoning. The composition of zircon in the central zone of the prism sector is identical to that of the central zone of the dipyramid sector, characterized by an increased content of trace and rare-earth elements. With increasing distance from the core, there is a sharp decrease in the content levels of all impurity elements except Hf. The Hf content first increases to 21000-25000 ppm, then decreases in the dark rim zone to a minimum of 7700-9100 ppm. Thus, the analytical points of the composition of the rim in the Hf-Y binary plot (see Fig.3, e) are separated from the composition points of the inner parts of the prism. The total REE and Y content decrease from 400-600 to 20-50 ppm in the transition from the central zone to the rim, Th from 137 to 0.5-2 ppm, Ca from 110 to 1-3 ppm, and Ti from 26 to 3 ppm. The P content decreases from 430 to 30 ppm, but at some points, its concentration is below the detection limit.
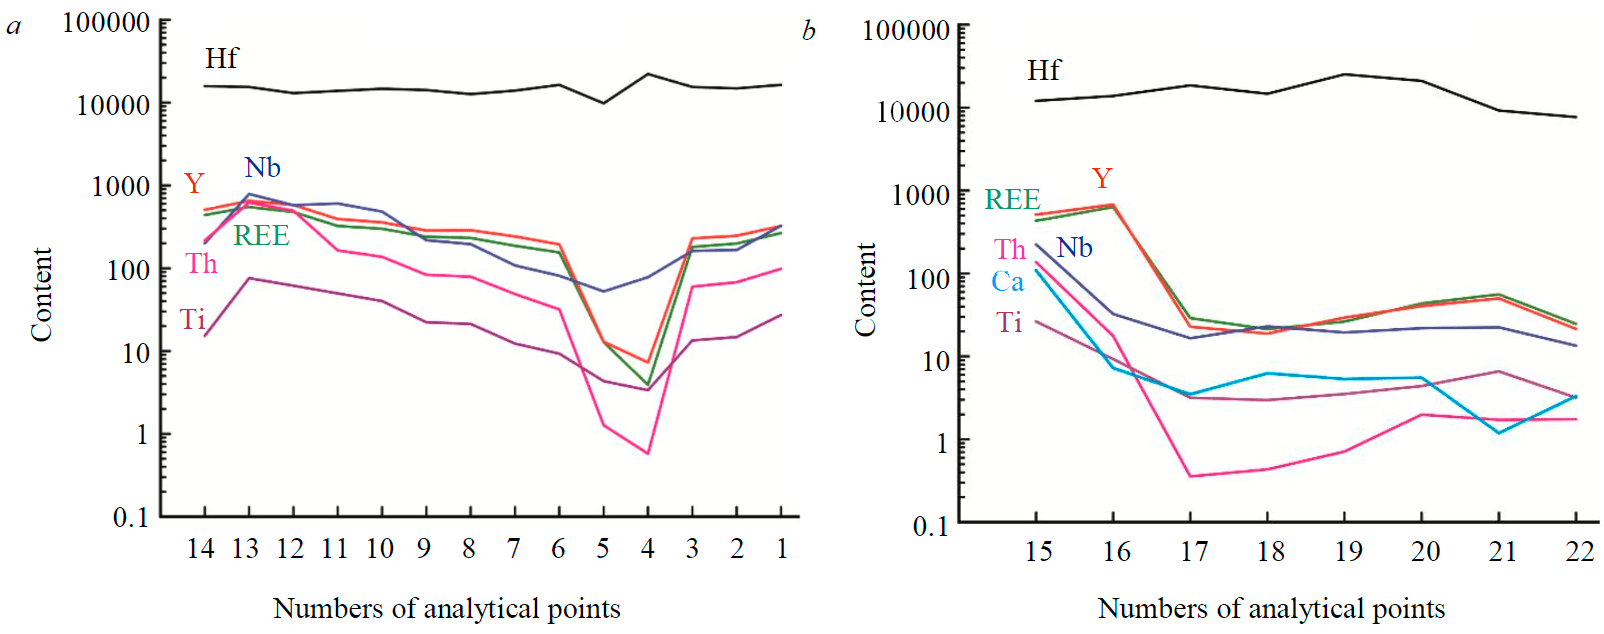
Fig.5. Trend of impurity element content in the growth sectors of the dipyramid (a) and prism (b) from the core to the rim of the crystal
Discussion
The main factor determining the composition of zircon from the miaskitic pegmatite of the Vishnevogorsky massif is the sector zoning formed by the growth of the dipyramid {111} and prism {110}. The analyzed crystal also shows growth zoning – oscillation of broad dark and thin light bands, seen in the CL image (see Fig.1). It was found that the dipyramid sector of the zircon under study has almost an order of magnitude higher level of trace element content compared to the prism sector. A comparison of zircon composition with its sector zones has been conducted before. For example, the study of zircon from BishopTuff showed that the content of Th, Nb, U, LREE, and Ti within the dipyramid exceeds the content of the same elements in the prism by more than two times [36]. The dipyramid growth sector {111} of the investigated zircon contains the dominant amount of impurities, the main of which are Y, Nb, Th, and HREE. The REE spectra have a flatter distribution from LREE to HREE with a pronounced Ce-anomaly (Ce/Ce* is 7.7) and almost absent Eu-anomaly (Eu/Eu* is about 0.9). It is noteworthy that Eu/Eu* = 0.9-1.0 is a specific feature of early rock types of the Ilmeno-Vishnevogorsky alkaline-carbonatite complex [37]. The zircon areas belonging to prism {010} show minimal content of impurity elements, except for Hf. The REE distribution spectra in the prism growth sector are more differentiated, with more pronounced Ce- (Ce/Ce* – 4.4) and Eu-anomalies (Eu/Eu* – 0.6). The rocks of the Ilmeno-Vishnevogorsky alkaline-carbonatite complex are characterized by a regular decrease in the Eu/Eu* ratio from 0.95 to 0.60 in the transition from early to late rock types [37]. Most of the REE spectra in the prism growth sector show an atypical for zircon negative slope in the Nd region, which may be due to the presence of micro-inclusions of REE-concentrating mineral [38]. The earlier study [39] of large zircon from a feldspathic pegmatite of Ilmensky mountains characterized by pronounced zoning and sectors has shown a different pattern of impurity distribution: the prism {110} sector contains more Th, U, REE, Y, and Nb and has a flatter HREE distribution spectrum with a steeper LREE range, unlike the dipyramid {111} sector. This is due to the co-crystallization of minerals concentration rare elements (apatite and monazite) and lack of zircon-fluid (melt) equilibria.
The distribution of trace and rare-earth elements in the growth sectors of the different simple forms is visible in the binary plots (see Fig.3). The analytical points are split into two clusters: the first one belongs to the dipyramid area {111}, and the second one to the prism area {010}. The second cluster, among others, includes analysis points 4, 5, and 29, which are difficult to assign to any simple form due to the lack of reliable diagnostic features. A significant positive correlation is observed only for HREE and LREE (Fig.3, a), as well as REE and Y (Fig.3, b). By the Th and U, as well as P and REE ratios in zircon, The imaging points of zircon composition in the Th and U, as well as P and REE coordinates do not show a characteristic linear trend (Fig.3, c, d), reflecting the isomorphism of these elements [40, 41]. A gradual decrease in the content of trace and rare-earth elements is only observed within each cluster. There is no uniform composition trend between them in all diagrams. The studied zircon is generally characterized by a very low U content, generally not exceeding 1 ppm. In the prism growth sector and the section with ambiguous crystallographic index, the Th/U ratio is predominantly 0.6-5.6, which corresponds to magmatic zircon [5]. For the dipyramid growth sector, an extremely high Th/U ratio in the range of 43-532 has been established, which is characteristic of alkaline zircon [42].
The content of all trace and rare-earth elements, except for Hf, naturally decreases from the zircon central zone to its margin zone (Fig.5). The zircon central zone is the most enriched zone with increased content of Y (500-650 ppm), Nb (200-800 ppm), Th (200-600 ppm), HREE (400-450 ppm), and P (150-450 ppm). The content of trace elements naturally decreases towards the zircon rim, being 250-300 ppm of Y, 80-600 ppm of Nb, 150-300 ppm of HREE, 30-150 ppm of Th, and 10-100 ppm P for the dipyramid. The prism is characterized by a sharp decrease in the impurities content level from the core to the rim (up to 20-60 ppm – Y; 30-150 ppm – HREE; 0.01-150 ppm – P; and 0.5-2 ppm – Th). At the same time the Eu/Eu* value within the dipyramid practically does not change, while the Ce/Ce* value gradually increases. The downward trend in the impurity content from the central zone to the margin zone of the crystal growth zone reflects the changing composition of the melt. The Hf content, the level of which, on the contrary, increases from the crystal central zone to its margin zone, may indicate a relatively slow cooling during crystallization [43]. This is also characteristic of zircon from the feldspar pegmatite of the Ilmensky mountains [39, 44].
In the crystal under study, it is worth paying attention to the distribution of Ti widely used in the “Ti-in-zircon” method of calculating the zircon crystallization temperature [24]. The growth zones of the dipyramid and prism faces contain varying amounts of Ti. Thus, for most of the analyzed prism points, the Ti content is in the narrow range of 3-6 ppm, which corresponds to the crystallization temperature calculated from the Ti thermometer, 700-650 °С. In the central growth zone of the prism, the Ti content is 10-16 ppm (see table). The Ti content in the dipyramid growth sector has a higher value (9-76 ppm) and tends to decrease from the central zone to the margin zone of the crystal (Fig.5, a). A study of Ti diffusion in zircon [23] has shown that within the zircon elongation (L4 axis) diffusion is several orders of magnitude faster than in the perpendicular direction. The central growth zone of the investigated crystal shows maximum Ti content – 61-76 ppm for the dark in CL zircon bands and 15 ppm for the light band. The crystallization temperature of the zircon central zone, calculated using a Ti thermometer, is 960-780 °С. As we approach the rims of dipyramid growth, the Ti content decreases from 50 to 9 ppm, which corresponds to temperatures of 910-740 °С. In the zone of the ambiguous crystallographic form (points 4, 5, and 29) the lowest Ti content (3-4 ppm) is observed, which corresponds to 670-650 °С. These values coincide with the margin of error within the zircon crystallization temperature in the prism growth sector. It can be assumed that this zone has crystallized together with the prism faces with the accompanying partial dissolution of the dipyramid faces, as the edges of the dipyramid and prism faces are predominantly blurred. According to [37], the rocks of the alkaline-carbonatite Ilmeno-Vishnevogorsky complex were formed in the temperature range of 1000-490 °С, and the crystallization temperature of miaskitic pegmatites was 750-590 °С, which agrees with the calculated values for prism faces (700-650 °С). Regarding the zircon crystallization temperature in the faces of the dipyramid, on the one hand, the obtained data are too high for the crystallization of miaskitic pegmatite, even if the allowable Ti content (not more than 50 ppm) for the “Ti-in-zircon” thermometer is observed [24]. On the other hand, the calculated temperature shows smooth trend of regression from the central zone to the margin zone from 960 to 740 °C for the dipyramid and 700-650 °С for the prism. This may be a reflection of the thermal evolution of the crystallization process of zircon and melt.
Conclusions
- The internal structure of a large zircon crystal from a miaskitic pegmatite of the Vishnevogorsky massif reveals a distinct sector zoning, which correlates with changes in the trace element composition. In the occurrence of sector growth, the determining factors are the difference in the content of trace and rare-earth elements and the fractionation of REE within the investigated crystal.
- The growth sectors of dipyramid {111} and prism {010} differ essentially in trace-element composition and degree of REE fractionation. The zircon dipyramid growth sector compared to the prism one is characterized by an order of magnitude higher concentrations of rare elements (Y, Nb, REE, Th, and P), higher Th/U ratios and Eu/Eu* values, and flatter REE distribution spectra. Therefore, isotopic and geochemical studies and the development of geothermometers and other indicators should take into account the possible difference in the impurity composition of zircon in different sectors and zones of crystal growth with zonal and sectoral structures.
- In the direction from the crystal central zone to its margin zone a gradual decrease in the content of all trace and rare-earth elements, except for Hf, was found. Moreover, there is a smooth regression of the zircon crystallization temperature from core to rim from 960 to 740 °C for the dipyramid and 700-650 °С for the prism, which may be a reflection of the thermal evolution of the melt. It can be assumed that the zircon crystallization started from a relatively trace element-rich melt in the early stages of crystallization of the pegmatite vein. Zircon crystallization was completed at lower temperatures, probably simultaneously with the formation of REE-concentrating minerals. This led to a natural decrease in the content of trace and rare-earth elements in the melt and, consequently, in the zircon crystallizing from it.
References
- Watson E.B., Liang Y. A simple model for sector zoning in slowly grown crystals: Implications for growth rate and lattice diffusion, with emphasis on accessory minerals in crustal rocks. American Mineralogist. 1995. Vol. 80 (11-12), p. 1179-1187. DOI: 10.2138/am-1995-11-1209
- Sturm R. Internal morphology and crystal growth of accessory zircon from igneous rocks. Zircon and Olivine. United States, New York: Nova Science Publishers Inc, 2012, p. 37-65.
- Pupin J.P. Zircon and granite petrology. Contributions to Mineralogy and Petrology. 1980. Vol. 73, p. 207-220.
- Pupin J.P. Granites as indicators in paleogeodynamics. Rendiconti della Societa Italiana di Mineralogia e Petrologla. 1988. Vol. 43, p. 237-262.
- Corfu F., M.Hanchar J., Hoskin P.W.O., Kinny P. Atlas of zircon textures. Reviews in Mineralogy and Geochemistry. 2003. Vol. 53 (1), p. 469-500. DOI: 10.2113/0530469
- Wang X., Kienast J.-R. Morphology and geochemistry of zircon: a case study on zircon from the microgranitoid enclaves. Science in China Series D: Earth Sciences. 1999. Vol. 42, p. 544-552.
- Schwandt C.S., McKay G.A. Minor- and trace-element sector zoning in synthetic enstatite. American Mineralogist. 2006. Vol. 91, p. 1607-1615. DOI: 10.2138/am.2006.2093
- Lofgren G.E., Huss G.R., Wasserburg G.J. An experimental study of trace-element partitioning between Ti-Al-clinopyroxene and melt: Equilibrium and kinetic effects including sector zoning. American Mineralogist. 2006. Vol. 91, p. 1596-1606. DOI: 10.2138/am.2006.2108
- Stowell H., Zuluaga C.S., Boyle A., Bulman G. Garnet sector and oscillatory zoning linked with changes in crystal morphology during rapid growth, North Cascades, Washington. American Mineralogist. 2011. Vol. 96, p. 1354-1362. DOI: 10.2138/am.2011.3759
- Kukui A.L., Skublov S.G. Geochemistry of rare earth elements in Icelandic spar deposits of the Siberian platform. Doklady Akademii nauk. 2008. Vol. 418. N 2, p. 247-251 (in Russian).
- Rakovan J., Luo Y., Borkiewicz O. Synchrotron microanalytical methods in the study of trace and minor elements in apatite. Mineralogy. 2008. Vol. 39, p. 31-40. DOI: 10.2478/v10002-008-0001-9
- Bosze S., Rakovan J. Surface-structure-controlled sectoral zoning of the rare earth elements in fluorite from Long Lake, New York, and Bingham, New Mexico, USA. Geochimica et Cosmochimica Acta. 2002. Vol. 66. Iss. 6, p. 997-1009. DOI: 10.1016/S0016-7037(01)00822-5
- Repina S.A. Fractionation of REE in the xenotime and florencite paragenetic association from Au-REE mineral occurrences of the Nether-Polar Urals. Geochemistry International. 2011. Vol. 49, p. 868-887. DOI: 10.1134/S0016702911090060
- Repina S.A., Khiller V.V., Makagonov E.P. Microheterogeneity of crystal growth zones as a result of REE fractionation. Geochemistry International. 2014. Vol. 52, p. 1057-1071. DOI: 10.1134/S0016702914100085
- Loufouandi Matondo I.P., Ivanov M.A. Composition and probable ore igneous rocks source of columbite from alluvial deposits of Mayoko district (Republic of the Congo). Journal of Mining Institute. 2020. Vol. 242, p. 139-149. DOI: 10.31897/PMI.2020.2.139
- Gavrilchik A.K., Skublov S.G., Kotova E.L. Features Of Trace Element Composition Of Beryl From The Uralian Izumrudnye Kopi. Mineralogy. 2021. Vol. 7. N 3, p. 32-46 (in Russian). DOI: 10.35597/2313-545X-2021-7-3-2
- Gavrilchik A.K., Skublov S.G., Kotova E.L. Trace Element Composition of Beryl From the Sherlovaya Gora Deposit, South-Eastern Transbaikalia, Russia. Zapiski Rossiyskogo mineralogicheskogo obshchestva. 2021. Vol. 150, p. 69-82 (in Russian). DOI: 10.31857/S0869605521020052
- Abdel Gawad A.E., Ene A., Skublov S.G. et al. Trace Element Geochemistry and Genesis of Beryl from Wadi Nugrus, South Eastern Desert, Egypt. Minerals. 2022. Vol. 12 (2). N 206. DOI: 10.3390/min12020206
- Vavra G. On the kinematics of zircon growth and its petrogenetic significance: a cathodoluminescence study. Contributions to Mineralogy and Petrology. 1990. Vol. 106, p. 90-99.
- Vavra G., Gebauer D., Schmid R., Compston W. Multiple zircon growth and recrystallization during polyphase Late Carboniferous to Triassic metamorphism in granulites of the Ivrea Zone (Southern Alps): an ion microprobe (SHRIMP) study. Contributions to Mineralogy and Petrology. 1996. Vol. 122, p. 337-358.
- Skublov S.G., Berezin A.V., Li X.H. et al. Zircons from a Pegmatite Cutting Eclogite (Gridino, Belomorian Mobile Belt): U-Pb-O and Trace Element Constraints on Eclogite Metamorphism and Fluid Activity. Geosciences. 2020. Vol. 10. N 197. DOI: 10.3390/geosciences10050197
- Skublov S.G., Li X.-H. Anomalous geochemistry of zircon from the Yastrebetskoe rare metal deposit (SIMS- and TOF-study). Journal of Mining Institute. 2016. Vol. 222, p. 798-802. DOI 10.18454/PMI.2016.6.798
- Bloch E.M., Jollands M.C., Tollan P. et al. Diffusion anisotropy of Ti in zircon and implications for Ti-in-zircon thermometry. Earth and Planetary Science Letters. 2022. Vol. 578. N 117317. DOI: 10.1016/j.epsl.2021.117317
- Watson E.B., Wark D.A., Thomas J.B. Crystallization thermometers for zircon and rutile. Contributions to Mineralogy and Petrology. 2006. Vol. 151, p. 413-433. DOI: 10.1007/s00410-006-0068-5
- Popova V.I., Chesnokov B.V. Anatomy of zircon crystals from alkaline pegmatites of the Vishnevyye Mountains. Ontogeniya pegmatitov Urala. Sverdlovsk: Uralskii nauchnykh tsentr AN SSSR, 1980, p. 91-101 (in Russian).
- Sturm R. Imaging of growth banding of minerals using 2-stage sectioning: application to accessory zircon. Micron. 2004. Vol. 35. Iss. 8, p. 681-684. DOI: 10.1016/j.micron.2004.05.001
- Fedotova A.A., Bibikova E.V., Simakin S.G. Ion-microprobe zircon geochemistry as an indicator of mineral genesis during geochronological studies. Geochemistry international. 2008. Vol. 46, p. 912-927. DOI: 10.1134/S001670290809005X
- Dokukina K.A., Kaulina T.V., Konilov A.N. et al. Archaean to Palaeoproterozoic high-grade evolution of the Belomorian eclogite province in the Gridino area, Fennoscandian Shield: Geochronological. Gondwana Research. 2014. Vol. 25. Iss. 2, p. 585-613. DOI: 10.1016/j.gr.2013.02.014
- McDonough W.F., Sun S.-s. The composition of the Earth. Chemical geology. 1995. Vol. 120. Iss. 3-4, p. 223-253. DOI: 10.1016/0009-2541(94)00140-4
- Nedosekova I.L., Pribavkin S.V. Miaskites, carbonatites and fenites of the Vishnevogorsky Massif. Magmatizm i metamorfizm v istorii Zemli. Ekaterinburg: Institut geologii i geokhimii UrO RAN, 2010, p. 83-105 (in Russian).
- Popov V.A., Popova V.I. Alkaline pegmatites of the Vishnevyye Mountains. Magmatizm i metamorfizm v istorii Zemli. 2010, p. 97-105 (in Russian).
- Ronenson B.M. The origin of the miaskites and the association of rare-metal mineralization with them. Moscow: Nedra, 1966, p. 173 (in Russian).
- Hoskin P.W.O., Schaltegger U. The composition of zircon and igneous and metamorphic petrogenesis. Reviews in Mineralogy and Geochemistry. 2003. Vol. 53 (1), p. 27-62. DOI: 10.2113/0530027
- Harley S.L., Kelly N.M. Zircon tiny but timely. Elements. 2007. Vol. 3. N 1, p. 13-18. DOI: 10.2113/gselements.3.1.13
- Skublov S.G., Berezin A.V., Berezhnaya N.G. General features of the rare elements composition in zircon from eclogites in relation to the age problem of eclogites of the White Sea movable belt. Petrologiya. 2012. Vol. 20. N 5, p. 470-494 (in Russian).
- Chamberlain K.J., Wilson C.J.N., Wooden J.L. et al. New perspectives on the Bishop Tuff from zircon textures, ages and trace elements. Journal of Petrology. 2014. Vol. 55. Iss. 2, p. 395-426. DOI: 10.1093/petrology/egt072
- Nedosekova I.L., Vladykin N.V., Pribavkin S.V., Bayanova T.B. The Ilmensky-Vishnevogorsky miaskite-carbonatite complex, The Urals, Russia: origin, ore resource potential, and sources. Geology of Ore Deposits. 2009. Vol. 51. N 2, p. 139-161 (in Russian).
- Kaulina T.V. Zircon formation and alteration in polymetamorphic complexes.. Apatity: Izd-vo Kolskogo nauchnogo tsentra RAN, 2010, p. 144 (in Russian).
- Levashova E.V., Skublov S.G., Popov V.A. Distribution of trace elements controlled by sector and growth zonings in zircon from feldspathic pegmatites (Ilmen Mountains, the Southern Urals). Geosciences. 2021. Vol. 11 (1), p. 20. DOI: 10.3390/geosciences11010007
- Finch R.J., Hanchar J.M., Hoskin P.W.O., Burns P.C. Rare earth elements in synthetic zircon: Part 2. A singlecrystal X-ray study of xenotime substitution. American Mineralogist. 2001. Vol. 86 (5-6), p. 681-689. DOI: 10.2138/am-2001-5-608
- Hoog de J.C.M., Lissenberg C.J., Brooker R.A. et al. Hydrogen incorporation and charge balance in natural zircon. Geochimica et Cosmochimica Acta. 2014. Vol. 141, p. 472-486. DOI: 10.1016/j.gca.2014.06.033
- Belousova E.A., Griffin W.L., O’Reilly S.Y., Fisher N.U. Igneous zircon: Trace element composition as an indicator of source rock type. Contributions to Mineralogy and Petrology. 2002. Vol. 143 (5), p. 602-622. DOI: 10.1007/s00410-002-0364-7
- Melnik O.E., Bindeman I.N. Modeling of trace elemental zoning patterns in accessory minerals with emphasis on the origin of micrometer-scale oscillatory zoning in zircon. American Mineralogist: Journal of Earth and Planetary Materials. 2018. Vol. 103. N 3, p. 355-368. DOI: 10.2138/am-2018-6182
- Popova V.I. Identification of elemental and isotopic zoning and sectoriality of large crystals of minerals using neutron radiography. Mineralogy (Russia). 2015. N 1, p. 25-33 (in Russian).