Litsa uranium ore occurrence (Arctic zone of the Fennoscandian Shield): new results of petrophysical and geochemical studies
- 1 — Ph.D. Senior Researcher Geological Institute of the Kola Science Centre, Russian Academy of Sciences ▪ Orcid ▪ Scopus ▪ ResearcherID
- 2 — Ph.D., Dr.Sci. Leading Researcher A.P.Karpinsky Russian Geological Research Institute ▪ Orcid
- 3 — Ph.D., Dr.Sci. Chief Researcher Geological Institute of the Kola Science Centre, Russian Academy of Sciences ▪ Orcid ▪ Elibrary ▪ Scopus ▪ ResearcherID
- 4 — Ph.D. Senior Researcher Geological Institute of the Kola Science Centre, Russian Academy of Sciences ▪ Orcid
- 5 — Ph.D. Researcher Geological Institute of the Kola Science Centre, Russian Academy of Sciences ▪ Orcid
- 6 — Junior Researcher Geological Institute of the Kola Science Centre, Russian Academy of Sciences ▪ Orcid

Abstract
Mineralogical, petrophysical and geochemical studies have been carried out to determine the sequence and formation conditions of uranium mineralization within the Litsa ore occurrence (Kola Region). Mineralogical studies show the following formation sequence of ore minerals: uraninite – sulfides – uranophane, coffinite, pitchblende. Two stages of uranium mineralization are distinguished: Th-U (1.85-1.75 Ga) and U (400-300 Ma). The distribution of physical properties of rocks in the area is consistent with the presence of two temporal stages in the formation of mineralization with different distribution and form of uranium occurrence in rocks. The factors that reduce rock anisotropy are the processes of migmatization and hydrothermal ore mineralization, which heal pores and cracks. Fluid inclusions in quartz studied by microthermometry and Raman spectroscopy contain gas, gas-liquid and aqueous inclusions of different salinity (1.7-18.4 wt.% NaCl-eq.). According to homogenization temperatures of inclusions in liquid phase, the temperature of the Paleoproterozoic and Paleozoic stages of uranium mineralization at the Litsa ore occurrence is ~ 300 and 200 °С, respectively. Correlations of the spatial distribution of elastic anisotropy index with an elevated radioactive background allow using this petrophysical feature as one of the prognostic criteria for uranium and complex uranium mineralization when carrying out uranium predictive work.
None
Introduction
The Kola Region lying in the Arctic zone of the Fennoscandian Shield comprises several bodies with a high uranium potential [1-3]. One of them is the Litsa uranium ore area in the northwestern Murmansk Region [4, 5]. This area was distinguished by A.V.Savitsky to the north of the Paleoproterozoic Pechenga structure, since the work of the PO “Nevskgeologiya” and VSEGEI revealed two ore occurrences (Litsa and Beregovoye) and a large number (about 40) of uranium mineralization occurrences (including complex ones) [2, 4, 5]. The Litsa ore area lies at the intersection of several fault zones with different spatial orientation, and its structure has a complex mosaic-block pattern [6] (Fig.1).
Litsa ore area as well as the northeastern Fennoscandian Shield is characterized by manifestation of the processes of Karelian tectonothermal protoactivation and Paleozoic tectonomagmatic activation [7, 8]. Under the influence of these processes, metamorphogenic metasomatic ore-forming systems of different productivity appeared in metamorphic basement rocks. Four types of uranium and the associated mineralization of different ages are distinguished [5] (Fig.1).
The purpose of the work is to study the Litsa ore occurrence, the largest in the region and lying in the exocontact zone of the Lebyazhinsky massif, which is part of the Litsa-Ara-Guba granitoid complex. Rock samples were taken at the ore occurrence for various types of investigations: determination of physical properties, structural distribution, and formation sequence of uranium minerals in rock; determination of the composition of fluid inclusions in quartz; Rb-Sr dating of rocks and minerals. Identification of petrophysical anomalies and determination of their nature based on petrophysical study of host rocks in uranium deposits is caused by the necessity of prospecting the hidden ore bodies [9-11]. A comprehensive analysis of heterogeneous information on the same body was previously successfully applied by the researchers from IGEM RAS and JINR [12-14].
Geology of the Litsa ore occurrence. Litsa uranium ore occurrence is the largest body in the Litsa area (Fig.1). It was discovered in 1962 and in 1973-1974 was explored by the PO “Nevskgeologia”. Within the Litsa ore occurrence, a large amount of comprehensive exploration geological and geophysical investigations was carried out (including clearing, ditching and drilling wells). The ore occurrence lies at the northwestern exocontact of the Lebyazhinsky granitoid massif, at the intersection of the Litsa and Chept-Yavr faults, in migmatized gneisses of the Kola series crumpled into submeridional folds (Fig.2). The folds are cut by multidirectional tectonic faults filled with cataclasites and breccias [4]. Within the Litsa ore occurrence, two types of mineralization are distinguished: Th-U – in quartz-albite-microcline and quartz-microcline metasomatites (1.85-1.75 Ga); U – in albite-hydromica-chlorite metasomatites (400-300 Ma). These types of mineralization are manifested mainly in the axial part of the Litsa-Ara-Guba tectonic zone of the northeastern strike (Fig.1).
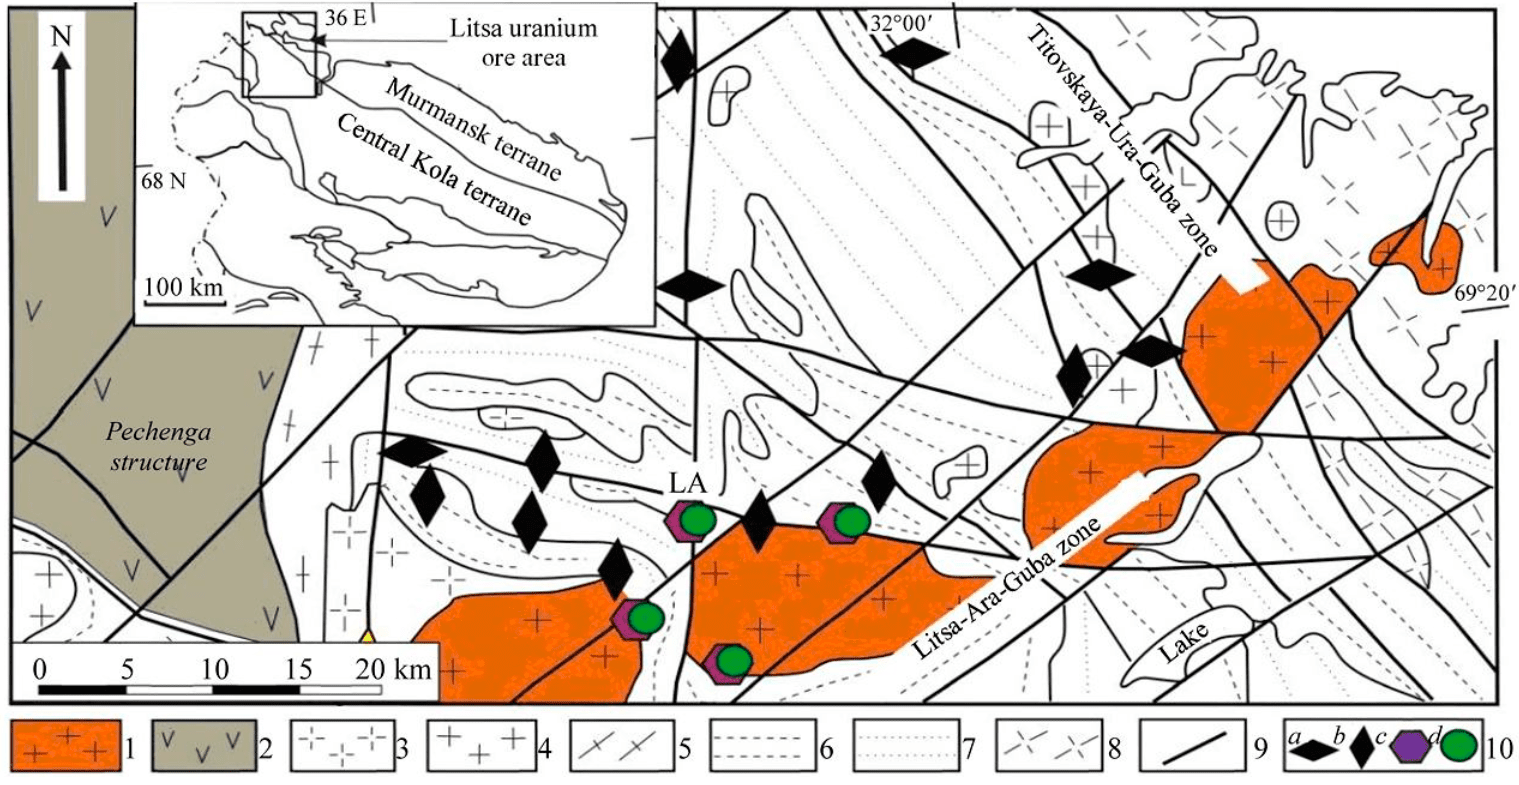
Fig.1. Fragment of the map of Litsa area with different types of uranium mineralization [4] 1-3 – Lower Proterozoic: 1 – granite-granodiorites of Litsa-Ara-Guba complex; 2 – volcanic sedimentary rocks of Pechenga series; 3 – granites of Kaskel’yavr complex; 4-8 – Upper Archean: 4 – granites of Voronya complex, 5 – diorites-plagiogranites of Poroyarvi complex, 6, 7 – gneisses of Kola series: 6 – amphibole-biotite, 7 – aluminous and garnet-biotite; 8 – Lower Archean: tonalites and plagiogranites; 9 – faults; 10 – types of uranium mineralization: а – REE-Th-U in pegmatoid granites and quartz-plagioclase metasomatites; b – U in chlorite-albite metasomatites and albitites; c – Th-U mineralization in quartz-albite-microcline and quartz-microcline metasomatites (1.85-1.75 Ga); d – U mineralization in albite-hydromica-chlorite metasomatites (400-300 Ma); LR – Litsa ore occurrence
Litsa ore occurrence is considered to be the most significant one with predicted P1 resources of 2,869 tons (according to the data of the GP “Nevskgeologiya” [5]). According to the classification [15, 16], the Litsa ore occurrence by genesis refers to endogenous, hydrothermal metasomatic occurrences confined to areas of tectonomagmatic activation of the Precambrian shields; geological economic type – vein-stockwork. Examples of such ore bodies are the Michurinskoye, Vatutinskoye, and Zheltorechenskoye deposits in the Ukraine [7]. A close position in this classification is taken by the type of Au-U deposits in long-lived faults in the areas of Mesozoic tectonomagmatic activation [17].
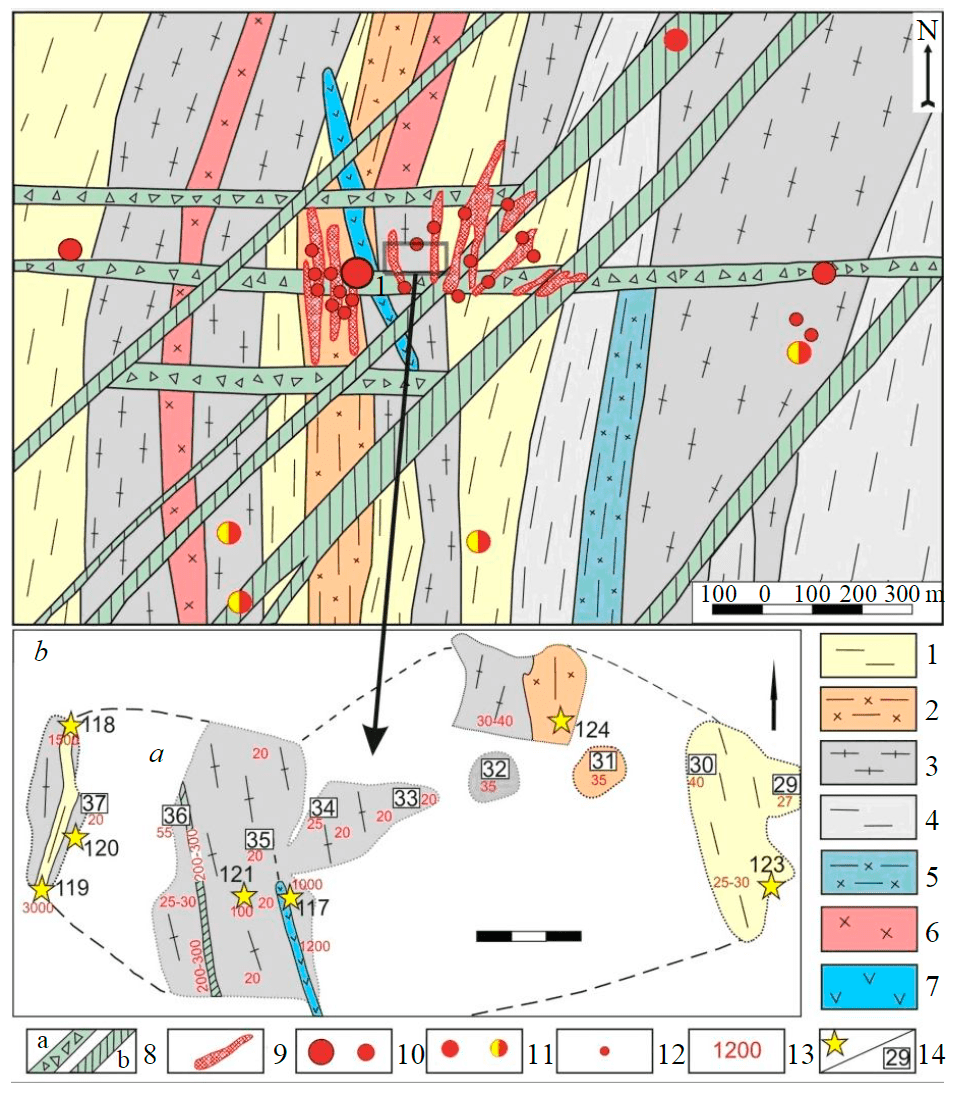
Fig.2. Litsa ore occurrence after [5] (a) and work site with sampling points (b) (site map compiled by E.A.Nitkina, N.I.Zabavchik) 1 – biotite gneisses; 2 – biotite gneisses with bodies of aplite-pegmatite granites; 3 – gneiss granite, leucocratic gneiss granites; 4 – aluminous gneisses (cordierite-biotite, garnet-biotite, sillimanite-biotite); 5 – aluminous gneisses with bodies of pegmatoid granites; 6 – pegmatoid, aplite-pegmatoid granites; 7 – dolerites, gabbro-dolerites; 8 – cataclasis and brecciation zones (a), zones of intense fracturing (b); 9 – projection of ore bodies; 10 – ore occurrences and manifestations of uranium mineralization; 11 – uranium and uranium-radon anomalies; 12 – wells with uranium contents over 0.05 wt.%; 13 – radioactivity, µR/h; 14 – sampling points: geochemical (asterisk) and petrophysical (number in a box)
The researchers [5] identified seve-ral types of radioactive anomalies at the Litsa ore occurrence, possibly, corresponding to different stages of uranium enrichment of rocks.
- Anomalies associated with migmatization were recorded in enclosing gneisses migmatized to varying degrees. The maximum radioactivity (to 1,500 μR/h) is exhibited by dislocated biotite gneisses with radiation background ~ 30-40 μR/h (on average). Radioactivity of quartz-feldspar gneisses < 20 μR/h.
- Anomalies associated with mafic dikes. Fine-grained mafic dikes of northwestern strike (345-350°) to 40 m long and 0.2-2 m thick are displaced by the northeastern faults (Fig.2, a). Contacts of dikes with enclosing gneisses are sheared, oxidized and anomalously radioactive – 250-400 (to 1200) μR/h.
- Anomalous radioactivity is associated with pitchblende veinlets in quartz-muscovite coarse-grained veins of northeastern strike (60°) and subvertical dip, which are cutting biotite gneisses. Quartz-muscovite veins 20-30 cm wide and to 20 m long are not radioactive. Pitchblende veinlets have thickness to 2 cm and radioactivity > 3,000 μR/h; they occur in the middle parts of the quartz-muscovite veins and have the same spatial orientation.
Uranium mineralization is controlled by zones of crushing and intense tectonic fracturing. Within these zones, albite-hydromica-chlorite metasomatites are widespread. Zones of epigenetically altered rocks reach a thickness of 40-50 m. Ore bodies occur in metasomatites in the form of gently inclined lenses and stockworks at depths of 60-150 m, sometimes traced to a depth of 250 m. The extent of ore bodies ranges from the first meters to tens of meters, the thickness varies from the first centimeters to 30-40 m. The content of U in ore deposits is 0.01-0.4 %, Th – 0.005-0.01 %. Abnormal concentrations of Pb (to 0.2 %), Cu (to 0.03 %), Ni, Co and Cr (to 0.01 % each) are
recorded. V, Ag, Zn, Be, and Li are found in elevated concentrations [4].
Uranium minerals are represented by pitchblende, coffinite, uraninite, and brannerite. Accessory minerals include fluorite, apatite, and zircon; hydroxides and secondary uranium silicates have also been recorded. Pyrite, chalcopyrite, pyrrhotite, sphalerite, and galena occur in association with primary uranium minerals.
The age of early uranium mineralization (1.85-1.75 Ga) was determined by the U-Pb method on uraninite [4]. A mafic dike dated by the Rb-Sr method with an age of about 1 Ga contains brannerite and the REE-U minerals [5]. The study area experienced several stages of tectonomagmatic activation, and the later stages (here, the Paleozoic) are noted for higher levels of accumulation and concentration of ore matter. Dating after pitchblende by the U-Pb ID-TIMS method showed an age of 370 ± 20 Ma [4], and by the SIMS method, 455 ± 6 Ma [5]. According to [18, 19], the formation temperature of albite-hydromica-chlorite metasomatites is 220-280 °C.
During field work in 2018 at the Litsa ore occurrence the outcrops of bedrocks uncovered by clearing were mapped. Background values of rock radioactivity are 20 μR/h, but radioactive anomalies to 3,000 μR/h are recorded exceeding the background values by orders of magnitude (Fig.2, b). Samples were taken from the exposures for petrophysical studies and geochemical analysis, and the same samples were used to study fluid inclusions in quartz and for mineralogical studies.
Methodology
For petrophysical measurements at the Litsa ore occurrence spatially oriented samples were taken along a nine-point line. At two points (29 and 31), two samples with different degrees of migmatization were taken to assess the impact of the migmatization process on physical properties of rocks. Sampling interval for petrophysical studies is about 10 m. Petrographic composition of rocks was investigated in thin sections. Samples were cut from the selected samples in the form of a cube with an edge length of 25-30 mm (with preservation of spatial orientation). Faces of cubes were numbered: directions 1 and 2 – north and east, respectively; direction 3 – vertical. Propagation velocity of P-waves Vp was measured in three directions of the cube (1-3) using an ultrasonic device GSP UK-10PMS. Elastic anisotropy index for the samples is calculated from the propagation velocities of ultrasonic P-waves (V1, V2, V3) in them in three orthogonal directions according to the formula
where Vav = (V1 + V2 + V3)/3 is the average propagation velocity of P-waves in the sample.
As shown by the earlier studies [20], the elastic anisotropy index A calculated from the propagation velocities of P-waves, is in direct correlation with elastic anisotropy index. This parameter is quite sufficient for a preliminary assessment of the tectonophysical setting. Density of samples was determined by hydrostatic weighing.
Mineral phases were determined in polished preparations by a semi-quantitative method using a scanning electron microscope LEO-1450, Carl Zeiss AG, with an energy dispersive attachment XFlash-5010 Bruker Nano GmbH at the Geological Institute of the KSC RAS (Apatity). Fluid inclusions in quartz were studied by optical microscopy, microthermometry, and Raman spectroscopy. Thermometric study of inclusions was carried out at the GI KSC RAS using a Linkam THMSG-600 thermal chamber operating in the temperature range from –196 to +600 °С. Cooling was accomplished by nitrogen supply. Measurement error of freezing and heating temperatures was ±0.1 and ±1 °С. Temperature changes were controlled using the Linksys 32 software module. Visual control of phase transformations was carried out on a JENAVAL Carl Zeiss microscope (Germany) with an Olympus 50x long-focus lens. Composition of major elements and the salinity of aqueous inclusions were estimated from the temperature of eutectics and melting of the last ice crystal (Tmice), respectively [21].
Raman spectroscopic measurements were taken on a Horiba LabRAM HR 800 instrument at the “Geo-model” Resource Centre of Saint Petersburg State University. An Ar+ 514.5 nm laser with an output power of 75 mW was used for the analysis. Spectra in the 100-4,200 cm–1 range were recorded using a CCD detector. Diffraction grating 1,800 slits/mm, spectral resolution 1.5-2.2 cm–1, wavenumber accuracy ±1 cm–1. Depending on the size and depth of fluid inclusion occurrence in quartz, the accumulation time was adjusted in the course of measurements from the minimum (25 s/spectral window) to the maximum values (400 s/spectral window). Silicon with an oscillation frequency of 520.7 cm–1 and mercury from a fluorescent lamp with a diagnostic line of 1122.5 cm–1 were used for calibration.
Dating of rocks and minerals by the Rb-Sr method was carried out at the Laboratory of Geochronology and Geochemistry of Isotopes at GI KSC RAS [22]. Rb and Sr contents were determined applying the isotopic dilution procedure. Measurements were taken on MI-1201T mass spectrometer in a single-filament mode on tantalum filaments. Isotope composition of Sr in all measured samples was normalized to the recommended NISTSRM-987 value of 0.71034±0.00026. Determination errors of Sr (87Sr/86Sr) isotope composition did not exceed ±0.04% (2σ), determination of 87Rb/86Sr ratios ±0.5%; determination accuracy of Rb and Sr concentrations was ±1.0%; blank contamination for Rb was 2.5 ng, for Sr – 1.2 ng.
Research results
The main rock types identified as a result of petrographic study are represented by biotite gneisses, gneiss granites and quartz veins cutting them. Samples for mineralogical and isotope geochemical studies (118-1, 118-2, 119-1) were taken from biotite gneisses with a high radioactive background of 1,500-3,000 μR/h (Fig.2, b). Rock composition, %, is: Pl 40-45, Qz 25-30, Mc 7-10, Bt 5-7, Ms < 1. The predominant structure is lepidogranoblastic and granoblastic. Samples 117-1, 117-2, 120-1, and 121-1 were taken from granite gneiss with a varying radioactive background from 20 to 100 µR/h (1,000 µR/h at the contact with a gabbro-dolerite dike). Rocks have a hypidiomorphic granular structure and are composed of, %: Qz 40-45, Mc 30-55, Pl ~25, Ms 1-2, ore mineral. Sample 119-2 was taken from a monomineral quartz vein with radioactivity over 1,000 μR/h. Secondary alterations in gneisses are caused by the processes of albitization, chloritization and sericitization.
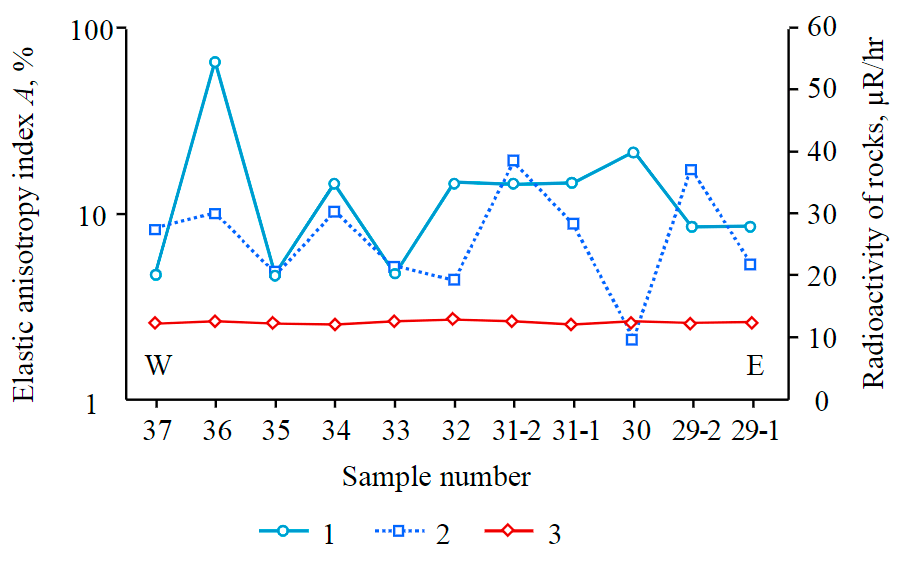
Fig.3. Physical properties of samples along the line through the work site (W – western edge of the line, E – eastern edge) 1 – radioactivity, μR/h; 2 – А, %; 3 – r, g/cm3
Physical properties (r, Ap) of rock samples. Samples for petrophysical studies were selected: from biotite gneisses migmatized to varying degrees (samples 29-30); biotite gneisses at the boundary with pegmatoid granites (samples 31-1 and 31-2); microcline granite (sample 32); plagiogranites (samples 33-37) (Fig.2, b). All samples of the studied collection are petrographically related to gra-nitoids, and their density is in accordance with reference data - 2.65 ± 0.1 g/cm3 (Fig.3, Table 1).
The results of studying physical properties of rocks and their comparison with data of radiometric measurements along the line at the Litsa uranium ore occurrence make it possible to distinguish two areas, in one of which the maximum values of elastic anisotropy coincide with rocks with elevated radioactivity, and in the other one, vice versa. Migmatized biotite gneisses and gneisses at the boundary with pegmatoid granites in the eastern part of the area show a decrease in anisotropy index with increasing radioactive background. In plagiogranites from the western part, an increase in anisotropy index is accompanied by a growing radioactive background (Fig.3).
When comparing paired samples cut out from one piece of rock (sample N 29: cubes 29-1 and 29-2, sample N 31: cubes 31-1 and 31-2) (Table 1), it was concluded that rock alteration due to partial melting (with the development of migmatites and pegmatites) changes the primary elastic properties (Vav) and density is statistically insignificant [23] but can lead to noticeable variations in elastic anisotropy index (Fig.3). Rock melting (high temperature) heals the system of cracks, the presence of which determines the
effect of elastic anisotropy of rocks.
Table 1
Physical properties of rock samples from Litsa ore occurrence
|
Sample |
Rock |
Density r, g/cm3 |
Velocity of P-waves V1; V2; V3, km/s |
Vav, km/s |
Elastic anisotropy index А, % |
Readings of radiometer at sampling point, μR/h |
|
29-1 |
Biotite (Bt) gneiss, fine-grained, migmatized |
2.62 |
3.78; 3.68; 3.51 |
3.66 |
5.28 |
25-28 |
|
29-2 |
Bt-gneiss, fine-grained, slightly migmatized |
2.59 |
4.16; 3.96; 4.01 |
4.04 |
17.11 |
25-28 |
|
30 |
Bt-gneiss, inequigranular, migmatized |
2.59 |
4.18; 4.08; 4.07 |
4.11 |
2.09 |
40 |
|
31-1 |
Pegmatoid plagiogranite |
2.64 |
3.54; 4.00; 3.84 |
3.79 |
8.71 |
30-40 |
|
31-2 |
Bt-gneiss from the contact with a pegmatite vein |
2.66 |
4.36; 4.24; 4.08 |
4.23 |
19.51 |
30-40 |
|
32 |
Bt-microcline gneiss-granite |
2.71 |
3.70; 3.77; 3.93 |
3.80 |
4.39 |
30-40 |
|
33 |
Bt-plagiogneiss-granite, medium-grained |
2.63 |
3.99; 3.89; 3.71 |
3.86 |
5.17 |
20 |
|
34 |
Bt- plagiogneiss-granite, fine- to medium- grained |
2.54 |
3.91; 4.49; 4.01 |
4.14 |
10.59 |
20-30 |
|
35 |
Bt-plagiogneissose granite, medium- to fine-grained, migmatized |
2.56 |
4.22; 4.20; 3.97 |
4.13 |
4.76 |
20 |
|
36 |
Bt- plagiogneissose granite, medium- to fine-grained, migmatized |
2.64 |
3.85; 3.71; 3.37 |
3.64 |
10.05 |
50-60 |
|
37 |
Bt- plagiogneissose granite, medium- to fine-grained, migmatized |
2.60 |
4.23; 3.77; 4.07 |
4.02 |
8.22 |
20 |
Uranium and uranium-containing minerals. Uranium mineralization was studied in rock plates prepared for further study of fluid inclusions in quartz (Fig.4, 5). Two samples of biotite gneisses were considered: 118-1 with content of U – 515 and Th – 7.5 g/t; 119-1 with content of U – 3.6 and Th – 1.8 g/t. Both samples were taken from gneiss areas with a high radioactive background (1,000 and 3,000 µR/h) (see Fig.2, b).
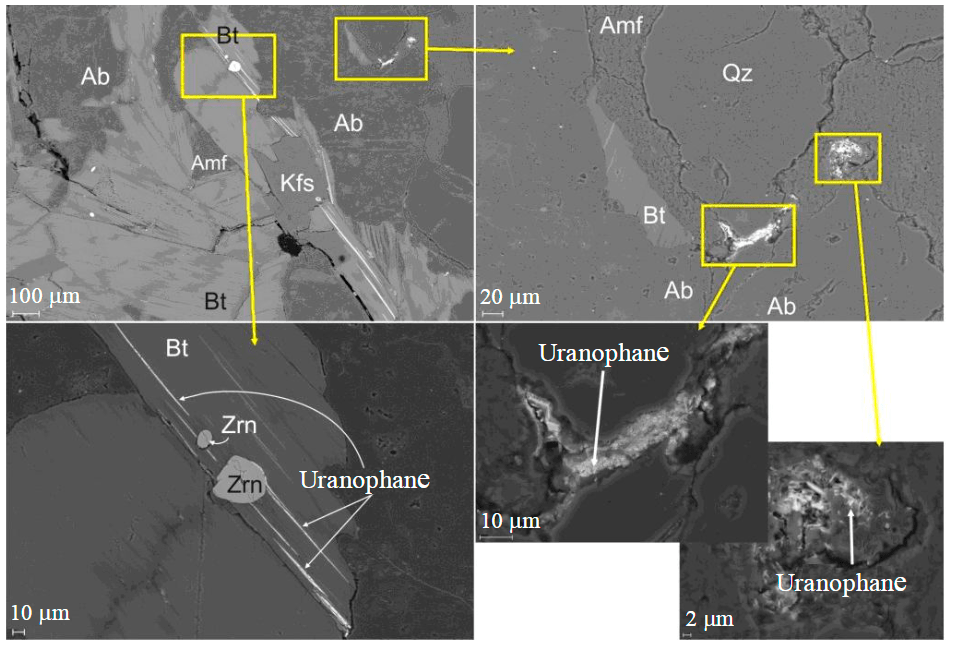
Fig.4. Development of uranophane along grain boundaries and cleavage of biotite plates, sample 118-1 (photo SEM, BSE) Amf – amphibole; Ab – albite; Kfs – potash feldspar; Qz – quartz, Zrn – zircon; Bt – biotite [24]
In sample 118-1, uranium-bearing minerals are zircon and Ce-monazite with thorite inclusions embedded in biotite and plagioclase. Uranium mine-rals are represented by uranophane which develops after biotite cleavage or around quartz grains (Fig.4).
In sample 119-1, uranium minerali-zation is closely associated with sulfide mineralization. Uranophane and coffinite develop around chalcopyrite grains, and uranophane also develops along the boundary of quartz grains. This process is extensively manifested, since petrographic observations demonstrate thin light blue rims around most of the quartz grains. Brannerite develops along biotite cleavage (Fig.5). Zircon and casolite associated with biotite grains occur.
Fluid inclusions in quartz. A detailed petrographic study of quartz grains in plates polished on both sides made it possible to distinguish at room temperature four types of primary and primary-secondary inclusions (Fig.6), which can be classified as follows: type I – gas inclusions; type II – two-phase gas-liquid inclusions (GLI), containing 5-20 vol.% of gas; type III – two-phase GLI containing 30-70 vol.% of gas; type IV – aqueous inclusions.
Gas inclusions are rounded and small (to 5 µm) in size. They occur as part of chains of inclusions crossing quartz grains in different directions. The shape of type II inclusions is diverse, the size varies from 15 to 35 μm, and a gas bubble is often mobile. They can be single or occur in clusters. Inclusions of type III have a rounded elongated shape (size 10-30 μm). Most often found as part of a group with inclusions of other types. Type IV inclusions are rare. Single vacuoles of an irregular angular shape 10-20 μm in size can be found in association with inclusions of other types. As part of the work, the most frequent types of inclusions (II and III) were studied.
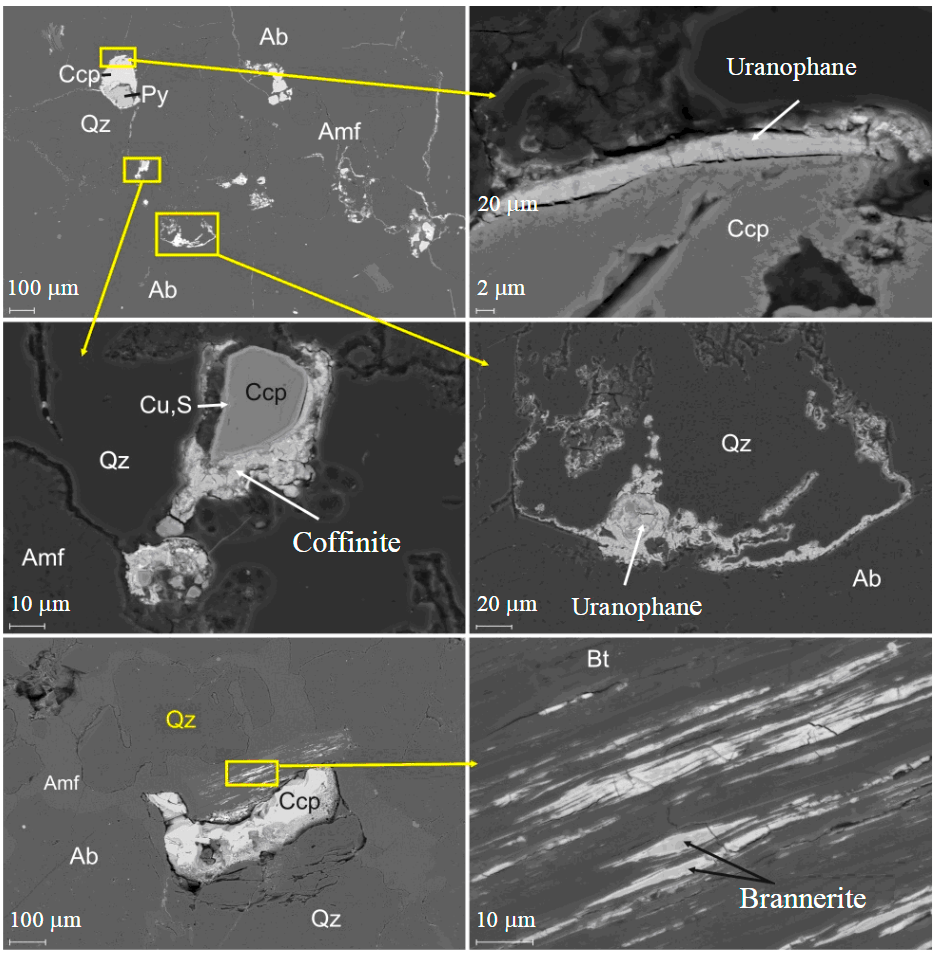
Fig.5. Sulfide and uranium mineralization in sample 119-1 (photo SEM, BSE) Amf – amphibole; Ab – albite; Bt – biotite; Qz – quartz; Py – pyrite; Ccp – chalcopyrite
The analysis of Raman spectra obtained for GLI in quartz made it possible to establish that the liquid phase of both types of inclusions is represented by an aqueous solution of different salinity, as indicated by different shape of characteristic water peaks in the region of 3,000-3,700 cm–1 [25]. In the spectra of gas phase of inclusions, peaks characteristic of molecular oxygen (peak 1,550 cm–1) and hydrogen (peaks 586 and 4,126, 4,143, 4,154, 4,161 cm–1) were found [25]. No other gases were found. Type II inclusions are characterized by a higher oxygen content than type III inclusions. Gas ratio in the mixture is 40 vol.% O2 to 60 vol.% H2 in type II inclusions and 15 vol.% O2 to 85 vol.% H2 in type III inclusions.
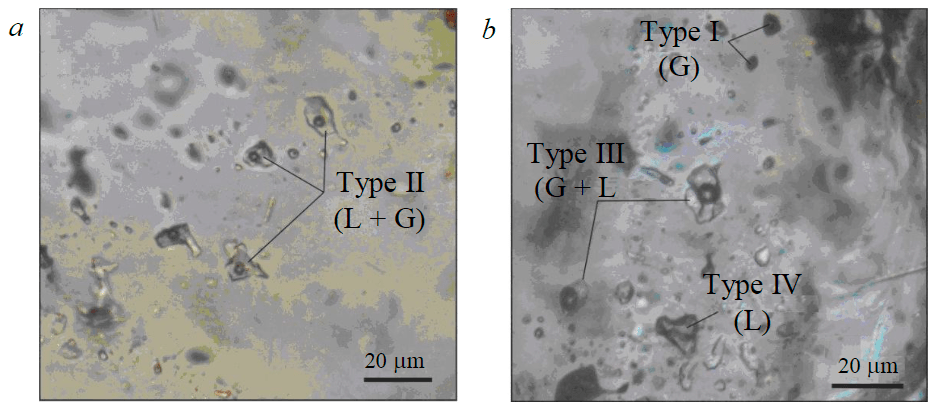
Fig.6. Photomicrographs of fluid inclusions in quartz of rocks at Litsa ore occurrence: a – two-phase type II GLI; b – group of inclusions represented by two-phase type III GLI, single-phase gas type I inclusions and single-phase type IV liquid inclusions
The performed cryothermal experiments made it possible to determine Tmiсe and salinity of solutions of the liquid phase of inclusions. For type II inclusions, Tmice varies from –9.8 to –14.7 °С, which corresponds to the salinity of 13.72-18.4 wt.% NaCl-eq [27].
For type III inclusions, Tmiсe is within –1 and –6 °С, which corresponds to 1,7-9,2 wt.% NaCl-eq. It was impossible to measure the reliable eutectic temperature in the course of experiments due to a small size of inclusions and limitations of the optical microscope.
Complete homogenization of both types of GLI occurred in the liquid phase in the temperature range from 200 to 310 °С with the maximum frequency for type II inclusions of about 300 °С, and for type III inclusions of about 205 °С. Since the studied GLI were presumably captured under the conditions of initial fluid boiling, the homogenization temperature will be equal to the inclusion formation temperature, and there is no need to introduce pressure corrections.
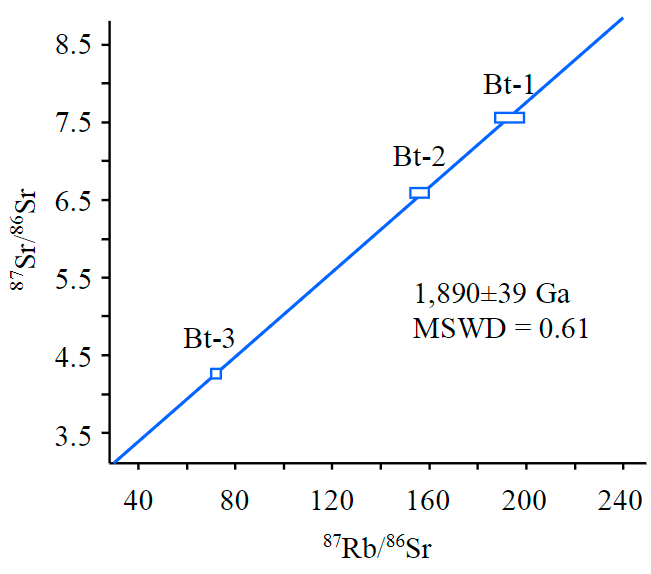
Fig.7. Rb-Sr data for biotite isolated from gneissose granite samples within the study area at Litsa ore occurrence
Three samples of biotite gneisses 118-1, 119-1 and 123 were taken for dating (see Fig.2, b, Table 2). The Rb-Sr method was chosen as clearly recording the low-temperature hydrothermal processes [28]. Biotite and plagioclases were isolated from all samples.
Based on the rock and plagioclases of sample 118-1, ages of 1,631 (albite-rock) and 1,534 Ma (oligoclase-rock) were obtained, most likely, reflecting the disturbance of the Rb-Sr system. Based on biotite fractions from three samples, an age of 1,890 ± 39 Ma was determined (Fig.7) which agrees with the age of thorium-uranium mineralization of the first stage.
Table 2
Rb-Sr data for rocks and minerals of Litsa ore occurrence
|
Mineral/rock |
Content, g/t |
87Rb/86Sr |
87Sr/86Sr |
|
|
Rb |
Sr |
|||
|
Sample118-1 (biotite gneiss) |
||||
|
WR |
128.0 |
89.7 |
4.02734 |
0.80490 |
|
Ab (albite) |
25.8 |
230.3 |
0.31638 |
0.71794 |
|
Pl (oligoclase) |
15.1 |
88.2 |
0.48249 |
0.72686 |
|
Biotite from samples 118-1, 119-1, 123 (biotite gneiss) |
||||
|
Bt-1 |
594.8 |
10.5 |
157.42 |
6.6102 |
|
Bt-2 |
724.7 |
10.6 |
193.63 |
7.5562 |
|
Bt-3 |
418.5 |
16.0 |
73.70 |
4.3131 |
Discussion of results
Mineralogical studies and data from previous studies allow reconstructing the following age sequence of mineral formation: uraninite – sulfides (pyrite, chalcopyrite) – uranophane, coffinite, pitchblende. Uraninite is earlier judging by U-Pb dating and according to the observations of A.V.Savitsky et al. [4], who noted the presence of uraninite in the form of small, rounded grains isolated from intergrowths of pitchblende and coffinite. Coffinite and uranophane develop along the grain boundary of sulfide minerals; i.e., are later than they are. The age of brannerite is not obvious, but based on the dike age of about 1 Ga [5] brannerite formed as a result of superimposed Paleozoic hydrothermal processes.
Zircon, monazite, and uraninite develop as individual grains, while coffinite, brannerite, and uranophane fill the interlayer space along the cleavage in biotite, develop around grains of sulfides and quartz, i.e., fill voids and cracks, thereby lowering anisotropy at the level of rock. According to previous studies, the distribution of ore minerals can affect the elastic anisotropy of rocks [29].
Since ore mineralization is associated with cataclasis and brecciation zones, which are the most permeable for hydrothermal fluids, rocks containing uranium mineralization should be higha-nisotropic. Based on the distribution of minerals, it can be assumed that the first Th-U mineralization manifested in the formation of monazite, zircon and uraninite will not lead to a decrease in rock anisotropy. An example is the Beregovoye ore occurrence, which lies in the neighborhood of Litsa and has similar age dates. In leucogranites of the Beregovoye ore occurrence, monazite and zircon are abundant at the boundary of biotite and quartz grains. Uranium content in rock is 60 g/t; rock has a massive texture and is high-anisotropic (elastic anisotropy coefficient is 98 %) [29].
Uranium mineralization manifested in Paleozoic with formation of pitchblende, coffinite and secondary uranium minerals reduces the anisotropy of rocks filling the porous-fractured space, as evidenced by gneiss samples from the Litsa area with a lower elastic anisotropy index (see Fig.3).
Distribution of physical properties of rocks reflects two stages in the formation of mineralization with different uranium distribution and occurrence form in rocks. Probably, the eastern and western halves of the petrophysical line (see Fig.3) are tracing blocks with U-mineralization of different nature and age, which confirms the conclusion of A.V.Savitsky [23]. In the eastern part, uranium is concentrated in interlayer spaces of layered silicates (biotite in biotite gneisses). In the course of migmatization, the elastic anisotropy index of rocks decreases. The western part of the area is dominated by uranium in the form of single grains (monazite – uraninite – zircon) of inclusions in biotite in plagiogranites and inclusions in sulfides in near-contact zones of mafic dikes.
Primary fluid inclusions in quartz of rocks of the Litsa mineralization are most often found in groups that comprise types of inclusions differing in phase composition and ratio. Probably, the variegated composition of these associations may indicate a heterogeneous capture of inclusions during boiling of a single-component aqueous solution of NaCl [21]. Gas phase in this case is initially represented by low-density water vapour, which under the effect of water radiolysis dissociated into O2 and H2. This also confirms the absence of other gases in concentrations sufficient for determination. The presence of molecular hydrogen and oxygen is characteristic of uranium deposits [30]. Oxygen and hydrogen were captured in the gas phase of inclusions after dissociation, otherwise the volume ratio of these gases would be the same for all syngenetic inclusions [31]. The loss of volatile components or “boiling” was proposed [32] to explain the evolution processes of fluids in metamorphic rocks. It is assumed that this mechanism is very effective for ore deposition of many metals in hydrothermal systems in near-surface conditions [21].
Along with such important factors as “boiling up” and cooling which contributed to the precipitation of uranium, the influence of an additional factor is also possible, which is mixing of two different fluids with different salt and gas compositions. Salinity of the initial solution captured by inclusions at the Litsa ore occurrence varies from medium-high (13.7-18.4 wt.% NaCl-eq.) to low (1.7 wt.% NaCl-eq.). The same data were obtained for fluid inclusions in quartz at the neighbouring Beregovoe ore occurrence (see Fig.1), where early fluid inclusions (1.85-1.75 Ga) of medium high salinity (7-21 wt.% NaCl-eq.) with Mg and Ca salts, which can be correlated with type II GLI, and late inclusions of low-medium salinity (0.2-14 wt.% NaCl-eq.) with Na and K salts which can be compared with type III GLI were recorded. Early fluids with a predominantly CO2 gas phase mixed with later fluids with the gas phase enriched in nitrogen and methane, i.e., the earlier oxidized fluid contributed to leaching of uranium and its conversion into a soluble state in the form of a uranyl carbonate ion. Later, reduced fluid forming as a result of the Hercynian tectonomagmatic activation contributed to reduction and precipitation of uranium [33]. This conclusion agrees with earlier conclusions of geochemists on redistribution of uranium during the Paleozoic tectonothermal activation at the Litsa and Beregovoye ore occurrences and explains a wider range of uranium minerals forming at this stage of ore-bearing systems development [2].
The obtained Rb-Sr age of biotite (1,890 ± 39 Ma) is consistent with the age of the first stage of uranium mineralization and reflects the first stage of metasomatic transformations in rocks according to the stages of metasomatism distinguished by V.B.Petrov at the Litsa ore occurrence: biotite replacement by chlorite, desilication, accumulation of chlorite, carbonate, and hematite in cavities, replacement of plagioclase by chlorite, sericite, albite, and precipitation of uranium from solution at the flanks of the metasomatic column [19]. Since the age of gneisses in the Litsa area, according to U-Pb data on zircon, is 2.8 Ga [34], the obtained Rb-Sr age of biotite reflects the closure of its isotope system at temperature not exceeding 300-350 °С [35, 36]. The age of albite and oligoclase (1,631-1,534 Ma) is, probably, a consequence of isotope imbalance during albitization (the result of mixing and capture of radiogenic Sr during replacement of previous minerals).
Fluid inclusion homogenization temperature of about 200-310 °С is consistent with Rb-Sr datings showing that after 1.89 Ga rock temperature did not rise above 300-350 °С. Homogenization temperature for type II and III inclusions (300 and 205 °С, respectively) directly reflects the temperature of the first Paleoproterozoic (1.85-1.75 Ga) and second Paleozoic (400-380 Ma) stages of uranium mineralization at the Litsa ore occurrence and allows a more precise definition of temperature of 220-280 °С earlier recorded for uranium-bearing metasomatites [3].
Conclusion
Based on the mineralogical study, the sequence of ore mineral formation in rocks of the Litsa ore occurrence was reconstructed: uraninite – sulfides (pyrite, chalcopyrite) – uranophane, coffinite, pitchblende.
The study of fluid inclusions in quartz from rocks of the Litsa ore occurrence showed the presence of gas, two-phase gas-liquid and aqueous inclusions. According to the Raman spectroscopy, the liquid phase of gas-liquid inclusions is represented by an aqueous solution of medium-high salinity (13.7-18.4% NaCl-eq.), aqueous inclusions of low-medium salinity (1.7-9.2 wt.% NaCl-eq.). Peaks characteristic of molecular oxygen and hydrogen were found in the gas phase. Diverse composition of fluid inclusions in quartz indicates their heterogeneous capture during boiling of an aqueous solution, which is, probably, one of the mechanisms of ore deposition in hydrothermal systems under near-surface conditions.
Rb-Sr age of biotite (1,890±39 Ma) reflects the first stage of hydrothermal alteration of rocks and uranium mineralization. Homogenization temperature of inclusions in the liquid phase made it possible to determine the temperatures of the Paleoproterozoic and Paleozoic stages of uranium mineralization at the Litsa ore occurrence – about 300 and 200 °С, respectively.
Distribution of physical properties of rocks in the area is consistent with the presence of two time stages in the formation of mineralization with different distribution and form of uranium occurrence in rocks, which is confirmed by mineralogical studies. The factors reducing rock anisotropy are the processes of migmatization and hydrothermal ore mineralization, which heal pores and cracks.
Petrophysical studies aimed at comparing the elastic anisotropy of rocks with the level of their radioactivity were performed for the Litsa ore area for the first time. Due to them, it was concluded that there is a correlation between the spatial distribution of elastic anisotropy index and an increased radioactive background, which makes it possible to use this petrophysical feature as one of the predictive criteria for uranium and complex uranium mineralization when carrying out prognostic work for uranium.
References
- Afanaseva E.N., Mironov Yu.B. Uranium Metallogeny of the Baltic Shield. Prospect and protection of mineral resources. 2015. N 10, p. 82-88 (in Russian).
- Afanas'eva E.N., Mikhaylov V.A., Bylinskaya L.V. et al. Uranium Presence in the Kola Peninsula. Materialy po geologii mestorozhdeniy urana, redkikh i redkozemel'nykh metallov. Moscow: VIMS, 2009. Iss. 153, p. 18-26 (in Russian).
- Kalinin A.A., Kaulina T.V., Lyalina L.M. et al. Stages in the Formation of Uranium Mineralization in the Salla-Koulajarvinskaya Zone (Northern Karelia): Geological and Isotope Geochronological Data. Geology of Ore Deposits. 2016. Vol. 58. N 7, p. 594-599. DOI: 10.1134/S1075701516070047
- Savitskiy A.V., Gromov Yu.A., Mel'nikov E.V., Sharikov P.I. Uranium Mineralization of Litsa Area in the Kola Peninsula (Russia). Geologiya rudnykh mestorozhdeniy. 1995. N 5, p. 403-416 (in Russian).
- Serov L. Métallogenèse de l’uranium dans la région de Litsa (Péninsule de Kola, Russie). Docteur de l’Université Henry Poincaré (en géosciences). Nancy: Soutenance publique, 2011, p. 166.
- Kazansky V.I., Isanina E.V., Lobanov K.V. et al. Geological-geophysical setting, seismogeological boundaries, and metallogeny of the Pechenga ore district. Geology of Ore Deposits. 2002. Vol. 44. Iss. 4, p. 242-251.
- Early Precambrian of the Baltic Shield. Ed. V.A.Glebovitskii. St. Petersburg: Nauka, 2005, p. 711 (in Russian).
- Sorokhtin N.O., Kozlov N.E., Glaznev V.N., Martynov E.V. A Study in Earth’s Geological Evolution (The Baltic Shield). Hoboken: John Wiley & Sons, 2020, p. 608.
- Vysokoostrovskaya E.B., Abramovich I.I. Deep Geodynamics of the Largest Uranium Deposits. Rossiyskiy geofizicheskiy zhurnal. 2016. N 55-56, p. 102-108 (in Russian).
- Minaev V.A., Burmistrov A.A., Petrov V.A., Poluektov V.V. Identification and Application of Petrophysical Anomalies for the Forecast of Ore Mineralization on Antei Uranium Deposit (South-Eastern Transbaikalia). Vestnik Moskovskogo Universiteta. Seria 4: Geologia. 2016. N 2, p. 24-33 (in Russian). DOI: 10.33623/0579-9406-2016-2-24-33
- Saltykov A.S., Kutueva O.V., Avdonin G.I. Geotechnological Field Experiments Conducted During the Evaluation Stage. Prospect and protection of mineral resources. 2018. N 7, p. 44-51 (in Russian).
- Kazanskiy V.I., Lobanov K.V., Kuznetsov A.V. Three-Dimensional Geological Model of the Pechenga Ore Area. Seysmologicheskaya model' litosfery severnoy Evropy: Laplandsko-Pechengskiy rayon. Apatity: Kol'skiy nauchnyy tsentr RAN, 1997, p. 157-181 (in Russian).
- Lobanov K.V., Kazanskiy V.I., Kuznetsov A.V. et al. Comparison of Archean Rocks from the Super Deep Well Section and Their Equivalents from the Surface Based on Results of Structural Petrological, Petrophysical and Neutron Diffraction Studies. Petrologiya. 2002. Vol. 10. N 1, p. 30-45 (in Russian).
- Starostin V.I. Paleotectonic Regimes and Formation Mechanisms of the Structures of Ore Deposits. Moscow: Nedra, 1988, p. 261 (in Russian).
- Konstantinov A.K., Mashkovtsev G.A., Miguta A.K. et al. Uranium of the Russian Subsoil. Moscow: VIMS, 2010, p. 855 (in Russian).
- Dahlkamp F.J. Uranium Deposits of the World: USA and Latin America. Berlin: Springer, 2010, p. 520.
- Konoplev A.D., Korotkov V.V., Kostikov A.T. et al. Geological and Industrial Types of Uranium Deposits of the CIS States. Moscow: VIMS, 2008, p. 72 (in Russian).
- Vinogradov A.N., Vinogradova G.V., Pripachkin V.A. Formation Conditions of Soda Metasomatites in Zones of Paleozoic Tectono-Hydrothermal Activation of the Northeastern Baltic Shield. Metasomatoz i metasomatity v metamorficheskikh kompleksakh dokembriya. 1981, p. 105-110 (in Russian).
- Belyaev G.M., Blyuman B.A., Vishnevskaya Yu.E. et al. Regional Metamorphic Metasomatic Formations: Principles and Methods of Assessing Ore Presence in Geological Formations. Leningrad: Nedra, 1983, p. 280 (in Russian).
- Il'chenko V.L. Results of the Study of Anisotropy of Elastic Properties of Rocks from the Luchlompolo Fault Zone (Pechenga Region, Kola Peninsula). Izvestiya, Physics of the Solid Earth. 2009. Vol. 45. N 3, p. 239-247. DOI: 10.1134/S1069351309030057
- Redder E. Fluid Inclusions in Minerals: in 2 Volumes. Moscow: Mir, 1987. Vol. 1, p. 557 (in Russian).
- Bayanova T.B. Age of Marker Geological Complexes of Kola Region and Duration of Magmatic Processes. St. Petersburg: Nauka, 2004, p. 174 (in Russian).
- Savitskiy A.V. Results of Petrophysical Studies of Rocks of the Faults of Ancient Platform Basement. Petrophysical Studies on Shields and Platforms. Apatity: KFAN SSSR, 1984, p. 109-111 (in Russian).
- Whitney D.L., Evans B.W. Abbreviations for names of rock-forming minerals. American Mineralogist. 2010. Vol. 95, p. 185-187.
- Xiaolin Wang, Wenxuan Hu, I-Ming Chou. Raman spectroscopic characterization on the OH stretching bands in NaCl ‒ Na2CO3 ‒ Na2SO4 ‒ CO2 ‒ H2O systems: Implications for the measurement of chloride concentrations in fluids inclusions. Journal of Geochemical Explorations. 2013. Vol. 132, p. 111-119. DOI: 10.1016/j.gexplo.2013.06.006
- Frezzotti M.L., Tecce F., Casagli A. Raman spectroscopy for fluid inclusion analysis. Journal of Geochemical Exploration. 2012. Vol. 112, p. 1-20. DOI: 10.1016/j.gexplo.2011.09.009
- Bodnar R.J., Vityk M.O. Interpretation of Microthermometric Data for H2O-NaCl Fluid Inclusions. Fluid Inclusions in Minerals: Methods and Application. Pontignsno-Siena. 1994, p. 117-130.
- Glebovitskii V.A., Bushmin S.A., Bogomolov E.S. et al. Rb-Sr Age of Metasomatism and Ore Formation in the Low-Temperature Shear Zones of the Fenno-Karelian Craton, Baltic Shield. Doklady Earth Sciences. 2012. Vol. 445. N 1, p. 821-825. DOI: 10.1134/S1028334X12070021
- Il’chenko V., Gannibal M. Elastic anisotropy and internal structure of rocks from the uranium ore occurrences of the Litsa ore area (Kola region, Russia). Geosciences. 2019. Vol. 9. Iss. 7. N 284. DOI: 10.3390/geosciences9070284
- Naumov V.B., Dorofeev V.A., Mironova O.F. Physicochemical parameters of the formation of hydrothermal deposits: a fluid inclusion study. I. Tin and tungsten deposits. Geochemistry International. 2011. Vol. 49. N 10, p. 1002-1021. DOI: 10.1134/S0016702911100041
- Dubessy J., Poty B., Ramboz C. Advances in C-O-H-N-S fluid geochemistry based on micro-Raman spectrometric analysis of fluid inclusions. European Journal of Mineralogy. 1989. N 1, p. 517-534.
- Trommsdorff V., Skippen G. Vapour loss (“Boiling”) as mechanism for fluid evolution in metamorphic rocks. Contib. Mineral Petrol. 1986. Vol. 94, p. 317-322. DOI: 10.1007/BF00371440
- Kaulina Т.V., Avedisyan А.А., Ryabukha M.А., Il’chenko V.L. Composition of Fluid Inclusions in Quartz From Rocks of the Beregovoe Site, Litsa Uranium-ore Area, Kola Region. Zapiski RMO (Proceedings of the Russian Mineralogical Society). 2020. Vol. 149. N 3, p. 111-125 (in Russian). DOI: 10.31857/S086960552003003X
- Kaulina T., Lialina L., Kamenetsky V. et al. Composition and structure of zircon from hydrothermal uranium occurrences of the Litsa ore area (Kola region, Russia). Geosciences. 2020. Vol. 10. Iss. 8. N 278. DOI:10.3390/geosciences10080278
- Jenkin G., Ellam R., Rogers G., Stuart F. An investigation of closure temperature of the biotite Rb-Sr system: The important of cation exchange. Geochim Cosmochim Acta. 2001. Vol. 65. Iss. 7, p. 1141-1160. DOI: 10.1016/S0016-7037(00)00560-3
- Nebel O., Mezger K. Timing of thermal stabilization of the Zimbabwe Craton deduced from high-precision Rb–Sr chronology, Great Dyke. Precambrian Res. 2008. Vol. 164. Iss. 3-4, p. 227-232. DOI: 10.1016/j.precamres.2008.05.003