Remote sensing techniques in the study of structural and geotectonic features of Iturup Island (the Kuril Islands)
- 1 — Ph.D., Dr.Sci. Head of Department Saint Petersburg Mining University ▪ Orcid
- 2 — Postgraduate Student Saint Petersburg Mining University ▪ Orcid
- 3 — Ph.D. Head of Department A.P.Karpinsky Russian Geological Research Institute ▪ Orcid
- 4 — Ph.D. Assistant Saint Petersburg Mining University ▪ Orcid

Abstract
The article presents structural and geotectonic features of Iturup Island, the largest island in the Greater Kuril Ridge, a unique natural site, which can be considered as a geological reference. The structural and geotectonic analysis carried out on the basis of a comprehensive study of the new Earth remote sensing data, maps of anomalous geophysical geophysical fields, and other geological and geophysical materials using modern modelling methods made it possible for the first time to identify or clarify the location of previously discovered discontinuous faults, typify them and determine the kinematics, as well as to establish a more reliable spatial relationship of the identified structures with magmatism with the stages of the geological development of the region. The constructed diagram of the density distribution of the zones with increased tectonic fracturing shows a significant correlation between the distribution of minerals and weakened areas of the Earth's crust and can be used as an alternative method for predicting minerals in the study region, especially in remote and hard-to-reach areas. The presented approach can be extended to the other islands of the Greater Kuril Ridge, thereby bringing research geologists closer to obtaining the answers to questions about the features of the geotectonic structure and evolution of the island arc. The use of customized software products significantly speeds up the process of interpreting a large array of geological and geophysical data.
None
Introduction
Ideas about the geotectonic structure of the Kuril Islands have been debatable for many decades. Until the end of World War II, South Sakhalin and the Kuril Islands remained terra incognita for Soviet scientists. In 1951, the first integrated geological exploration on Iturup Island led by P.A.Pyankov identified two large discontinuous faults, longitudinal to the general northeast strike of the island, in its southern and central parts. During the compilation of the state geological maps at various scales, tectonic displacements of the Kuril Islands were successively studied by Yu.S.Zhelubovsky, V.E.Bevz, P.Yu.Kovtunovich [1-3]. Features of regional fault tectonics are reflected in the monographs by M.I.Streltsov, K.F.Sergeev [4-6]. In recent years, the geodynamics and deep structure in the region have been studied by G.P.Avdeiko and T.K.Zlobin [7-9].
Most authors distinguish two main groups of tectonic faults: longitudinal and transverse to the strike of the Greater Kuril Ridge, while constantly revising the geographical distribution of displacements, their kinematics, age, and genesis. The issues related to the parameters of the seismic focal zone and the distribution of earthquake hypocentres remain unclear [10]. Moreover, the study of the elements of the regional tectonic structure is important not only for understanding its geological evolution [5, 11, 12], but also for studying the distribution of tectonic stresses within its limits, earthquake prediction [13, 14], and the patterns of minerals distribution [14, 15].
This study clarifies the geotectonic structure of the Kuril island arc as a reference target of the island arc systems (exemplified by Iturup Island). To do this, it is necessary to select the optimal method for geotectonic analysis using geological and geophysical data and remote sensing materials, to interpret and determine the features of fault tectonics in Iturup Island, clarify the role of discontinuous faults in the geological history of the region.
The Kuril island arc is in the northwestern part of the Pacific Ocean. It is an arcuate chain of the islands that crown an elongated underwater uplift and separate the Kuril Basin from the deep-water Kuril-Kamchatka Trench (Fig.1). According to modern concepts, the arc was formed at the convergent boundary of the Sea of Okhotsk and Pacific lithospheric plates as a result of subduction of the latter [16-18].
The Kuril island arc connects the southern tip of the Kamchatka Peninsula with the Hokkaido Island, while the Kuril-Kamchatka deep-water trench connects the Aleutian and Japanese forearc basins (Fig.1). The Kuril island arc (the Great Kuril Ridge) is a sequence of volcanic islands 1150 km long with an average width of 100-200 km [19].
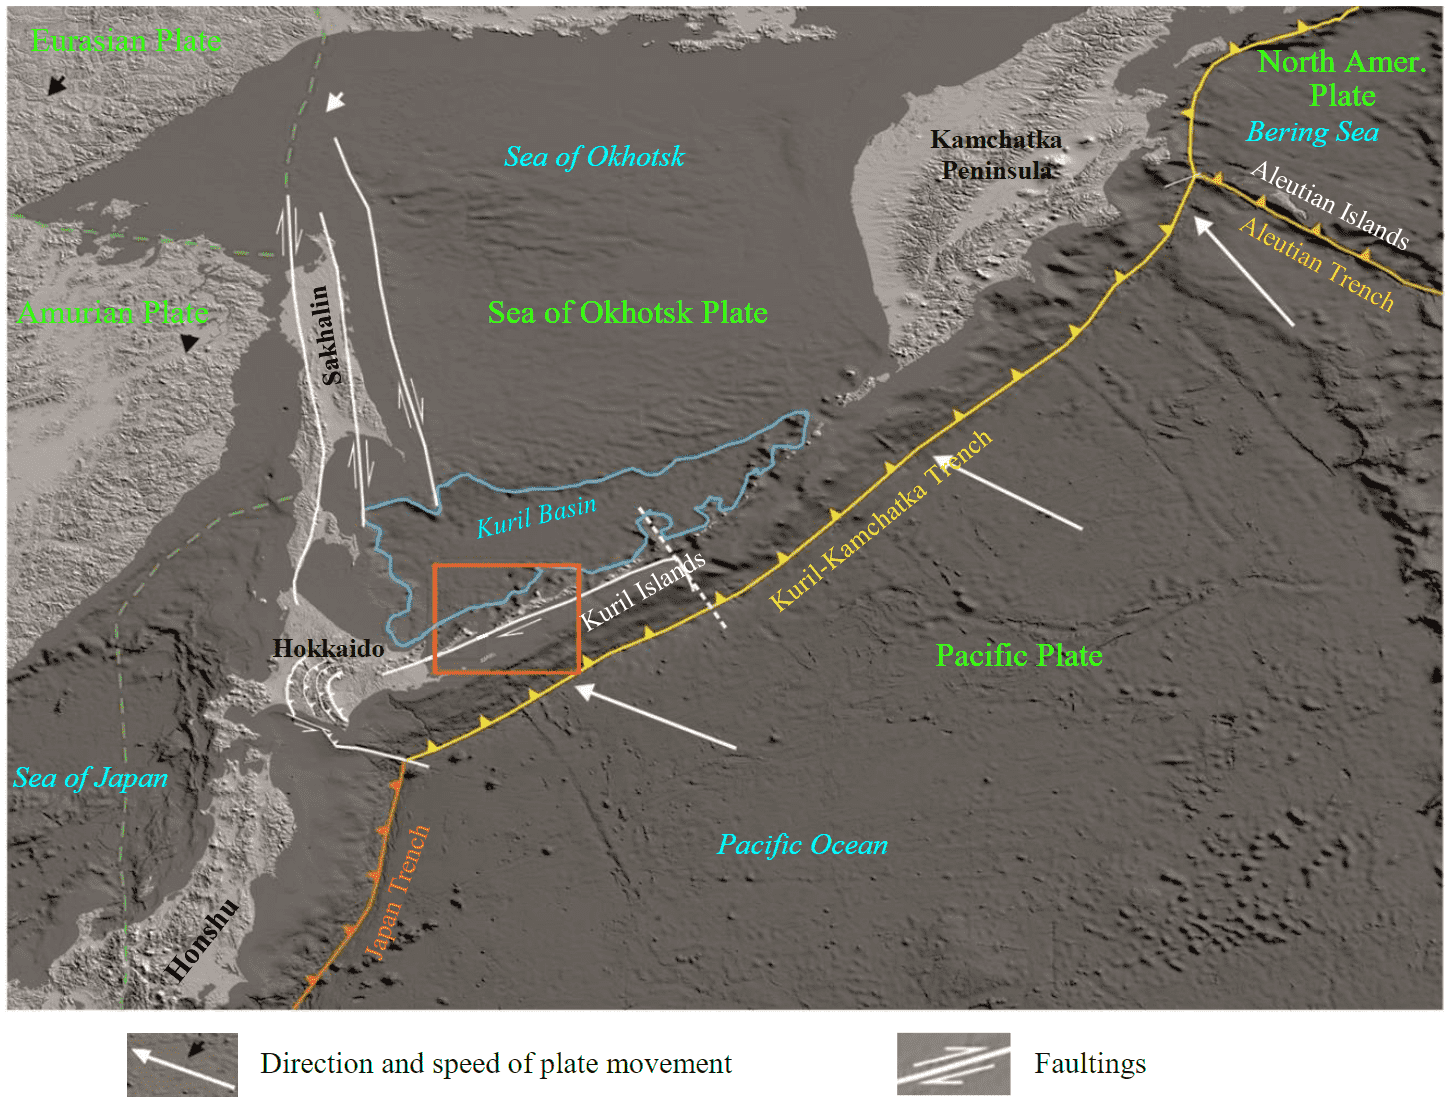
Fig.1. Tectonic scheme of the northwestern margin of the Pacific plate. Study area – Iturup – marked with a red frame
This study investigates Iturup Island, the largest island in the Kuril archipelago, located in its southern part (Fig.1). The island extends from northeast to southwest for 200 km, it is from 7 to 27 km wide, and its area is 3175 km2. The modern topography of Iturup is geomorphologically very young, strongly mountainous with steep slopes and numerous waterfalls, one of which, Ilya Muromets, is one of the highest in Russia (141 m).
From a geological point of view, the island was formed by the Neogene-Quaternary, mainly volcanic-sedimentary rocks (Fig.2), which are intruded by comagmatic subvolcanic and extrusive-vent formations. The lower part of the Neogene rock sequence is composed of strongly displaced deposits of the Rybakovskaya (Late Miocene-Pliocene) formation, represented by facially variable mafic, intermediate, and, less often, felsic volcanic, volcanogenic clastic, and volcanogenic sedimentary rocks. These rocks are conformably overlain by effusive-pyroclastic Pliocene formations of felsic composition of the Kamuyskaya Fm. Quaternary volcanics are products of eruptions from more than 40 volcanoes, eight of which are active. They are represented by a wide range of rocks, from basalts and andesites of the Bogatyrskaya sequence to dacites and rhyodacites of the Golovninskaya and Rokovskaya formations. The Lower Pleistocene plateau effusive rocks of the Fregatskaya sequence occupy an intermediate position between the Neogene and Quaternary volcanic rocks. They consist mainly of basalt, basaltic andesite, less often andesite flows [2, 20, 21].
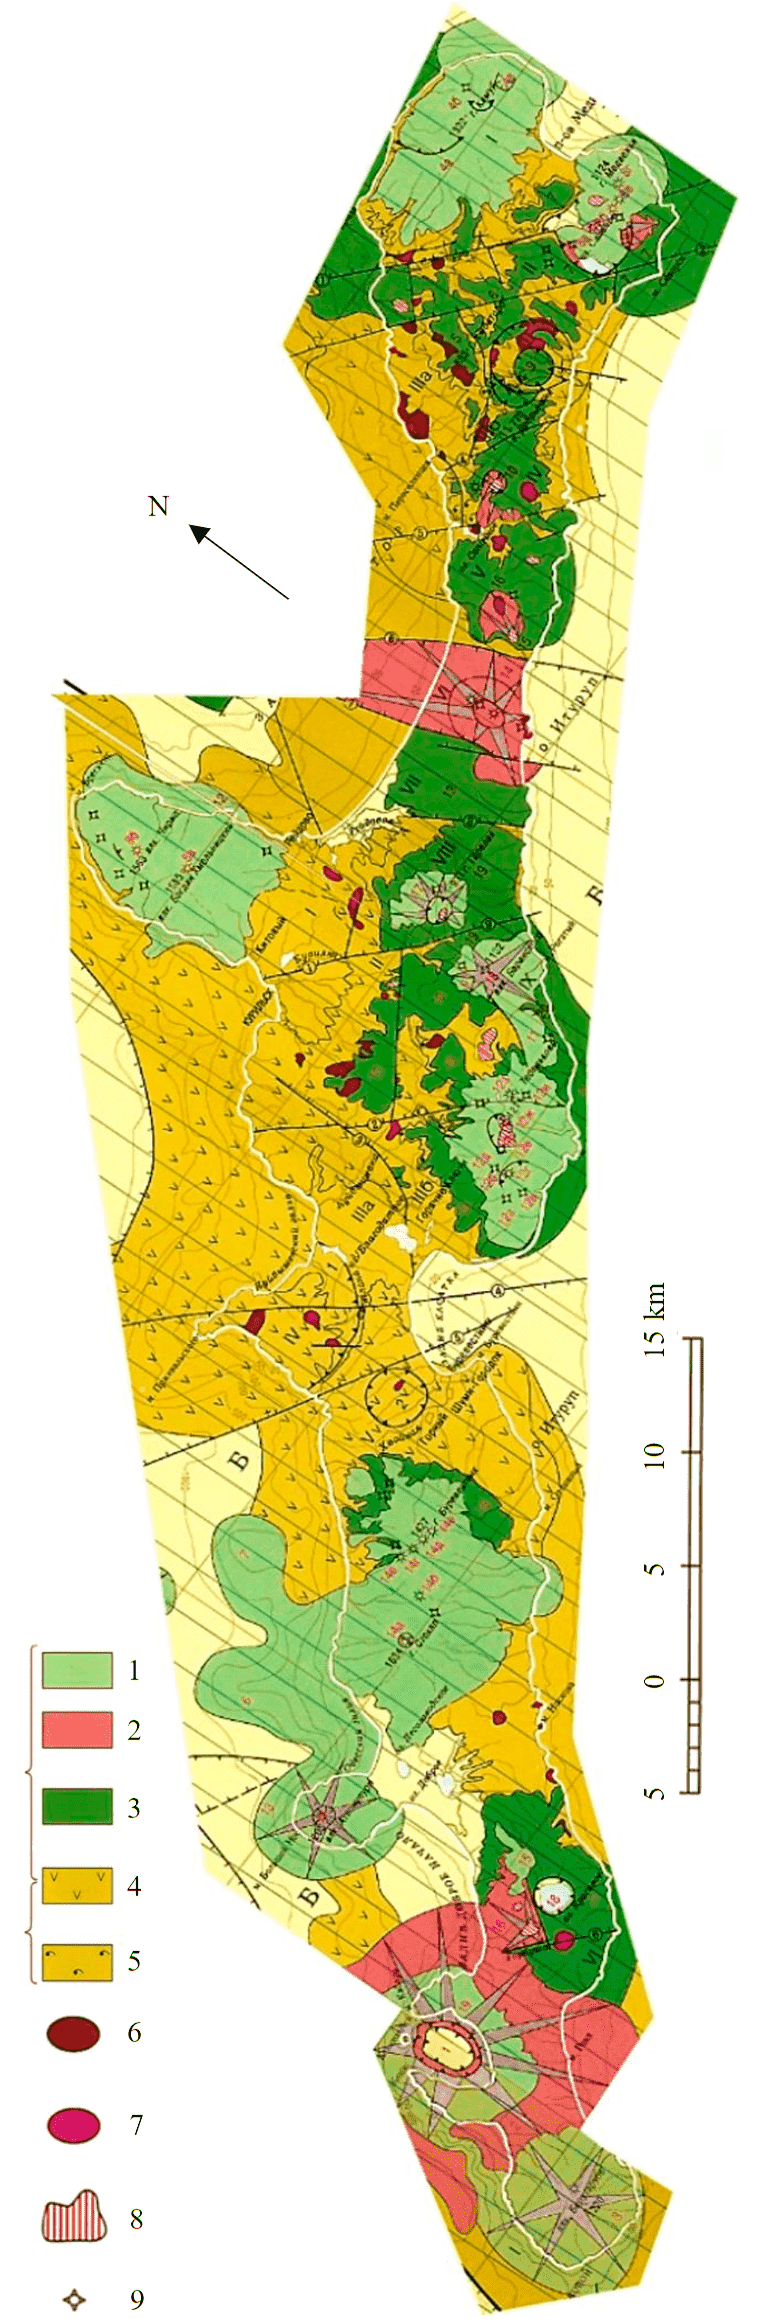
Fig.2. Geological diagram of Iturup Island (scale 1:1 000 000) 1-5 – volcanogenic and volcanogenic sedimentary formations Quaternary and Pliocene-Quaternary: 1 – subaerial Neopleistocene-Holocene volcanoes of single and linear nested type, intermediate and mafic composition (Bogatyrsky volcanic complex); 2 – subaerial and subaqueous Eopleistocene – Late Pleistocene volcanoes, represented by pyroclastics of dacite-rhyodacite composition (Golovninsky and Rokovsky volcanic complexes); 3 – subaerial flat shield-like stratovolcanoes, linear-nested type structures and lava plateaus of the Pliocene-Early Neopleistocene (Fregatsky volcanic complex, Pliocene-Quaternary seismic volcanic complex in the water area) of intermediate and mafic composition Miocene-Pliocene and Pliocene:4 – subaquatic volcanoclastic and volcanogenic sedimentary Late Miocene-Pliocene (Rybakovsky volcanic complex and Late Miocene-Pliocene seismic volcanic complex) and Pliocene-Early Neopleistocene formations (Fregatsky volcanic complex and Pliocene-Quaternary seismic volcanic complex) of intermediate and mafic composition; 5 – subaerial Late Pliocene effusive pyroclastic formations of felsic composition (Kamuysky volcanic complex); Intrusive and subvolcanic Neogene bodies: 6 – felsic composition; 7 – intermediate and mafic composition Quaternary extrusive and vent bodies: 8 – shown in the diagram scale; 9 – not shown in the diagram scale
Methodology
We used an integrated approach in this research. The main interpretive element in the interpretation of satellite images (SI) and lineament analysis of geophysical anomaly fields is the lineament, a straightened system ordered element of the SI and fields, corresponding to the Earth's surface topography features and physical inhomogeneities of deep interiors: elements of plicative displacements (folds and uplifts), boundaries between geological units, discontinuous fault zones, zones of increased fracturing, etc. [22, 23]. The following lineaments are observed along the length: local (considered in the article), regional, transregional or superlineaments, and global (planetary), on the nature of which there are different views [24, 25].
Lineament diagrams can indirectly characterize fault tectonics in the study region [26]. Often lineaments are found in the ordered erosion network (erosional dissection of the Earth's surface), which allows to interpret them as weakened or permeable zones. Spatial distribution, as well as the density and number of lineament intersections per unit area are key factors for identifying highly permeable (most fractured) zones [27]. The authors of this study used this viewpoint when interpreting remote sensing data. Moreover, the applicability of the lineament analysis of space images for identification of weakened zones in the Earth's crust in the Kuril Islands is confirmed by similar works [28].
At the first stage of the study, the pre-processed remote sensing data were interpreted. According to the existing methodology [29, 30], the Sentinel-2 SIs (integrated images with a resolution of 10 m in the near infrared range) and Sentinel-1 (radar images with dual polarization: VH – horizontal and VV – vertical receptions) are optimal for automatic interpretation for identifying discontinuous faults. They can be downloaded from the USGS EarthExplorer service (earthexplorer.usgs.gov) and the Sentinel Playground service from Sentinel Hub (https://apps.sentinel-hub.com/sentinel-playground).
Lineaments in the considered SI are detected automatically by the LINE algorithm of the PCI Geomatica software, a widely applied module for automatic extraction of lineaments [30]. The revealed structures were filtered manually by comparing various automatically interpreted images with each other using ArcGIS 10.2.2 software. The structures, the presence and distribution of which is confirmed by no more than one information layer, are eliminated. Their position is clarified using a digital elevation model and topographic maps at 1:50,000 and 1:100,000 scale. In addition, ranking operation reduced the substantial number of identified structures. Its main task was to group lineaments according to certain characteristics (length, contrast of manifestation in remote sensing data). Semi-automated interpretation of space images resulted in a lineament network diagram displayed on a digital elevation model (Fig.3). Based on the results of measuring the orientation of the identified groups of linear structures, the direction diagrams of the zones of local tectonic fracturing were modelled in the RockWorks software for each group separately (Fig.4) to study the patterns of their strike. Lineament density distribution diagrams were also built using the built-in “Line Density” tool of the ArcGIS software package, which calculates the density of linear features in units of length per unit area.
At the second stage of the study, transform maps of geophysical anomaly fields were interpreted based on visual (manual) lineament analysis, which is focused on identifying the characteristic features of the fields (gradient zones, changing anomaly strikes, etc.) [26]. The maps of magnetic anomaly and gravity fields and various transforms to them were used as factual material. The axes of positive anomalies in the map of the horizontal component of the magnetic field gradient correspond to the boundaries between media with different magnetization (tectonic blocks, geological units, zones of increased fracturing, etc.) [31].
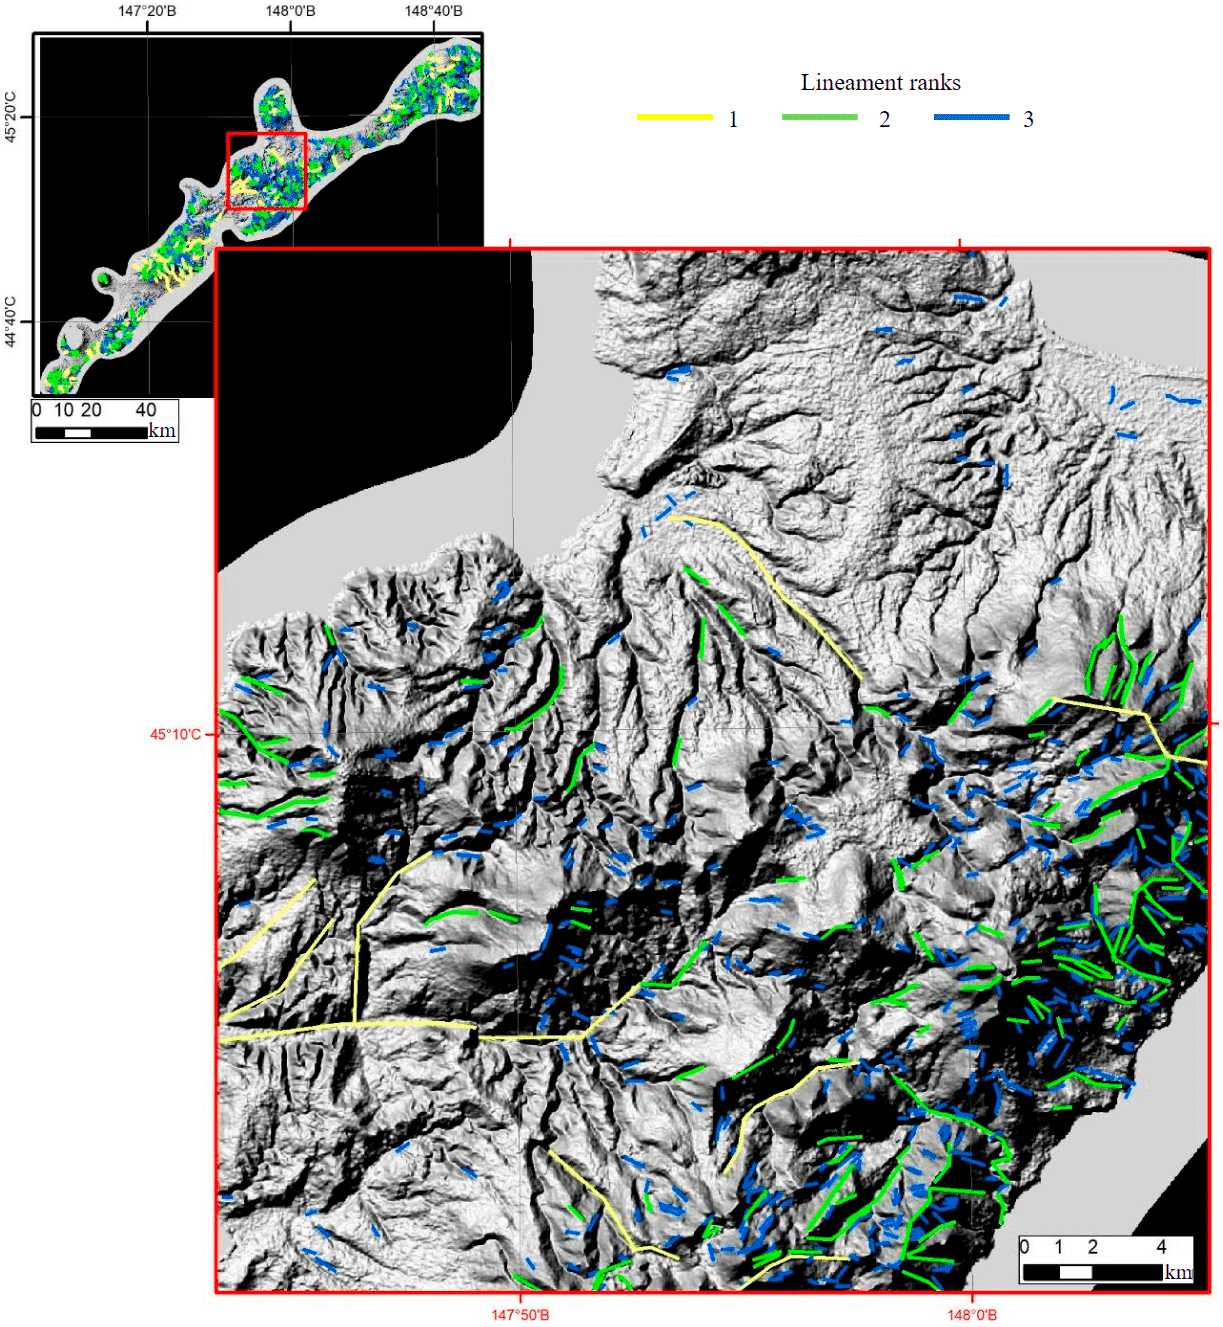
Fig.3. Scheme of the lineament network in Iturup Island (1:2,500,000; inset scale 1:200,000), on a digital elevation model (built in ArcGIS 10.2.2 software)
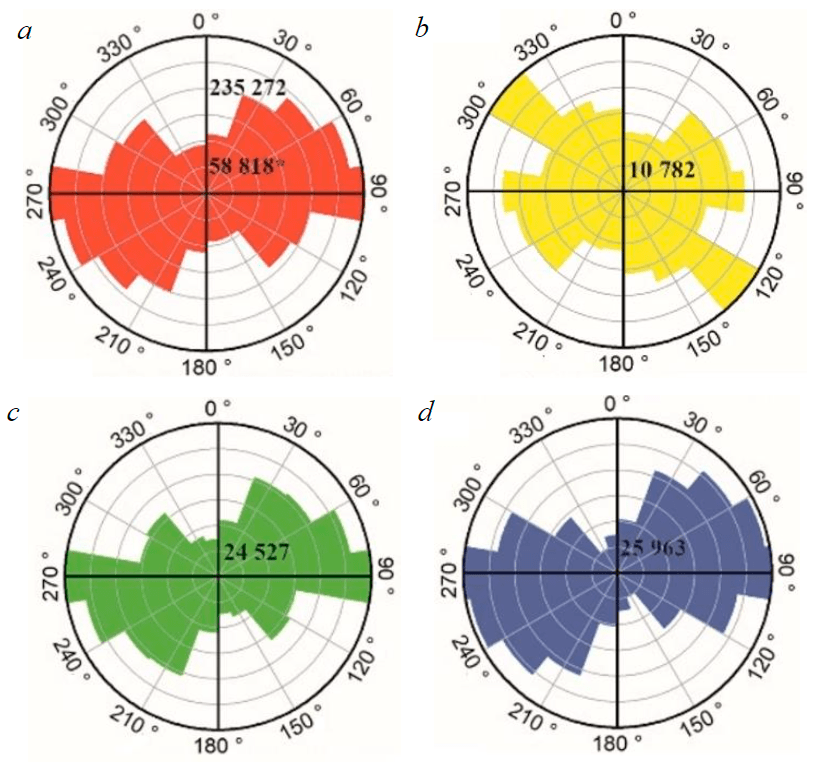
Fig.4. Direction of the zones of tectonic fracturing in Iturup Island (values are indicated by the sum of the length in a given direction in metres): a – for lineaments of all ranks; b – first; c – second; d – third rank
At the final stage, it is necessary to consider a priori geological information to prove the tectonic nature of the lineaments identified in remote and geophysical bases. The most reliable information layer for confirming the presence of tectonic faults was field observations made by the authors of this article in 2019-2020. Due to the strong turfiness of the island land and inaccessibility of some areas, large tectonic faults can be identified by mapping indirect features: the presence of brecciation zones, increased fracturing, cataclase, a network of small faults feathering the main one, thermal water sources; hydrothermally altered rocks; distinct manifestation in topography (extended ledges, depression zones, elements of the hydraulic network and other linear forms). Unfortunately, it is impossible to confirm each identified structure with field observations, but we also used field observations of predecessors in regional and prospecting works at various scales, unpublished and library materials of exploration work (large-scale maps, drilling results, electrical exploration, etc.) to identify discontinuous faults. Spatial position of each linea-ment was compared with geological mapping data. Moreover, lineament diagrams compiled from the SI and maps of potential fields were compared. Structures that contradict the geological basis (geological maps, tectonic schemes, etc.) were rejected in the visual mode. In addition, we considered the geological history of the region, which should be noted when interpreting heterogeneous data [32].
We used the data on the spatial distribution of earthquake foci to construct a diagram of faults. This made it possible to study the nature of tectonic stress in the earthquake source and its geometry. This is necessary for assessing the kinematic parameters of both individual tectonic displacement and the whole zone. To make the constructions we chose the catalogue of earthquake source mechanisms over the last 10 years according to the data of the National Research Institute for Earth Science and Disaster Prevention (NIED). Only shallow crustal earthquakes were considered, which are not included in the seismic focal zone, the depth of which in the region of the South Kurils volcanic front is 105-110 km [33] at the crustal thickness in Iturup Island area of 30-40 km [34], i.e., in the Earth's crust and part of the upper mantle.
After the final verification of the structures identified in the lineament diagrams by comparing them with each other, with field observations and other data on the geological structure of the area, we placed them in the diagram of tectonic faults of Iturup Island using ArcGIS and RockWorks software products. Based on the results of the constructions, a database of Iturup Island faults was built.
Results and discussion
After interpreting various satellite images (Sentinel 1-2) of the study region and their layer-by-layer superposition, we built a diagram of Iturup Island lineament network placed on a black-and-white digital elevation model (see Fig.3). Since the scale of constructions is 1:200,000, the diagram does not show the structures less than 200 m long. An essential element for the subsequent assessment of the distribution of tectonic fracturing in the Earth's crust is ranking the lineaments based on their length and contrast manifestation in the SI. Thus, 2855 linear structures of three ranks were distinguished on Iturup Island: 1st rank – 108 units with average length of 3352 m; 2 – 739 units with average length of 1038 m; 3 – 2008 units with average length of 431 m.
To assess the distribution patterns of the directions of local tectonic fracturing zones, we constructed rose diagrams for each selected group of lineaments (Fig.4). They can be used to determine the alleged reasons for the formation of zones. The data obtained indicate that the east-northeast (ENE) strike of the structures is dominant for the destruction zones in Iturup Island. The predominance of such a direction (Fig.4, a) can be explained by the effect of regional tectonic stress. According to the distribution analysis of focal mechanisms of earthquake foci in the Kuril island arc, the compression environment prevails. According to G.P.Avdeiko [33], the angle between the direction of motion of the Pacific Plate and the strike of the arc in the South Kurils area is 45-50°. The strike azimuth of the Kuril island arc varies from 55° in its southern part to 30° in the northern Kurils region. If we take 40° as an average value, then the direction of movement of the Pacific Plate in Iturup Island region will be 350-355°. Offset azimuths of stations in the Kuril geodynamic network for 2007-2015 for Iturup Island are approximately 305° [34]. The presence of regional compression in the north-north-west (NNW) direction can be reliably confirmed. Consequently, the revealed predominance of the ENE strike of fractured zones can be explained by the model of weakened zones formation oriented perpendicular to the compression axis [10]. In the Paramushir Island, which is in the northern part of the Kuril island arc, the tectonic fracture zones show the NE orientation [28], which can be explained by the variability of subduction parameters along the island arc [33].
Longitudinal (relative to the arc strike axis) strike is not typical (Fig.4, b) of the lineaments of the first rank. This group incorporates the largest structures, the average length of which is a few kilometres. As noted, the longitudinal orientation of the destruction zones is caused by compression in the NW-NNW direction. The initiation of transverse structures can be due to alternating modes of tension and compression in the NE direction [9]. It is highly likely that the most pronounced and extended linear structures serve as indicators of fracture zones of large faults, which, according to the existing tectonic schemes (see Fig.2), have a transverse (NW) strike.
Lineaments of the second rank often feather structures of the first rank, which causes a wide range of their strike (Fig.4, c) and maxima in the longitudinal and transverse directions. The length of these structures rarely exceeds 2000 m and averages 1000 m.
Lineaments of the third rank are the most numerous group, which incorporates the least extended structures. Due to their number, many times greater than the sum of lineaments of the first and second ranks, their strike forms a general trend (Fig.4, d).
A major step in this study was the construction of a diagram for the density distribution of the lineaments in the island (Fig.5). Density and number of lineament intersections per unit area are key factors for highlighting highly permeable (most fractured) zones [27] (coloured in red). These zones correspond to active volcanic structures: ridges (Grozny, Bogatyr) or single volcanoes (Atsonopuri, Bogdan Khmelnitsky). Increased destruction of the Earth's crust is also characteristic of areas associa-ted with explosive Neopleistocene volcanism: Vetrovoy Isthmus, Mount Golets. Moreover, the diagram shows mineral deposits (with the exception of construction materials and titanium-magnetite placers), bearing a significant correlation between the distribution of minerals and areas with increased concentration and intersections of lineaments. Thus, the diagram of tectonic fracturing zones, built with the help of a comprehensive interpretation of remote sensing materials, can be used as an alternative method for predicting minerals in remote and hardly accessible areas not only in Iturup Island, but also in the island arc as a whole.
Field observations played a key role in verifying the tectonic nature of the identified lineaments. They registered tectonic faults (Fig.6) corresponding to the extracted structures:
- Northern part of the inset (Fig.7), in the Olya Bay area, shows a series of lineaments attributed to the third rank. In the course of field work, the authors mapped a series of faults (Fig.6, a, b) and the associated zone of polymetallic mineralization (Pm). The faults are dipping near vertically with ESE and SE strikes. According to the interpretation scheme, the length of the lineament correspon-ding to the disjunctive does not exceed a few hundred meters. Strong weathering and alteration of the host rocks does not enable to establish their kinematics reliably.
- On the Sea of Okhotsk coast of Iturup Island, 1.5 km south of Cape Isoparauri, the diagram (Fig.7) marks a lineament of the second rank 1200 m long, observed along the bed of a nameless stream. Field work revealed strong bedrock fracturing in this place, which increases when approaching the stream mouth. We mapped small faults of various directions, which probably feather the main disjunctive, passing along the stream valley, and tension cracks, along which dikes intruded, with steep near-vertical dippings (Fig.6, c, d).
- Interpreting revealed a lineament of the first rank in the middle reaches of the Kuibyshevka River. The presence of a tectonic fault passing along the channel of this river is confirmed by the works of the predecessors and field observations of the authors of this article (Fig.6, e). The host rocks in the sides are strongly fractured (Fig.6, f), some fractures are up to 10 m long; the main fault is feathered by a series of thin and short faults (Fig.6, g). There are brecciation zones from a few meters to a few tens of meters thick.

Fig.5. Diagram of distribution of local tectonic fracturing zones in the upper crust of Iturup Island (1:2,500,000, inset scale 1:200,000)
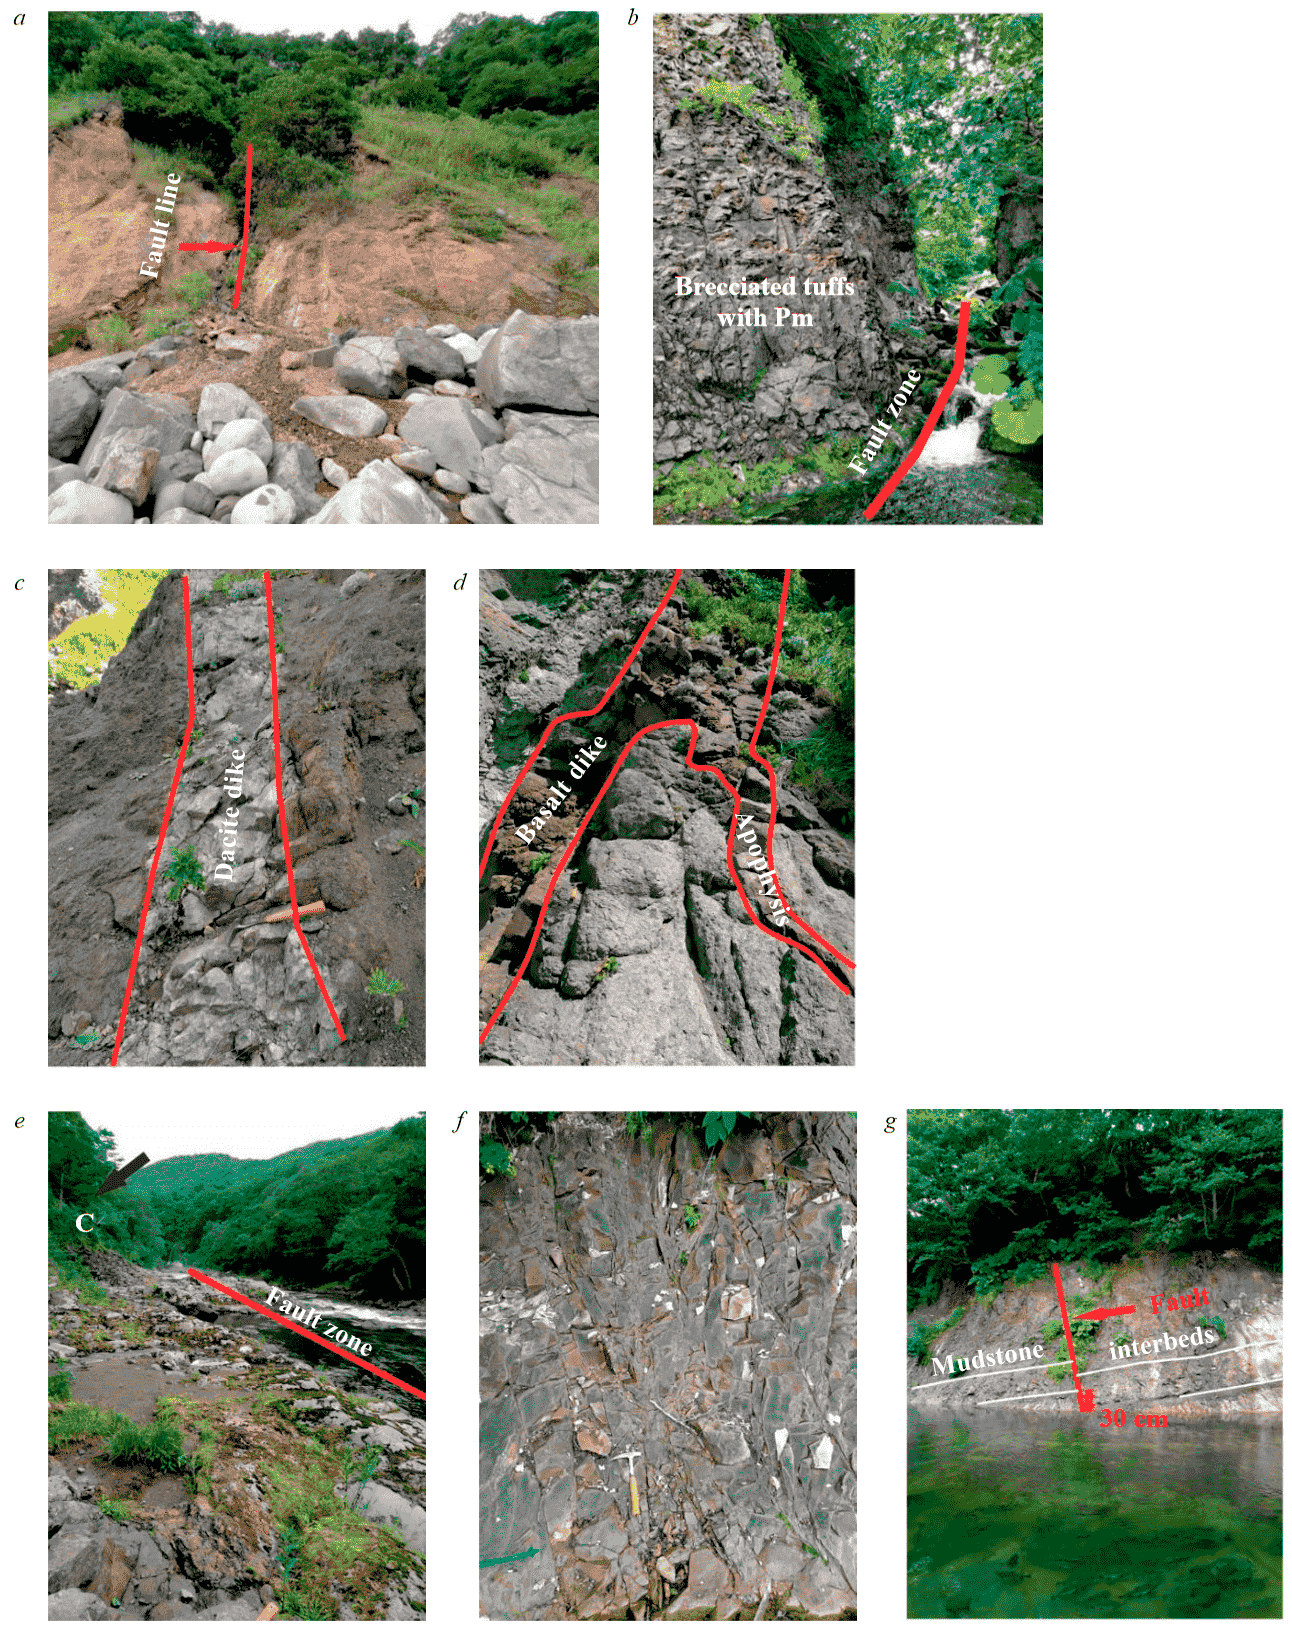
Fig.6. Tectonic faults in Iturup Island observed during field work a, b – northwestern cape of Olya Bay; c, d – Sea of Okhotsk coast, nameless cape 1.5 km south of Cape Isoparauri; e – middle course; f, g – right side of the Kuibyshevka River mouth
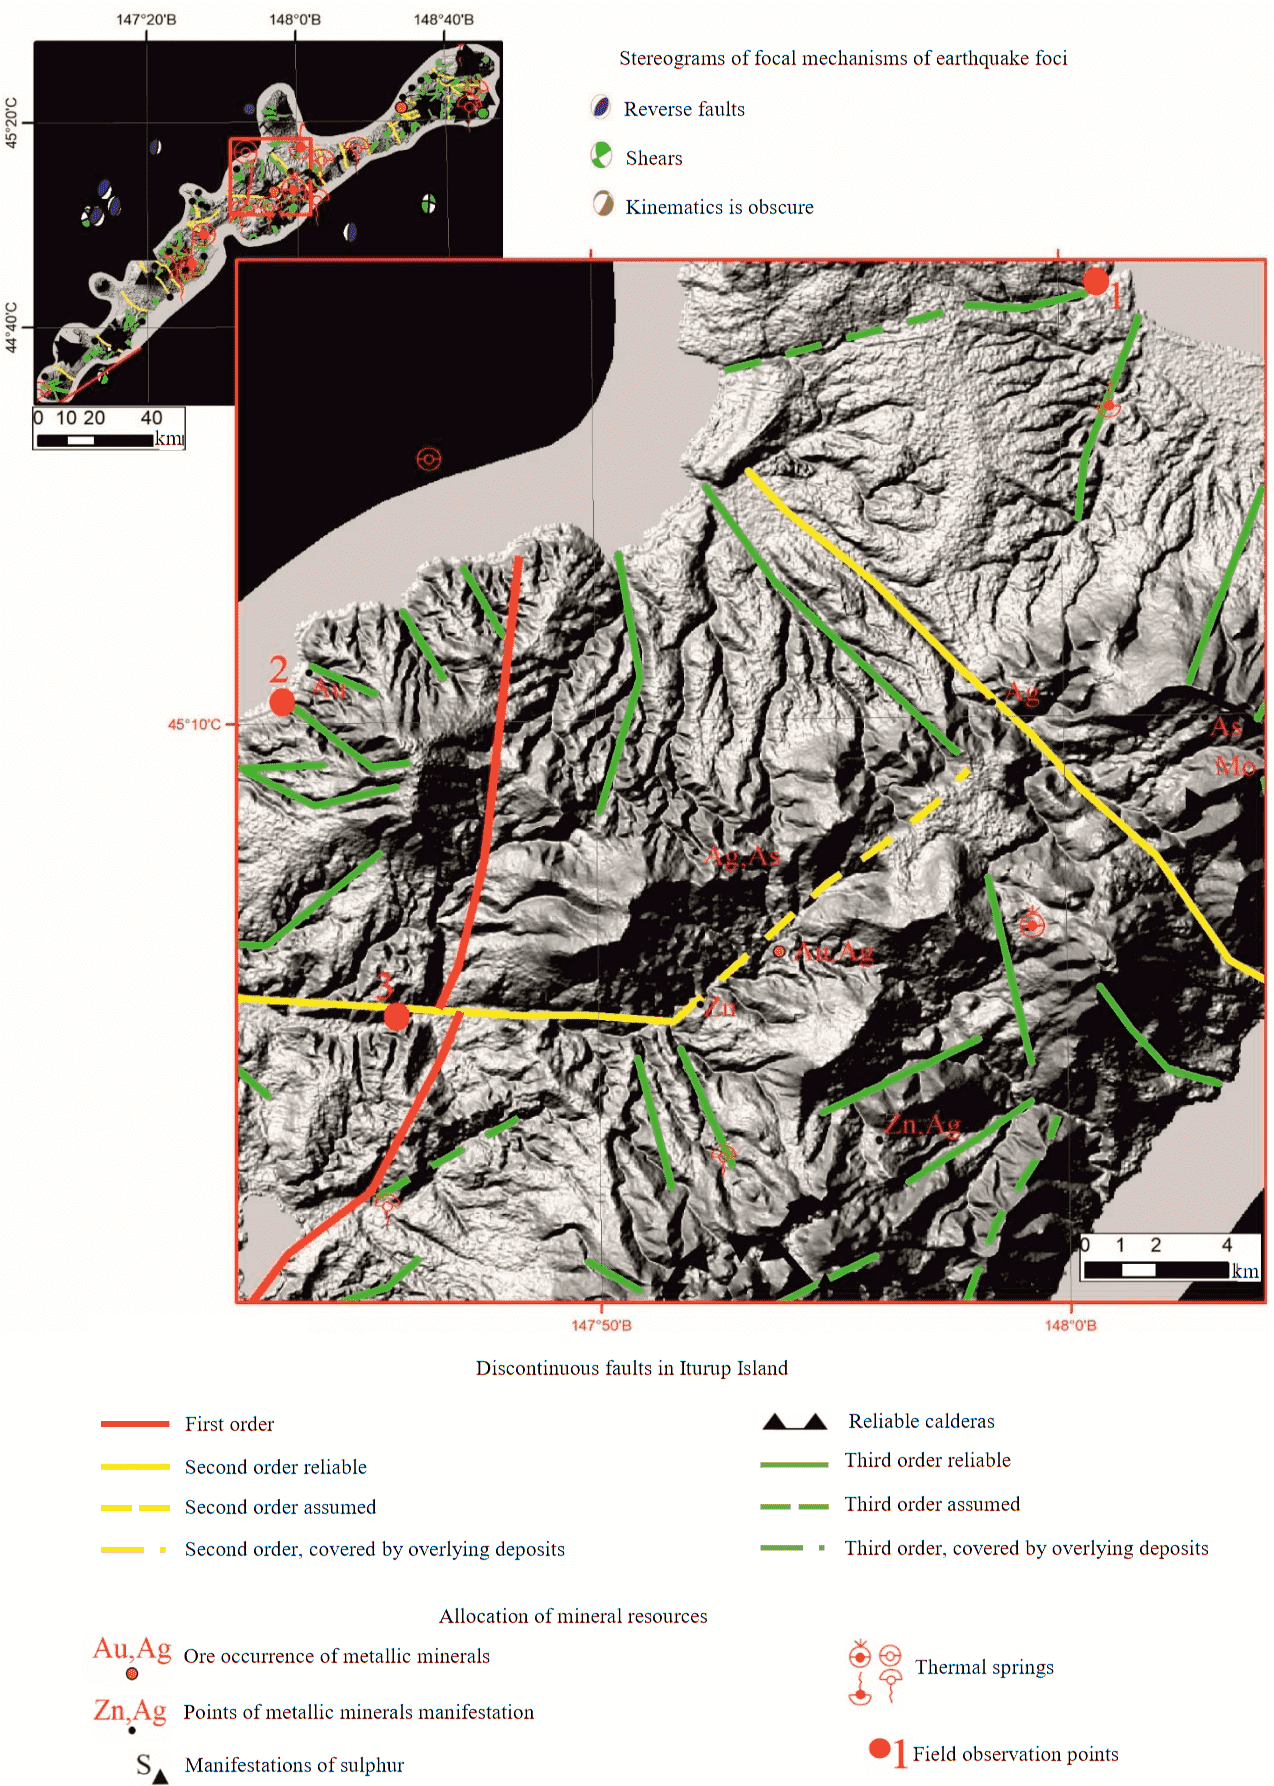
Fig.7. Diagram of tectonic faults in Iturup Island with mineral deposits, with the exception of construction materials and titanium-magnetite placers (1:2,500,000, inset scale 1:200,000)
The analysis of focal mechanisms of earthquake foci distribution shows that, along with numerous shifts with reverse kinematics, structures with complex morphology strike-slip- and reverse faults are present (see Fig.7). The kinematic parameters of seismic movements confirm the general compression environment in the region. In particular, this is well manifested in the hypocentres of earthquakes in the Kuril Basin. Unfortunately, a relatively small number of foci accounts for the island land. Nevertheless, using the map of the horizontal component of the magnetic field gradient, we determined the kinematics and proved the modern activity of the largest longitudinal structures in the coastal water area. The scale, occurrence elements, and morphology of these tectonic displacements suggest that they were formed simultaneously in the same tectonic regime. The presence of displacements of this group within the island land and the nature of the mutual arrangement relative to the displacements of other groups allow us to speak of their earlier formation.
To build a diagram of tectonic faults in Iturup Island (Fig.7), we compared the lineament network diagram (see Fig.3) with the interpreted maps of geophysical anomaly fields, the results of our own field observations and those of predecessors, with existing tectonic and geological maps of the region and other sources of geological and geophysical information. As a result, with almost 3000 identified lineaments in various satellite images and about 300 in the maps of magnetic anomaly field transforms, we identified and confirmed the presence of 212 discontinuous faults in the study region. We allocated mineral resources in the diagram using generally accepted symbols in order to assess the ore-controlling role of tectonic faults and the distribution features of various genetic types of raw materials and disjunctive structures.
We identified three groups of tectonic faults during constructions based on the strike, time of occurrence, and scale of structures. Since the construction scale is 1:1,000,000, the diagrams do not show numerous faults less than 1 km long.
Faults of the first order are the deepest and most extended displacements in the study region. This group incorporates two discontinuous faults: in the central part of the island (Rubchikovsky Fault [20]) and in the coastal area (probably a fragment of a large fault that limits the Greater Kuril Ridge from the Middle Kuril Trench). These structures are covered by overlying deposits, so they are weakly registered in the SI, but are reliably distinguished in the geophysical anomaly field maps. Based on the northeastern (longitudinal) strike and the earliest occurrence, their development can probably be associated with the Kuril Basin formation in the Early Miocene during rifting [18]. However, the distribution of modern seismic shifts shows compression within the backarc basin (Fig.7), which may be due to the complex nature of the Pacific Plate subduction, probably with slip elements. In the islands of Kunashir and Urup, within the South Kuril segment of the island arc, plutonic massifs of the Prasolovsky plagiogranite-diorite complex are recorded. A number of authors [5, 6] suggest the key role of longitudinal faults in the distribution of intrusive bodies in the Kuril Islands. According to the recent estimates [35, 36], the age of the Prasolovsky complex rocks, sampled in the northern part of the Kunashir Island, is ~31 Ma (Early Oligocene). Thus, for longitudinal faults, it is fair to assume that they occur at the Paleogene/Neogene boundary. Faults of the first order are characterized by a complex normal fault, less often strike-slip (southern part of Iturup Island) kinematics, which is determined by the focal mechanisms of earthquake foci and the morphology of the longitudinal Central Kunashir fault, similar to them, located on the neighbouring Kunashir Island [20]. Despite the fact that the Rubchikovsky fault was identified earlier, the present study revealed its relationship with the Kuibyshevsky fault, a second-order structure.
Second-order faults incorporate structures more than 5-6 km long. They are often complicated by third-order discontinuous faults. These structures are pronounced in the SI, less often in other materials, while to some extent confirmed by the SI (the presence of lineaments of the first rank or the linear distribution of lineaments of higher ranks) and/or field observations (zones of brecciation, increased fracturing, cataclasis, hydrothermally altered rocks, reliably traced in the topography by assessing morphotectonic features, deep U-shaped river valleys, etc.). They coincide with positive anomalies in the map of the horizontal component of the magnetic field gradient. In the geological basis, such discontinuous faults are accompanied by subvolcanic bodies of Pliocene age, which allows us to assume their rather deep occurrence and Neogene age. Such deep long-lived faults are supply channels for metal-bearing solutions that form ore mineralization. For example, the Perevalnoye gold-silver occurrence in the central part of the inset (Fig.7) is associated with quartzite bodies, which are stockworks that arose at the intersection of faults of northeast and near-meridional strike (according to unpublished materials by P.Yu.Kovtunovich). We can reliably state that the discontinuous faults of this group are younger than the first-order faults, since they displace them in some areas (for example, the Kuibyshevsky fault in the central part of Iturup). Second-order faults in the study region are predominantly transverse, i.e., NW trending. They are characterized by normal fault, strike-slip, less often reverse fault kinematics (see Fig.2) and determine the island topography (divide the island into a system of uplifts and troughs) [20]. Most of them are active even now, which is confirmed by the distribution of sources of shallow earthquakes, outflows of thermal springs, and their characteristic manifestation in the topography. During their study, the authors clarified the position of some structures (Tebenkovsky, Reidovsky, Dobryninsky faults, etc.) in the constructed diagram. The presence of several faults identified earlier was not confirmed. In addition, fault tectonics of the least studied and hardly accessible the Medvezhy Peninsula was clarified. We assume the presence of a number of transverse structures in the Bogatyr Ridge and Dobry Isthmus area.
Third-order faults are structures rarely more than 5 km long. Among the identified groups, these structures are the youngest and least deep. They correspond to lineaments of the second rank or linea-rly distributed lineaments of the third rank, often act as feather faults of the second order. They are weakly expressed in the geophysical field maps. Nevertheless, they are reliably registered during field work, but differ from the main ones in a smaller thickness of the zones of fragmentation and alteration of rocks. They are concentrated in areas with volcanic activity, therefore, despite their size, they are expressed in the topography along the hydro network, ledges, and other landforms (for example, in the vicinity of the Bogatyr Ridge on the Sea of Okhotsk coast, they are noted by numerous waterfalls in the rocky coast). They have complex kinematics and irregular strike. Characteristic geomorphological features confirm their modern activity. Moreover, third-order faults are supply channels for the circulation of solutions, the discharge of which occurs in the form of thermal springs and steam hydrotherms. For example, the Okeanskoye field in the eastern part of the inset (Fig.7), with outcrops of sulphurous steam-gas jets and thermal springs in small thermal fumarole fields. Their activity is associated with the deposition of native sulphur (according to unpublished materials by P.Yu.Kovtunovich). There is a hypothesis [6] that displacements developed on the slopes and at the foot of volcanic ridges indicate the presence of deep faults that can serve as supply channels for magmatic melt, which provides linear nested volcanism within the Kuril Islands. However, the results of the constructions do not allow either confirming or refuting this theory. Despite the fact that these discontinuous faults are the most numerous group in the island, most of them were not shown in previously published maps. Nevertheless, according to the analysis of primary materials, more than half of the structures in this group are attributed to the latest edition of the State Geological Map at 1:200,000 scale. This can be associated with the fact that third-order faults are easily registered during field work, since they are the youngest and are confined to modern volcanic and tectonic activity. Moreover, large-scale exploration and prospecting work was carried out in the central part of the island in the XX century. These reports noted some of the structures in this group.
In addition, circular structures are registered in the island. They are represented by the Quaternary and Late Neogene (Tsirk caldera on the Medvezhy Peninsula) calderas associated with explosive volcanism.
Conclusions
To study the geotectonic structure of Iturup Island we applied an integrated approach based on the interpretation of remote sensing materials and geophysical anomaly field maps. The presented approach using customized software products significantly speeds up the interpretation process for identifying the tectonic structural elements, while the results obtained do not contradict, but complement the existing ideas about the geological structure of the area; i.e., the use of innovative approaches is a necessary factor for the development of the raw material base in the region [23]. However, the tectonic nature of the revealed structures can be confirmed, and the data obtained can be used to study the deep structure of the area only with a comprehensive geological and geophysical analysis of the interpretation results, while involving more sources of geological and geophysical information increases the reliability of the final results. It is difficult to apply this technique to establish the parameters of identified faults, especially in poorly exposed areas, which can be overcome by using the results of more detailed geological and geophysical investigations.
The constructed discontinuous faults diagram makes it possible to clarify the geotectonic features of Iturup Island structure, as it shows discontinuous faults that have not been previously recorded. For previously noted faults, we clarified the position and association with the geological history of the region. We confirmed the ore-controlling role of the identified structures in the study region. Deep long-lived faults are supply channels for metal-bearing solutions, the discharge of which occurs in the form of thermal springs and steam hydrotherms, carrying the mineralization of non-ferrous, rare, and noble metals. The outflows of thermal waters are associated with fracturing and discontinuous faults zones in volcanic rocks. Depending on the time of occurrence and scale, we identified three groups of faults in the study region. The largest and deepest structures of the first order probably formed at the beginning of the Neogene (end of the Paleogene?), at the earliest stages of development of the study region. The formation of second-order discontinuous faults occurred in the Neogene; they form the island topography and break it into a system of troughs (Vetrovoy block, Roka block) and uplifts (Sibetorsky, Kuibyshevsky blocks) [20]. The faults of the third order, first of all, are confined to the centres of modern volcanism development (Bogatyr, Grozny, etc. ridges).
Lineament analysis of the SI revealed the dominant east-northeast strike of the fracture zones (see Fig.3). The predominance of such a strike can be explained by the model of the formation of weakened zones oriented perpendicular to the compression axis. Compression settings in the north-north-west direction was confirmed by the distribution of modern tectonic movements.
The diagram of distribution zones of local tectonic fracturing in the upper part of the Earth's crust (see Fig.5) shows that modern volcanic structures are characterized by the highest values. The areas of mineral concentration are also associated with these regions. This is due to the fact that tectonic fracturing can extend to great depths, forming paths for ascending flows of magmatic melts and deep circulating solutions to the Earth's surface. Thus, similar diagrams can be used as an alternative method for forecasting minerals in the Kuril Islands in hardly accessible regions.
References
- Geological Map of the USSR, scale 1:200,000 (Kuril series). Sheets L-55-XXII, XXIII. Explanatory note. Moscow: Soyuzgeolfond, 1980, p. 96 (in Russian).
- State Geological Map of the Russian Federation. Scale 1:1,000,000 (new series): Sheet L-(54), (55); K-(55) – Yuzhno-Sakhalinsk. Explanatory note. Saint Petersburg: Roskomnedra, VSEGEI, 1995, p. 146 (in Russian).
- State Geological Map of the USSR, scale 1:1,000,000. Sheet K-55, L-55 (Southern group of the Kuril Islands). Moscow: Gosudarstvennoe nauchno-tekhnicheskoe izd-vo literatury po geologii i okhrane nedr, 1956, p. 29 (in Russian).
- Geological and geophysical atlas of the Kuril-Kamchatka island system. Ed. by K.F.Sergeev, M.L.Krasny. Leningrad: VSEGEI, 1987, p. 36 (in Russian).
- Sergeev K.F. Tectonics of the Kuril Island System. Moscow: Nauka, 1976, p. 240 (in Russian).
- Streltsov M.I. Dislocations in the southern part of the Kuril island arc. Moscow: Nauka, 1976, p. 132 (in Russian).
- Avdeiko G.P., Popruzhenko S.V., Palueva A.A. Tectonic development and volcano tectonic zoning of the Kuril-Kamchatka island arc system. Geotektonika. 2002. N 4, p. 64-80 (in Russian).
- Zlobin T.K., Polets A.Yu. Properties of spatial and temporal distribution of the focuses of strong earthquakes and types of seismic dislocations before the catastrophic Simushir earthquakes of 2006-2007. Doklady Earth Sciences. 2013. Vol. 450. N 4, p. 460-464 (in Russian). DOI: 10.7868/S0869565213160238
- Zlobin T.K., Polets A.Yu., Poplavskaya L.N., Safonov D.A. Features of modern deep seismotectonics of the lithosphere of the southern Kuril Islands (area of Iturup Island) on the basis of earthquakes focal mechanisms. Vestnik of Far Eastern Branch of Russian Academy of Sciences. 2011. N 3, p. 35-40 (in Russian).
- Nakamura K. Volcanoes as possible indicators of tectonic stress orientation principle and proposal. Journal of Volcanology and Geothermal Research. 1977. Vol. 2, p. 1-16. DOI: 10.1016/0377-0273(77)90012-9
- Trifonov V.G. Neotectonics of Mobile Belts. Moscow: GEOS, 2017, p. 180 (in Russian).
- Bolshakova N.V., Fedorova K.S. The possibilities of using a qualitative interpretation of the potential fields for creating a zonal-block model of the northern flank of the Okhotsk sea region. 17th Conference and Exhibition Engineering and Mining Geophysics, April 2021. Vol. 2021, p. 1-7. DOI: 10.3997/2214-4609.202152157
- Ageev A.S., Ilalova R.K., Talovina I.V., Duryagina A.M. A link between spatial distribution of the active tectonic dislocation and groundwater water resources in the Baikal-Stanovaya shear zone. Mining Informational and Analytical Bulletin. 2019. N 5, p. 173-180 (in Russian). DOI: 10.25018/0236-1493-2019-05-0-173-180
- Zlobin T.K., Polets A.Yu. Catastrophic Simushir earthquakes of November 15, 2006 (Mw = 8.3) and of January 13, 2007 (Mw = 8.1), and deep structure of the Middle Kurils Earth’s crust. Russian Journal of Pacific Geology. 2009. Vol. 28. N 5, p. 54-63 (in Russian).
- Kalinin, D.F., Egorov A.S., Bolshakova N.V. Oil And Gas Potential of the West Kamchatka Coast and its Relation to the Structural and Tectonic Structure of the Sea of Okhotsk Region Based on Geophysical Data. Vestnik Kamchatskoy regionalnoy organizatsii “Uchebno-nauchnyy tsentr”. Seriya: “Nauki o Zemle”. 2022. N 1. Iss. 53, p. 59-75 (in Russian). DOI: 10.31431/1816-5524-2022-1-53-59-75
- Avdeiko G.P., Areshev E.G., Bogdanov N.A. et al. Tectonic map of Sea of Okhotsk Region. Moscow: Institute of the Lithosphere of Marginal Seas, Russian Academy of Sciences, 2000 (in Russian).
- Grave de J., Zhimulev F.I., Glorie S. et al. Late Palaeogene emplacement and late Neogene-Quaternary exhumation of the Kuril island-arc root (Kunashir island) constrained by multi-method thermochronometry. Geoscience Frontiers. 2015. Vol. 7. Iss. 2, p. 211-220. DOI: 10.1016/j.gsf.2015.05.002
- Schellart W.P., Jessell M.W., Lister G.S. Asymmetric deformation in the backarc region of the Kuril arc, northwest Pacific: new insights from analogue modeling. Tectonics. 2003. Vol. 22. Iss. 5, p. 1-18. 1047. DOI: 10.1029/2002TC001473
- Martynov Yu.A., Khanchuk A.I., Kimura J.-I. et al. Geochemistry and petrogenesis of volcanic rocks in the Kuril Island Arc. Petrology. 2010. Vol. 18, p. 489-513. DOI: 10.1134/S0869591110050048
- State Geological Map of the Russian Federation, scale 1:200,000; Second edition. Kuril series. Sheets L-55-XXII, XXVIII, XXXIV (Kurilsk), L-55-XXIII, XXIX (Reidovo), L-55-XXXIII (Tyatya volcano), K-55-II, 55-XXXII (Yuzhno-Kurilsk). Saint Peterburg: Izd-vo Sankt-Peterburgskoi kartograficheskoi fabriki VSEGEI, 2002, p. 298 (in Russian).
- Piskunov B.N. The nature of basaltoides External and Internal Kuril Ridges. Lithosphere. 2004. N 3, p. 97-109 (in Russian).
- Kuzmin Yu.O., Nikonov A.I., Shapovalova E.S. Peculiarities of decoding lineament systems taking with considering the recent geodynamics of faults. Georesources, geoenergetics, geopolitics. 2016. N 13, p. 1-21. DOI: 10.29222/ipng.2078-5712.2016-13.art13
- Hobbs W.H. Lineaments of the Atlantic border region. Geological Society of America Bulletin. 1904. Vol. 15. N 1, p. 483-506. DOI: 10.1130/GSAB-15-483
- Kats Ya.G., Poletaev A.I., Rumyantseva E.F. Fundamentals of lineament tectonics. Moscow: Nedra, 1986, p. 140 (in Russian).
- Koronovskii N.V., Bryantseva G.V., Goncharov M.A. et al. Lineaments, planetary jointing, and the regmatic system: main points of the phenomena and terminology. Geotectonics. 2014. N 2, p. 75-88 (in Russian). DOI: 10.7868/S0016853X14020052
- Egorov A.S. Deep structure and geodynamics of the lithosphere in Northern Eurasia: after geological and geophysical modeling along the geotraverses in Russia: Avtoref. dis. ... d-ra geol.-mineral. nauk. St. Petersburg: Sankt-Peterburgskii gornyi universitet, 2000, p. 51 (in Russian).
- Taskin V.V. Short overview of foreign experience of lineament analysis exploitation in a sphere of geology. Mining informational and analytical bulletin. 2017. Vol. S 32. N 12, p. 138-144 (in Russian).
- Khubaeva O.R., Bergal-Kuvikas O.V., Sidorov M.D. Identification of ruptures and their interaction with hydrothermal-magmatic systems on Northern Paramushir Isl. (Kuril Islands, Russia): 3d modeling of tectonic fragmentation. Geotectonics. 2020. N 6, p. 77-90 (in Russian). DOI: 10.31857/S0016853X20060077
- Adiri Z., El Harti A., Jellouli A. et al. Comparison of Landsat-8, ASTER and Sentinel 1 satellite remote sensing data in automatic lineaments extraction: A case study of Sidi Flah-Bouskour inlier, Moroccan Anti Atlas. Advances in Space Research. 2017. Vol. 60. Iss. 11, p. 2355-2367. DOI: 10.1016/j.asr.2017.09.006
- Aminov Javhar, Xi Chen, Anming Bao et al. Comparison of Multi-Resolution Optical Landsat-8, Sentinel-2 and Radar Sentinel-1 Data for Automatic Lineament Extraction: A Case Study of Alichur Area, SE Pamir. Remote Sensing. 2019. Vol. 11 (778), p. 29. DOI: 10.3390/rs11070778
- Senchina N.P., Ermolin E., Ingerov O. Integration of ground audio-magnetotelluric (AMT) and airborne magnetic surveys for exploration of gold-bearing quartz veins. Conference Proceedings, 3rd EAGE International GeoBaikal Conference 2014 – Exploration and Field Development in East Siberia, August 2014. Vol. 2014, p. 1-5. DOI: 10.3997/2214-4609.20141753
- Egorov A.S., Vinokurov I.Yu., Telegin A.N. Scientific and Methodical Approaches to Increase Prospecting Efficiency of the Russian Arctic Shelf State Geological Mapping. Journal of Mining Institute. 2018. Vol. 233, p. 447-458. DOI: 10.31897/PMI.2018.5.447
- Avdeiko G.P., Palueva A.A., Khleborodova O.A. Geodynamic conditions of volcanism and magma formation in the Kuril-Kamchatka Island-Arc System. Petrology. 2006. Vol. 14. N 3, p. 230-246 (in Russian).
- Prytkov A.S., Vasilenko N.F., Frolov D.I. Recent geodynamics of the Kuril Subduction Zone. Russian Journal of Pacific Geology. 2017. Vol. 11. N 1, p. 19-24 (in Russian).
- Litvinenko V.S., Sergeev I.B. Innovations as a Factor in the Development of the Natural Resources Sector. Studies on Russian Economic Development. 2019. Vol. 30, p. 637-645. DOI: 10.1134 / S107570071906011X
- Piip V.B., Rodnikov A.G. The Sea of Okhotsk crust from deep seismic sounding data. Russian Journal of Earth Sciences. 2004. Vol. 6. N 1, p. 1-14.