
Identification of structural control factors of primary gold ore occurrences by method of unmanned aeromagnetic survey by the example of the Neryungrisky district of Yakutia
- 1 — Ph.D. Associate Professor Saint Petersburg Mining University ▪ Orcid
- 2 — Postgraduate Student Saint Petersburg Mining University ▪ Orcid
- 3 — Ph.D. Associate Professor Saint Petersburg Mining University ▪ Orcid

Abstract
The long-term development of the geophysical industry, in which the methods of magnetometry are in maximum demand, as the simplest in instrumental and methodological execution, has determined the development of remote measurement methods implemented both from space and airborne carriers. The necessity to use the latter as an obligatory component of field surveys, providing coverage of significant areas, determines the need for using the unmanned low-tonnage carriers. Their use is implemented to search for predictive elements of structural (spatial, genetic) control of endogenous gold ore occurrences that allow predictive constructions, i.e., solving the problem of increasing gold reserves, which is being performed within the framework of federal programs. The purpose of the survey is to develop a system of instrumental and subsequent interpretation approaches in the organization of unmanned magnetometer survey, implemented for structural and geological mapping by the example of the Neryungrinsky district of Yakutia. Within the framework of the digital model formation of the relief and the anomalous magnetic field, a survey method using an unmanned aircraft, its technical characteristics are considered; the analysis and the author's modification of the office analysis of magnetometry data are performed. Based on the obtained materials, a physical and geological model of the investigated area was created, which is presented in the form of a geological and structural cut, accompanied by the physical characteristics of the structural and material complexes. The refinement of the physical and geological model was implemented by a joint morphostructural analysis of the remote base and the anomalous magnetic field using the results of quantative interpretation of the anomalous magnetic field. The result of the study is presented by an updated geological basis with the allocation of promising ore sites for their detailing as part of the planned large-scale geological and geophysical surveys. The scientific novelty of the work consists in the synthesis of the tried and tested methods of unmanned aeromagnetometric measurements and geostructural reconstructions, which allow the processing of both potential and non-potential geofields.
None
Introduction
The topic of the work is related to two relevant aspects: mapping elements of structural control of endogenous gold ore occurrences and the use of unmanned aircraft. One of the promising areas of Yakutia is considered as a geological polygon. Gold mining in this region has been conducted for a little less than a century when assessing resources (Central-Aldanskyi ore district, Southern Yakutia – 1000 tons of gold) [1]. Gold deposits in the regions of Southern Yakutia are considered, characterized over a large area by the extensive development of Mesozoic magmatism, the intrusive products of which permeate the carbonate strata of overlapping sediments. The selected geological polygon is located within the Timptono-Berkakitskaya area (the basins of the Iengra, Berkakit, Timpton, and Chulman rivers). The Kuranakh, Lebedinoye and Ryabinovoye deposits, located to the north (at a distance of about 170-180 km) from the center of the polygon, are the closest to the geological polygon explored endogenous (indigenous) gold deposits with industrial reserves.
The Kuranakh deposit is formed by oxidized gold-bearing ores with an initially high content of sulfides, characterized by the complex nature of mineralization (polymetals, tungsten and silver). In its primary occurrence, the gold of the Kuranakh ore field is classified as hydrothermal-type formations, where ores of two generations are isolated: microscopic inclusions associated with pyrite; millimeter inclusions of various morphologies associated with quartz and pyrite. The Ryabinovoye deposit is a rock mass of gold-sulfide ores interspersed in alkaline Mesozoic complexes. The Lebedinoye deposit is formed by deposits of partially oxidized gold-sulfide ores associated with quartz veins penetrating carbonate rocks. All three deposits belong [2] to different geological and industrial types: mineralized deposits of gold-pyrite-adulyar-quartz ores (Kuranah); quartz-gold-sulfide ore accumulations and veins (Lebedinoye); gold-porphyry copper ores of veined-interspersed morphology (Ryabinovoye). If the first two types tend to carbonate rocks and their contacts with intrusive complexes, then the third type is formed directly in intrusive complexes.
Within the selected geological polygon, where during the submeridional movement there is a sharp change in the geological situation (from the monocline occurrence of sedimentary and volcanogenic sedimentary strata of Jurassic age in the north through a marked contact zone to steeply falling Archean complexes represented by alternating products of acid and alkaline magmatism in the central and southern parts of the polygon), mineralization, gravitating to the contact zone of magmatogenic and sedimentary complexes and ancient crystalline formations. The selected geological polygon is located almost in the middle between two ore-placer areas [3]: Evotinsky – north of the polygon (includes the deposits discussed above), Guvilgrinsky – in the south and southeast relative to the polygon. The published geological basis [3] demonstrates a deterministic structural picture in the vicinity of the geological polygon: it tends to the area of intersection of the submeridional disjunctive zone connecting both of these ore-placer areas, and the disjunctive strip zone of the north-western strike, crossing the Talanginsky ore-placer area in addition to the Guvilgrinsky district. According to [4], this intersection area is defined as a discordant structure, and the marked disjunctive zones are considered as channels of migration of ore-saturated solutions and melts, which hypothetically is capable of forming an industrially significant gold ore rock mass within the selected geological polygon.
Methodology
The area of the selected polygon is more than 40 km2, which makes it problematic to make representative estimates based only on ground surveys. At the same time, there is a poor condition of the specialized (geological and geophysical) aeropark: in the conditions of a massive influx of imported measuring equipment to the domestic market, the Russian geological industry has retained single aeronautical brigades, including the operating divisions of NPP Aerogeophysics JSC (Moscow), flight brigades of VSEGEI branches (St. Petersburg), CJSC Aerogeophysical Exploration (Novosibirsk). Such a shortage of equipment during aerogeophysical survey inevitably leads to an increase in its cost and, consequently, a decrease in the profitability of surveys [5]. Therefore, the use of low-tonnage and small-sized drones with a geophysical payload has been announced. The possibility of their use made it possible to cooperate with the company Geoscan LLC, which has its own production of air carriers and many years of experience in their use in various tasks [6, 7]. Despite the popularization of the use of drones [8-14], in particular in geology and geophysics, attention should be paid to such features as the susceptibility of the device to the influence of atmospheric flows, a small payload, which inevitably determines the reduction in the size of the sensor, i.e. its resolution. These features are not the only ones and represent a source of improvement in the methodology of using unmanned specialized (here – magnetometric in combination with geomorphological) surveys. Therefore, the purpose of the research is to analyze and select options for modifying the methodology of complex geomorphological and aeromagnetic survey exploration, including the development of an interpretation system that provides a joint analysis of heterogeneous geofields (here, the optical density fields of the remote image and the anomalous magnetic field (AMF) in relation to the task of predicting the occurrence of endogenous mineralization.
Technical basics of aeromagnetic survey from an unmanned aerial vehicle (UAV)
Aeromagnetic survey using UAV is performed using the Geoscan 401 Geophysics complex, which includes a multirotor quadrocopter and a quantum rubidium magnetometer Geoscan GeoShark. The magnetometer is mounted on the UAV using a nylon cord 20 m long. The equipment was manufactured by Geoscan LLC [15, 16]. The main technical characteristics of the Geoscan 401 quadcopter are: flight duration – up to 60 min; flight duration – up to 22 km; horizontal and vertical speeds – up to 50 and 5 km/h, respectively; altitude – 500 m; maximum wind speed – up to 10-12 m/s; payload weight – 2 kg; operating temperatures – from –20 to +40 °С. Characteristics of the GeoShark magnetometer: sensitivity – 1pT/√Hz; field measurement range – 20000-100000 nT; total deviation error – < 0.3 nT; measurement frequency – 1000 Hz; range of permissible sensor angles – ±45 °C; operating temperature range – from –20 to +40 °C; mass of the sensor/electronic unit – 120/300 g.
The methodological feature of unmanned aeromagnetic survey is low altitude, due to the desire to minimize the removal of the sensor from the rock mass and to reduce the impact of atmospheric flows on a low-tonnage drone [17, 18]. A necessary element of this type of aerial survey is the preliminary mapping of local landforms and associated forests and engineering structures to ensure trouble-free flight of a magnetometric drone. Advanced survey of local forms of the landscape (geomorphological survey) is carried out at higher altitudes (up to 2 km) than with the magnetic prospecting from the board of a flying wing type drone based on radar or laser scanning combined with photographing (implemented by means of a spectrosonal digital camera). The standard camera processing of the results of the advance survey is reduced to the formation of a geographically linked digital model of the relative exceedances of the earth's surface (the excess matrix is loaded into the memory of a magnetometric drone). In the case of surveys carried out within the framework of the subject under consideration, this technique, repeatedly worked out by expedition groups, is supplemented by the author's block for optimizing the strike of measuring routes. There is a well-known need to orient these routes across the dominant strike of geostructural elements, which include stratigraphic and tectonic contacts of structural-material complexes appeared in the modern landscape. Thus, the cameral analysis of the results of the advanced geomorphological survey includes an automated parametric analysis of lineament structures restored on the basis of a digital relief model (DRM) combined with a photographic image of the landscape and the use of the author's decryption algorithm. At this stage of surveys, the geostructural image of the landscape obtained after lineament decoding turns out to be less significant than the integral rose of the dominant strikes of geostructural elements (in this case, the northeastern dominant strikes). When carrying out measuring (magnetometric) work on the system of routes of the north-western strike, a magnetovariation station based on a quantum magnetometer is necessarily installed to register daily variations of the Earth's geomagnetic field and their subsequent accounting in processing.
Aeromagnetic surveys from UAV and cameral processing during additional exploration of hardrock gold occurrences
Clarifying the above geological survey, it is necessary to note the position of the work area: Neryungrinskiy district of the Republic of Sakha (Yakutia), Timptonskiy gold mining district (within the sheet O-51-XXX). The contours of this sheet belong to the south of the Aldan Mountans, to the area of the Timpton River basin (the right tributary of the Aldan River) in its middle course. The geological structure of the considered part of this region involves complexly dislocated and deeply metamorphosed layered-crystalline formations of Archean age, marine carbonate rocks of the Lower Cambrian, continental Jurassic sediments and loose Quaternary sediments of various genesis. Intrusive formations are observed only within the area of distribution of Precambrian crystalline rocks, whereas there are no occurrences of intrusive activity in the areas occupied by Lower Cambrian and Jurassic formations. According to the time of introduction, the intrusive rocks of the territory are divided into Archean and Lower Proterozoic. Ore gold, associated mainly with sulfides, was mainly formed within the studied polygon, as well as within the entire Aldano-Stanovyi shield, at the stage of Mesozoic tectonic-magmatic activation [3]. In relation to the selected geological polygon, these ores are syngenetic to extended disjunctive structures having deep laying and ore-controlling significance. The gold-ore occurrences of the Upper Timpton region tend to be granitoid stocks and dikes marking these discontinuous structures of regional occurrence.
Work within the indicated geological polygon was carried out in October-November 2019. The total area of work (after advanced optimization estimates) was 30 km2, the length of the control lines was 327.8 km, the traverse routes were 9.2 km. The survey was carried out with the location of the magnetometer at an altitude of 40 m above the relief level, the quadcopter – 60 m. The distance between the profiles is 100 m.
After the fieldwork, all the materials were checked for correctness and sent for office processing. The main purpose of office processing of aeromagnetic survey data is to obtain a digital AMF model on the survey area and estimate the error of the obtained geomagnetic field measurement results [19-22].
To solve the tasks, it is necessary to perform several types of work sequentially, regardless of the type of media used when surveying:
- create databases of aeromagnetic surveys in the format of a data processing package;
- enter corrections for daily variations of the Earth's geomagnetic field;
- calculate AMF ∆Та (correction for the normal field of the Earth);
- mutually link the traverse and control lines;
- to estimate the standard error of the survey by repeated measurements;
- take into account the influence of local landforms on the structure of the final digital AMF model.
While the first five points relate to proven operations that give a relatively clear result, taking into account the relationship of the magnetic field and local landforms of the Earth's surface tends to the category of scientific tasks. The flight of a drone with the circumference of local landforms can be considered by analogy with the ground movement of the operator: correctly represent the measurement surface as a conditional plane; solve the inverse problem with respect to this plane [23]; when visualizing its results, make a geometric correction by linking the calculated elements of occurrence to local anomalies of the forms of the earth's relief. However, there are a number of problems that this approach does not solve. The first of the problems is to determine the ratio of lineament structures mapped by a remote image of the landscape with geostructural reconstructions (analogous to lineaments) by AMF. The goal here is to find out which of the lineaments reflect the deep (endogenous) component of the landscape, and which are associated with near-surface processes. In this case, it is relevant to reduce the correlation between AMF and the field of relative excesses. Another problem is the functional relationship between the amplitude and morphological features of magnetic anomalies and the characteristics of the Earth's relief, which has been revealed at the empirical level. This functional relationship has been discussed in scientific publications since the mid-20th century (B.D.Microv, 1963) [24, 25].
Summarizing, two approaches to the introduction of relief corrections in AMF, analytical and statistical, can be distinguished. There are two key disadvantages in the analytical approach (for these surveys): the need to solve a direct problem, which excludes automation in the technology of calculating the correction for relief; the dependence of the accuracy of the correction on the level of physical and geological information about near-surface strata. The statistical approach is dominated by primitivism: the construction of an approximation dependence of the AMF values on the relative exceedances (absolute altitudes) of the relief of the Earth's surface, followed by the recalculation of these exceedances into the AMF component correlated with them. As the studies of A.S.Dolgal [26, 27] have shown, this approach is characterized by relative severity only within the framework of the linear statistics model, whereas interval estimates demonstrate pronounced nonlinearity of the marked approximation. Due to this contradiction, an alternative method of taking into account the relief is proposed, based on the calculation of the coherence function:
where ω – the spatial frequency, SΔT, Rl – the cross–spectrum calculated based on the direct Fourier transform of the cross-correlation function between AMF and DRM; SΔT, SRl – the energy spectra of AMF and DRM, respectively.
Taking a pronounced positive and negative correlation between AMF and DRM as a parameter of the functional relationship between them, it is possible to form a filter based on the coherence function to calculate the AMF component correlated with DRM. The bandwidth of such a filter will meet the condition 0.5≤Ψ2≤1 that, according to the work of R.Otnes (1982), is equivalent to a positive and negative correlation between the multi-frequency components of AMF and DRM exceeding 0.7. The exclusion from the AMF of the component correlated with the Earth's relief demonstrates a pronounced drop in the final coefficient of paired correlation (for experimental polygons – less than 0.3 modulo). As a result of office processing, maps of AMF isolines were reconstructed (with an amendment for local relief forms), AMF graphs and transformants, and an estimate of the standard error of the survey was calculated, which was ±5.52 nTl.
The characteristics of the main transformations of the magnetic field, which constitute the essence of the first stage of the implemented qualitative interpretation procedure, are given in Table 1. As can be seen from Fig.1, which shows the result of some transformants, against the background of the dominant reaches of the northeast azimuth, the transit structure of the north-northwest reach appears, displaying a hypothetical suture zone.
On the basis of the obtained materials, a physical and geological model of the rock mass is constructed (Fig.2). The ideas about the permissible forms and contents of the physical and geological model are recorded both in the classical geophysical literature [15] and in the latest edition of the geological dictionary (VSEGEI, 2012). The physical and geological model has the form of a cut, the features of which are derived from the integration and analysis of various geophysical and geological information, and displays the lithological and physical characteristics of the geological environment, the position of stratigraphic and tectonic contacts.
Increasing the resolution of the method is traditionally implemented by switching to higher-order derivatives.
The data for the construction of a physical and geological model are formed by a medium-scale (1:200000) geological basis (geological map and cut) provided by the online cartographic resource VSEGEI, as well as data from laboratory analysis of sampling and primary quantitative estimates on the AMF map. The structure of the model reflects the area of formation of the suture zone separating the interval of rise of the crystalline base from the zone of the sedimentary substrate development. Tectonically, this suture zone marks the element of the boundary seam of the Predstanovyi foredeep on the southern edge of the Aldan Mountains and plays the role of a mine-controlling factor in relation to one of the reference objects with a gold-sulfide payload. As can be seen from Fig.2, most of the territory of the test site falls on the northern flank of the flexure, composed of metamorphogenic and magmatogenic rocks of Archean age, in the system of which there is a dipping of the stratification surfaces to the northwest at an angle of incidence of about 30°. In the northern part of the polygon, this structural pattern is replaced by a monocline occurrence of sedimentary formations of Jurassic age.
Table 1
Characteristics of the AMF transformations used
|
Transformation |
Mathematical mean |
Assignment |
|
Vertical gradient AMF |
∂Ta/∂z – AMF attenuation rate when recalculated upward |
It works as a high-pass filter. Removes the regional component caused by large deep objects from the field. As a result, magnetic objects located near the surface are highlighted in contrast. The structural features of the field associated with tectonic violations are also clearly visible |
|
Full horizontal gradient AMF |
It is calculated as the square root of the sum of the squares of the derivatives in the x and y directions. Shows the rate of change of the field in the horizontal direction. It is always a positive number. As a rule, it has a large dynamic range and a lognormal distribution, so it is convenient to depict this parameter on a logarithmic scale |
It works as a high-pass filter. Highlights the zones of the greatest change in the field (the inflection point on the graphs), which often correspond to the boundaries of the exit of magnetic bodies to the surface. The stages of the field due to tectonic boundaries are well highlighted |
|
Full gradient AMF or analytical signal AS |
It is calculated as the square root of the sum of the squares of the derivatives in the x, y and z directions. It is always a positive number. The shape of AS anomalies does not depend on the direction of magnetization of bodies. As a rule, it has a large dynamic range and a lognormal distribution, so it is convenient to depict this parameter on a logarithmic scale |
It works as a high-pass filter. Since AS does not depend on the direction of the magnetizing vector, the maximum of AS is always located above the center of the upper edge of the magnetic body. For bodies with a large horizontal extent (subplastic bodies), AS maxima are formed above the boundaries of the bodies |
|
Tilt-transformation |
The arctangent of the ratio of the vertical derivative to the total horizontal gradient. It varies in the range from –900 to 900. The position of the minima and maxima of Tilt fully corresponds to the position of the minima and maxima of AMF |
It works as an automatic increase regulator in the theory of radio signal processing. Removes amplitude characteristics from the field, leaving only structural features. Suitable for structural decoding of geophysical fields. Allows to trace weak linear anomalies and identify weakly revealed plicative and discontinuous tectonic disturbances |
According to the distribution of magnetic susceptibility within this model, there is a noticeable differentiation associated with a different volume percentage of magnetite content. Thus, Alaskan granites lying in the central and northern parts of the landfill are characterized by magnetic susceptibility in the range from 10–5 to 10–3 units, which gives within this complex a variation of the magnetic field by several hundred nTl (up to 500). Amphibolite-pyroxene gneisses and shales of the Fedorovskaya formation in contact with Alaskan granites have magnetic susceptibility in the range from the first units to the first tens of SI units, which is manifested by a jump in the magnetic field by 2000 nTt relative to the T values for Alaskan granites. Within the Fedorovskaya formation, the variation of T is several hundred nTl (up to 800). The granitogneisses in contact with the complexes of the Fedorovskaya formation in the southern part of the polygon have a magnetic susceptibility from 10–3 to 10–2, which determines the low variability of the magnetic field within the granitogneisses (up to 200 nTl) and an intermediate value of the average level T relative to the average level of the magnetic field characteristic of Alaskan granites, Fedorovsky gneisses and shales.
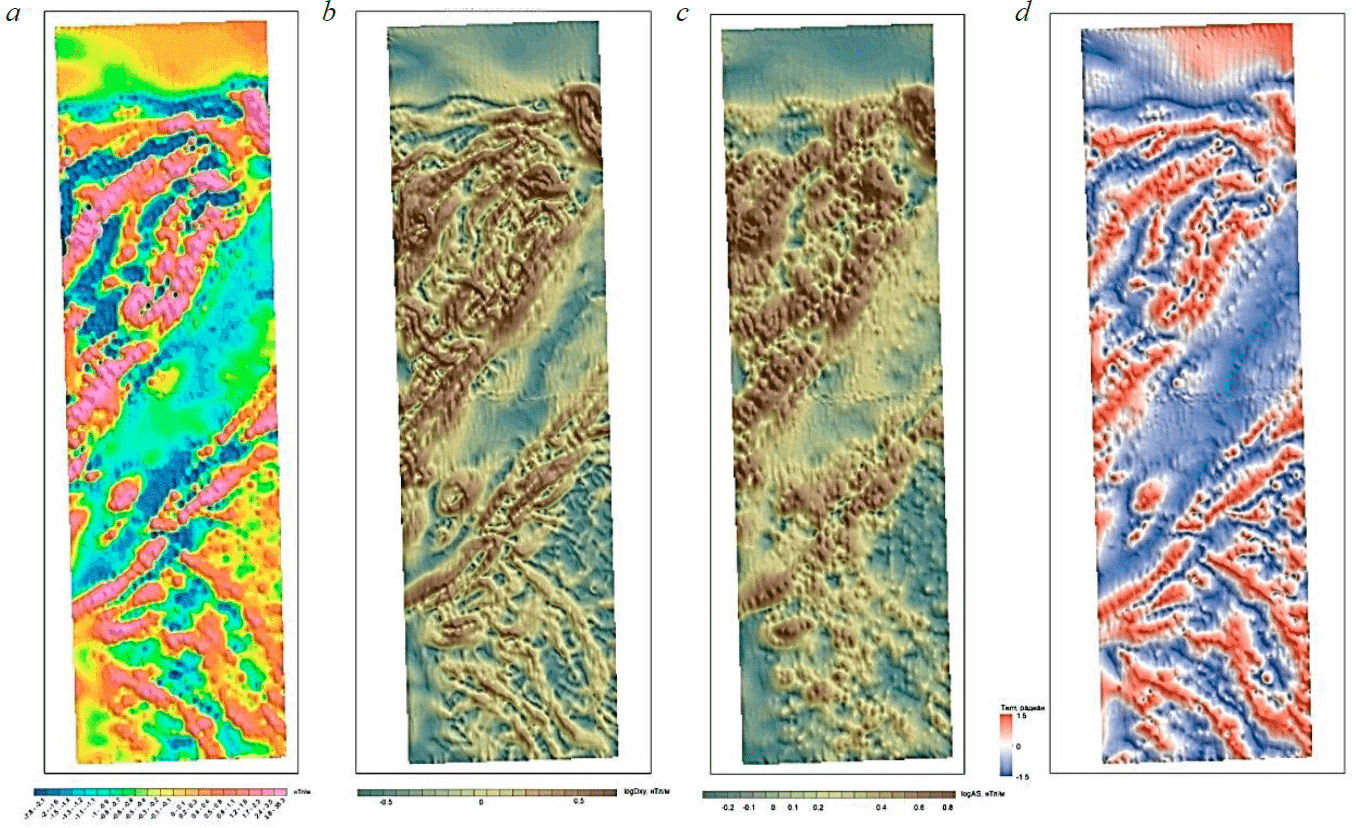
Fig.1. AMF transformations: а – vertical component of the AMF gradient vector; b – horizontal component; c – vector module; d – tilt-transformation
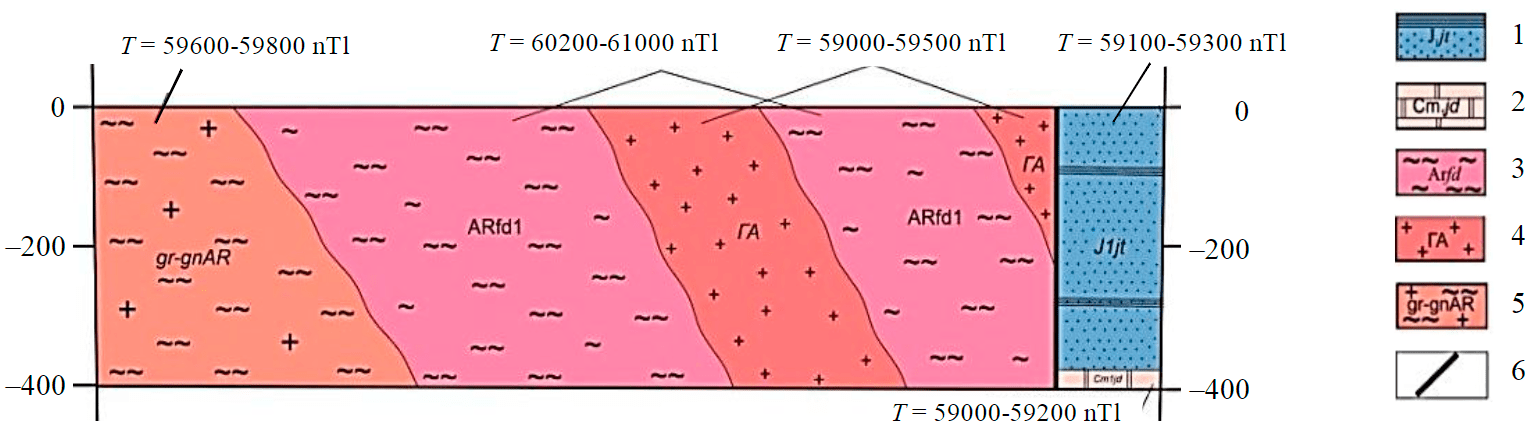
Fig.2. Physical and geological model of the studied area, showing the contact of two geoblocks of different structure and age 1 – Jurassic system, lower division. The Yukhtinskaya formation undifferentiated. Sandstones, gravelites, siltstones, basal conglomerates; 2 – Cambrian system, lower division. The Yudomskaya formation. Dolomites with layers of sandstones and conglomerates of variable thickness at the base; 3 – Archean group, Iengra series. Fedorovskaya formation, lower sub-formation. Amphibolite, biotite-amphibolite, pyroxene gneisses and crystalline shales; 4 – alaskan undifferentiated granites: biotite, biotite-amphibolite and alaskan; 5 – archean deeply granitized rocks and granit-gneisses; 6 – established discontinuous violation
The subsequent morphostructural analysis was implemented through the author's mapping programs [4] – lineament structures (based on remote sensing data of the Earth) and geostructural elements (based on AMF), their classification and subsequent grading using the calculation of the spatial stationary areas of geofields. An infrared satellite image channel with an inter-pixel interval of about two meters, combined with DRM, was used as the source materials for parametric lineament decoding. The final result of the grading and generalization of the scheme of linear morphostructural elements is a ranked morphostructural image of the polygon (Fig.3).
The analysis of the materials shown in Fig.3 demonstrates the common morphology of the geofields (Fig.3, a, c) and its correlation with the primary geological basis (Fig.3, b). Referring to the remote image of the area as a material of high spatial resolution, the division of the polygon into two areas with its spatially stationary structure is visible: the northern part of the polygon, occupying more than a third of its area and characterized by a complex morphology of structural surfaces with their dominant sublatitudinal strike; the middle and southern part of the polygon, which has monotonous spatial dynamics of structural surfaces with their the general submeridional and north-north-western strike. It can be seen that lineament and geostructural decoding (Fig.3, d) distinguish suborthogonal transit structures in relation to the stated azimuths of the strike. As the primary geological basis demonstrates, well-known ore occurrences tend to the area of intersection of some of these structures. The overlay of the graded lineament scheme on the remote basis (Fig.3, a) and the halftone representation of AMF (Fig.3, c) reflects the presence of responses generated by the same endogenous objects in the modern landscape and potential geofield. The graded lineament scheme in the absence of any rankings is similar to the structure of the “broken plate” (Fig.3, d) - does not display significant patterns. Therefore, at the stage of initial assessments, the classification of lineament structures was applied according to the contrast of their occurrence (Fig.3, e). Even in this variant of primitive gradation, it is possible to notice the organization of co-directional extended structures into quasi-periodic families, to the intersection nodes of which the marked ore occurrences gravitate. The final version of the ranking in the project is implemented on the basis of an elliptical sliding window algorithm, the length of the semi-axes of which is determined by the radii of autocorrelation, and the orientation of the large semi-axis is determined by the dominant reach of the isolines in the small neighborhood of the center of the window. Based on a limited sample of geofield measurement points falling within the limits of the sliding window, the autocorrelation radius is calculated, the field of values of which is shown in Fig.4, a:
where R – autocorrelation function of the original geofield (AMF).
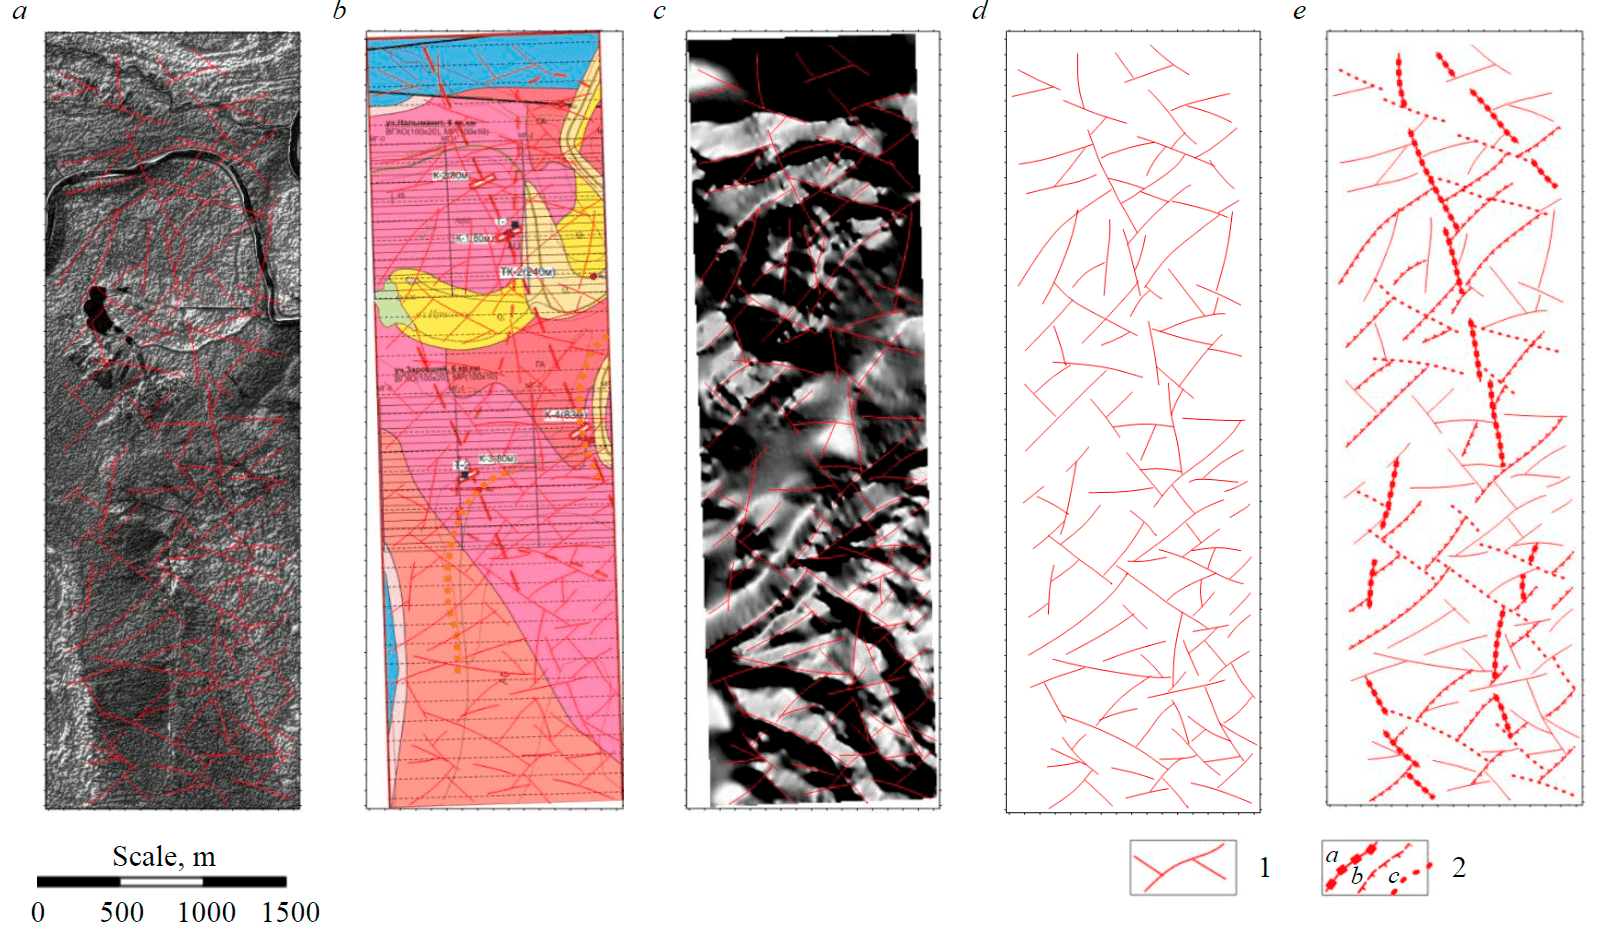
Fig.3. Results of combined morphostructural analysis: a – infrared channel of the remote image of the studied polygon combined with DRM; b – general view of stratigraphic and tectonic boundaries on the primary geological basis of the polygon (known ore occurrences are marked with brown circles); c – AMF in 8-bit halftone representation; d – image of lineament structures, initially mapped on a remote basis (Fig.3, a) and graded using the AMF digital model (Fig.3, b); e – the result of the primary ranking of the graded lineament scheme according to the degree of contrast of the occurrence of extended structures 1 – lineament extended structures of low contrast and strong fragmentation; 2 – extended structures forming quasi-periodic systems of different contrast (а – 0.5-0.7; b – 0.4-0.6; с – 0.3-0.4)
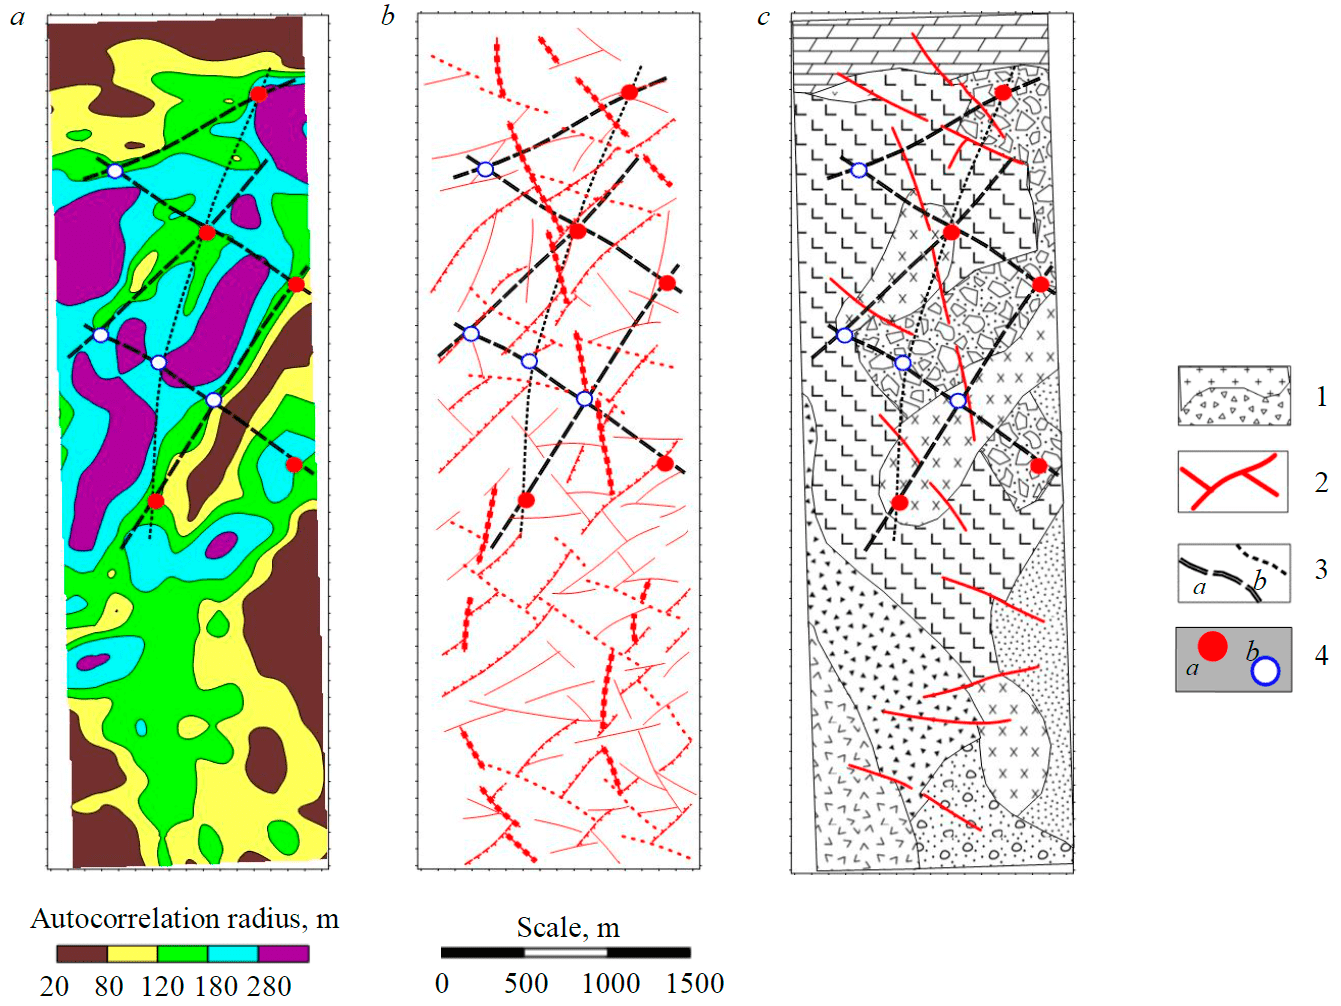
Fig.4. Morphostructural forecast implemented for a limited family of geofields: a – distribution scheme of spatial stationarity areas AMF (in terms of autocorrelation radius); b – verification of mine-controlling coaxial structures by comparison with the scheme of ranked lineaments shown in Fig.3, e; c – updating of the geological basis according to Fig.4, a and verification of morphostructural predictive markers 1 – areas of spatial stationarity – geoblocks; 2 – disassembled lineament structures of high contrast – elements of disjunctive tectonics; 3 – discordant ore-controlling structures of high (a) and low (b) contrast; 4 – marker of reference (a) and predicted (b) gold ore occurrence
Taking the position markers of reference objects (gold ore occurrences) from the initial geological basis (see Fig.3, b) to the contour diagram of the scalar field of the autocorrelation radius (Fig.4, a), it can be noted that all reference markers fall into the gradient regions of this field. At the same time, the gravitation of the reference markers to the deterministic zone of the values of the autocorrelation coefficient from 180 to 280 m is observed, and the gradient regions themselves are organized into intersecting (discordant) extended structural axes. By placing the reference markers in the nodes of the reconstructed grid of discordant structures, we obtain a regular quasi-periodic system within which the position of the standards fits into a deterministic range defined as a predictive marker or an analog of the ore interval. Generalization of the noted features leads to three objectively observed phenomena:
- ore-controlling discordant structures are verified both in the field of values of the autocorrelation radius (Fig.4, a – in the area of articulation of gradient zones of different strike revealed in this field) and in an independently obtained family of ranked lineaments (Fig.4, b);
- the nodes of the reconstructed quasi-periodic grid of discordant structures, where markers predictive of gold ore occurrence are placed, tend to gradient zones in the field of values of the autocorrelation radius (Fig.4, a), as well as reference objects;
- in the system of geoblock structures (Fig.4, c), the boundaries of which were traced by gradient zones in the field in Fig.4, a, reference and prognostic markers tend to elements of discontinuous tectonics or to the boundaries of geoblocks.
This forecasting system fits into the paradigm of wave structuring of the geological environment, which is nonequilibrium in terms of density [4]. Within the framework of the performed approbation, it is possible to insist on the representativeness of the selected prognostic markers placed within the scope of the reference markers (indigenous gold ore occurrences) or at a distance of a single “ore interval” outside this area.
After the verification of the implemented morphostructural forecast is completed, the solution of the inverse problem is applied, which includes two stages:
1. Analytical continuation of the AMF from the observation route into the volume of the rock mass with obtaining a parametric cut in the form of multi-frequency components of this field assigned to different depths. The principle of attributing the deterministic component of AMF to a strictly specified depth is based on the well – known relation:
where S(ω, 0) – Fourier spectrum of the magnetic field measured on the Earth's surface; h – depth of analytical recalculation; S(ω, h) – Fourier spectrum of the magnetic field recalculated to the depth h.
2. Application of a family of gradient filters G(τ) to the obtained parametric cut in reconciliation mode:
where F(x, h) – the result of the inverse Fourier transform with a transition from the spectral plane, where S(ω, h) is given to the subject plane; G(τ) – two sequential filters that first calculate the spatial variability of an analytically extended geofield, then – smoothing using the Gaussian weight function. To increase the detail of the final image, the calculation of the spatial derivative of the first order according to the selected (dominant) reach is added to these filters.
The result of the deep reconstruction is shown in Fig.5, b, where projections of the positions of reference and prognostic markers are made: 2600 and 5500 m along the profile route – for reference markers; 1600-1700, 4000 and 4500 m – for prognostic forecast markers (Fig.5, a). In the structure of the parametric incision, one can see the presence of steeply-dipping structural surfaces at the positions of 2600 and 5000 m (halftone image), correlating with the image of the subvertical “plumes” (in the distribution of apparent magnetization). Taking these features as prognostic parametric markers, we obtain:
- at the forecast position of 1600-1700 m, there is a steeply dipping structural surface combined with a low-contrast “plume” image;
- at the forecast position of 4000 m, a steeply dipping structural surface and a contrasting “plume” image are observed;
- at the forecast position of 4500 m, a low-contrast steeply dipping structural surface and a low-contrast “plume” image are observed.
Reference and prognostic markers are linked to the profile route by applying a square footage to the profile route and projecting the nearest markers onto this route (Fig.5, a). On the parametric cut (in terms of the dimensionless distribution of apparent magnetization (Fig.5, b), reliable reference and prognostic markers correlate with the image of a sharp violation of the monotony of the occurrence of structural surfaces in the form of “plume” structures.
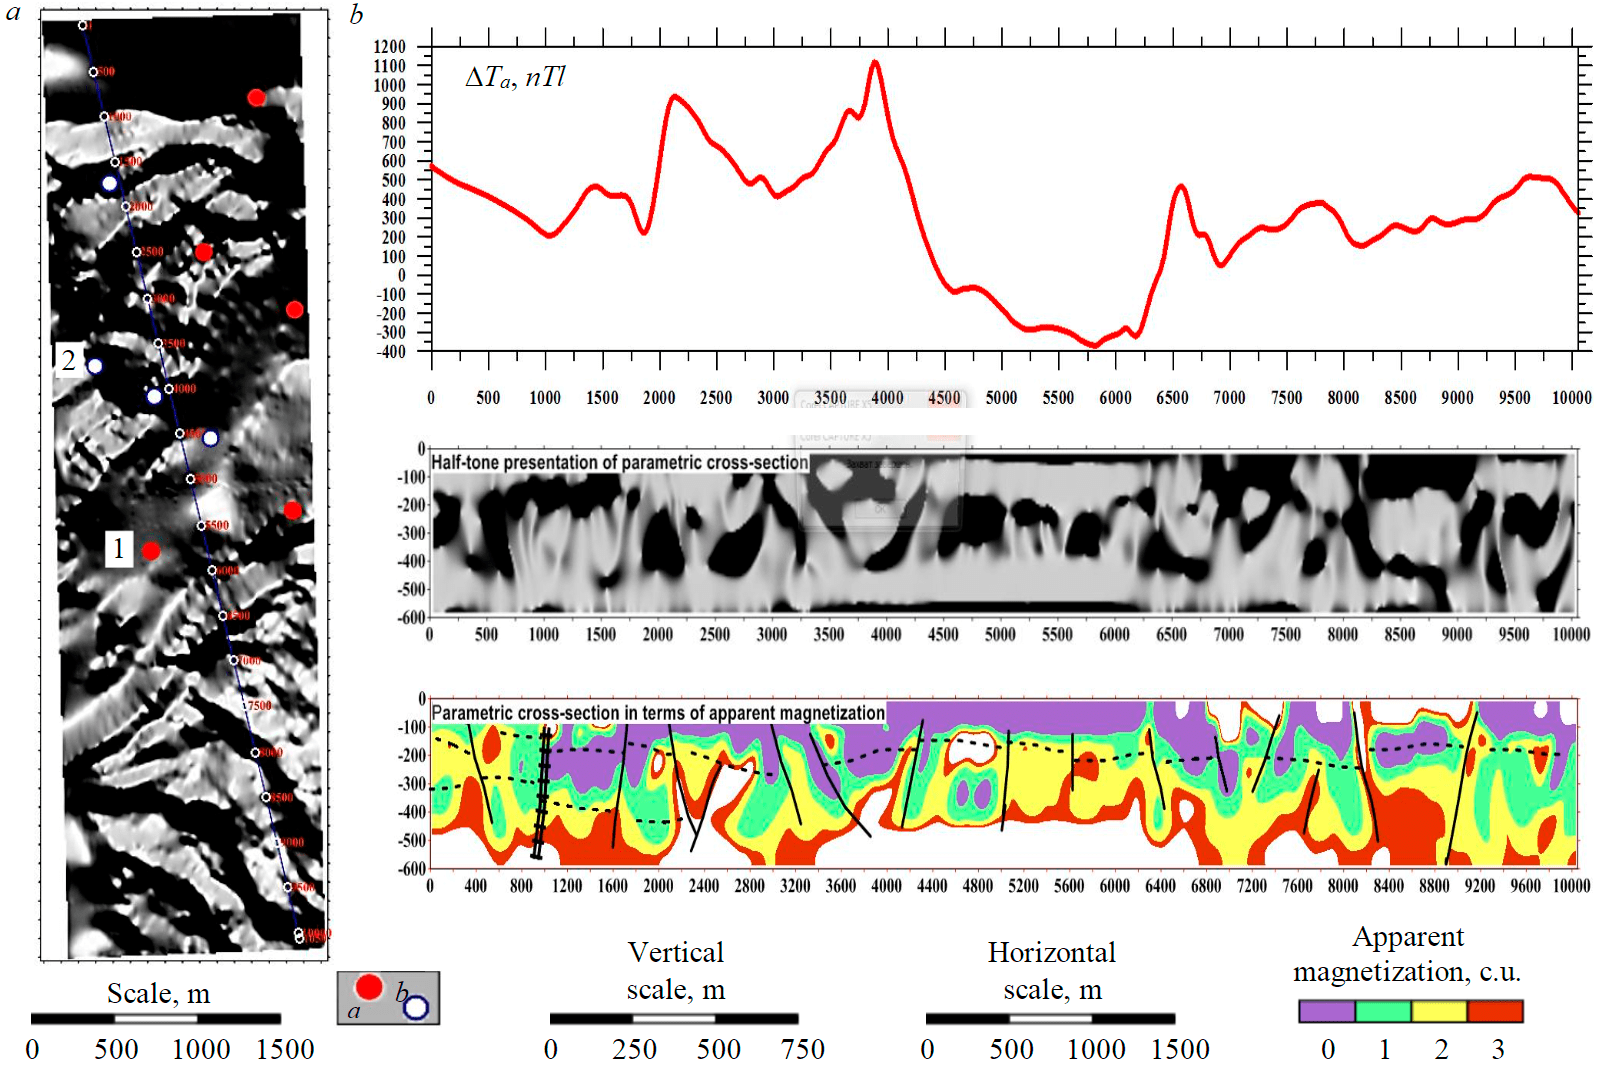
Fig.5. Selection of AMF values according to the profile laid across the dominant strike of ore-controlling structures (a) followed by an analytical continuation (b) See the legend in Fig.4
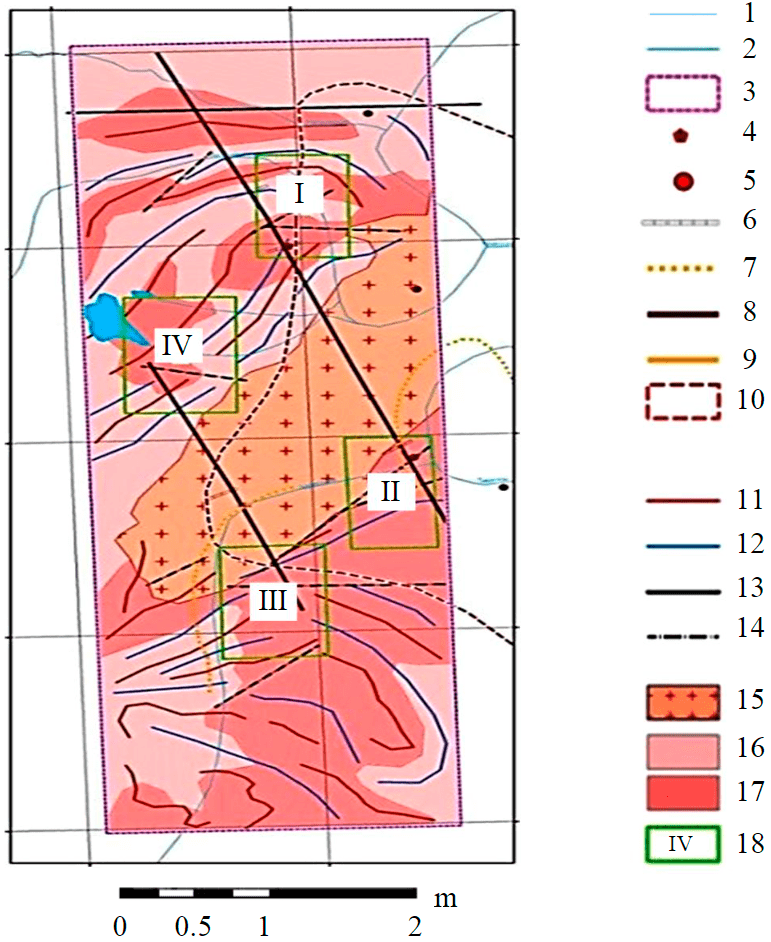
Fig.6. Planning the order of detailed work (green rectangles with numbers) against the background of a simplified representation of the primary structure of AMF 1 – relief isolines through 20 m; 2 – rivers and streams; 3 – aeromagnetic survey site; 4 – gold ore occurrences in explosive breccias; 5 – a placer sample with significant gold content; 6 – ditches; 7 – promising scattering flows; 8 – potential gold ore bodies; 9 – gold placers; 10 – halo of placer gold content; 11-14 – structural magnetic field lines: 11 – low magnetization; 12 – high magnetization; 13 – regional tectonic zone; 14 – fracture zones; 15 – archean undifferentiated Alaskan granites; 16 – amphibole, biotite-amphibole, riroxene gneisses and crystalline shales; 17 – archean deeply granitized rocks and granitogneisses; 18 – prospecting sites
Thus, the basis has been obtained for ranking objects promising for gold ore development in terms of the order of planned detailed (ground) surveys. Concluding the interpretative estimates, it should be noted that the parametric cut in Fig.5, b contradicts the physical and geological model in Fig.2, since along with the subvertical stratification of the rock mass, it reflects its subhorizontal stratification. This contradiction is estimated as apparent, and the subhorizontal stratification of the cut leads to a decrease with depth of the volume density of cracks in intrusive complexes and, accordingly, to a decrease with depth of the volume content of magnetite, mainly metamorphogenic [28].
When planning detailed surveys, it is recommended to combine the result of the obtained forecast constructions with the past geological and geochemical studies. Thus, single signs of gold within the cartographic sheet O-51-XXX were found in the samples of the Timpton River above the mouth of the Chulmakan, Gorbillakh Rivers and in separate samples of the Ulakhan-Melemken River. It is possible that the sources of gold in the placer samples along the named watercourses are the metal placers washed away by rivers outside the sheet. Gold ore occurrence on the right bank of the Chulman River was established in 2002 by S.A.Chernov and was associated with explosive breccias [29, 30]. Based on these provisions, four sites are proposed (Fig.6) for prospecting, where the areas of intersection of differently directed tectonic disturbances within granitized complexes have the greatest prospects for detecting gold-bearing mineralization.
Discussion
Aeromagnetic shooting with UAV has a number of advantages compared to ground and airplane surveys. A comparative analysis of the types of magnetic survey is given in Table 2.
Table 2
Comparison the types of magnetic survey
|
The parameter |
Ground survey |
Survey with UAV |
Big aviation |
|
Cost of work, rub/km |
From 6500 |
From 2000 |
From 1500 |
|
Accuracy |
High exposure to noise |
High, sensitive |
Medium, complex interference compensation |
|
Productivity, km/day |
On average 15 |
To 220 |
To 1000 |
|
Preparation for work |
Complicated |
Simple |
Complicated/Expensive |
|
The human factor |
High probability of error |
Absent |
The average probability of error, crew life risk |
Based on the data obtained at the research site and the past experience of using UAV in magnetic exploration in Russia and abroad, the goal is to improve the technique of aeromagnetic survey with UAV so that the quality of the data obtained is commensurate with the quality of ground and aircraft types of magnetic surveys. For this purpose, recommendations for unmanned aeromagnetic survey have been developed:
1. Increasing the number of control routes. In aeromagnetic photography with UAV, their volume is determined formally – based on the scale and tasks, according to the terms of reference. In accordance with the instructions for magnetic exploration for 1981, the recommended volume of control measurements is at least 5 % of the total number of ordinary routes, and for experimental and methodical surveys – at least 10 %. When conducting aeromagnetic surveys with UAV, it is always necessary to cover at least 10 % of the survey area with control measurements, but not more than 20 %, which is determined by the factor of economic profitability [31, 32]. Such a volume of control measurements is necessary for the correct assessment of the root-mean-square error of the survey as a criterion for the quality of hardware measurements:
where Δi – differences of ordinates of the final graphs of ΔТ or ΔТа on ordinary and independent diagonal secant routes at their intersection points; n – number of differences Δi, n > 50.
2. “Overlap” on traverse and secant routes. According to the standard requirements, the traverse and secant routes should be performed in one span per day of ordinary flights. This condition is not always met when surveying from a drone: the maximum flight duration of a quadcopter is 1 hour (with a payload in the form of a magnetometer, the maximum flight time will be no more than 45 min), and according to technical parameters, the drone may not reach the end of the route on a large surveying area [33]. To minimize the influence of this factor, it is proposed to perform an “overlap” of 200-500 m between flights on the same traverse and secant routes on the same day. Then the areas need to be “stitched” during the primary (before interpretation) processing of magnetic survey data.
3. A “control flight” before and after an ordinary route along the same area outside the survey area (similar to a control point with a ground-based version of magnetic survey). It is necessary to check the correct operation of the equipment. These “spans” are sometimes used for preliminary rough linking of the results of aeromagnetic survey. If the root-mean-square error is more than 5 nTl, then it is necessary to perform a repeated flight along the regular route.
4. “Star” is a form of flight implemented before the start of system measurements on the area to check the correctness of the equipment. This is necessary to calculate the orientation error of the complex (the average square deviation of the actual position of the gondola from the specified one should not exceed two meters) and the subsequent introduction of corrections during data processing.
5. An increase in the number of turns of the measuring complex behind the contour of the work site is necessary to increase the time allotted to the magnetometer to assume a stable position on the suspension while minimizing its swinging. The procedure will minimize the technically conditioned “gaps” of the obtained magnetic field values and ensure the correctness of the data. The recommended length of turns is at least 150 m.
6. Providing multi-altitude surveying for verification of the results of analytical continuation and obtaining, to varying degrees, generalized images of anomalous objects [34, 35]. The procedure can be performed only by means of unmanned aircraft in the absence of such for ground survey and economic unprofitability in the conditions of using large-tonnage aircraft carriers. The hardware estimates of the field structure in the implementation of multi-altitude cuts differ in a single character, whereas the inverse problem is defined as incorrect due to the multiple nature of the final solution [36].
7. Reconstruction of vertical profiles for a more correct interpretation of data and narrowing of the equivalent set of solutions to the inverse problem of potential theory. To this end, the quadcopter flies at a constant speed along a vertical trajectory, first up to a certain height, then down at the same speed. This procedure is rational for the angular points of the survey area and in its implementation has a methodological feature: the magnetometer must be rigidly and motionlessly fixed on a suspension to minimize the influence of strong atmospheric flows on measurements and reduce the orientation error of the measuring complex [36].
8. Creation of DSM (digital surface model) and DRM for the survey area. Due to its greater detail, the DSM is designed to exclude emergency contact of the UAV with natural and man-made local forms of the Earth's surface. DRM should provide flights with selective and detailed rounding of local landforms. Files with DSM and DRM are intended for loading into the memory of a magnetometric quadcopter.
9. A competent choice of the surveying scale. For reliable decoding, especially in conditions of folded and tectonic structures, it is necessary to conduct aeromagnetic surveys on a larger scale than 1:25000 or 1:10000. The required scales are 1:5000; 1:2000, etc. A technical rule is applied for this: the distance between the routes should be comparable to the observation altitude of the magnetometer flight. In the case of the correct orientation of the profiles in the intersection of the dominant strike of geostructural elements, revealed in the rose of the orientation of the lineaments, AMF records most of the structural-lithological and structural-petrographic anomalies of the polygon. The deep nature of these anomalies is determined by the right correction to the AMF, taking into account the influence on its amplitude-frequency composition of local forms of earth's relief.
10. The use of two or more measuring complexes simultaneously to ensure the accumulation mode and increase the signal-to-noise ratio in the direct measurement mode [37].
11. Wireless data transmission over a Wi-Fi network via a repeater system. The Geoscan 401 Geophysics complex automatically records magnetometry and positioning data on a removable flash card. The procedure of wireless data transmission is capable of providing a complex of preliminary (real-time surveys) qualitative and quantitative analysis of the magnetic field. The relevance of the procedure is associated with unpredictable weather factors and the costs of organizing the field work itself.
12. The use of a trouble-free rescue system of the measuring complex, which directly determines the growth of profitability of unmanned geophysical measurements due to the reduction of irreversible losses of both the measuring complex itself and the data accumulated by it.
Two variants of rescue systems are offered for each of the components of the complex:
а) for a quadrocopter – a parachute; the emergency parachute release button built into the communication modem will be triggered even when the ground control station fails;
b) for a magnetometer, there is a system of automatic release of a nylon cord with a device from an unmanned aerial vehicle.
13. The development of an uninterrupted positioning system, involving both the combination of GPS and GLONASS satellite navigation systems, and the triangulation technique, using a system of ground-based radio beacons, that proved itself during the period of pre-satellite aerial. The used magnetometer has a NAVIS GPS sensor with a positioning accuracy of approximately ±10 m. Despite this relatively high-quality indicator, the accuracy of spatial reference can be increased by introducing alternative sensors. So, the sensor of the Swiss company U-blox will allow to realize the accuracy of position determination up to ±5 m. The introduction of corrections in the specialized MAGNET Tools program for the data obtained from the U-blox sensor allows an increase in the alignment accuracy up to ±20-30 cm (with strong wind squalls up to a maximum of ±50 cm).
Within the framework of scientific and production works, the given method of forecasting is supplemented by image recognition with training, including:
- formation of activation function based on trained neural networks;
- reconstruction of probabilistic halos that detect the degree of reliability of the forecast in nonlinear (modified) discriminant analysis;
- evaluation of multiple correlation between random and reference spectral signatures allocated in the structure of remote sensing data (spectrozonal survey).
Despite the theoretical need for step-by-step refinement of the results of the considered morphostructural prediction, the noted methods of recognition with training require an increase in the volume of the experimental sampling, as a rule, by means of geofields measured by physically independent methods. Imitation of sample expansion due to accumulation of transformants of one geofield often leads to accumulation of primary measurement error, which determines the highly dispersed structure of forecast maps at the output. The developed and tested method of morphostructural prediction is applicable in conditions of limited sampling: in this case, the infrared channel of remote surveying and the distribution of AMF values. Within the framework of the considered technique of unmanned aeromagnetic survey, an increase in the volume of the analyzed sample can be realized by including DSM and DRM in the quantitative analysis stage, as well as combining magnetometric measurements with thermal imaging and aerogamma spectrometric estimates.
The method of morphostructural forecasting is actively supplemented by non-etalon markers of the anomalous state of the rock mass, which can be called fundamental in the conditions of some ambiguity of the considered interpretative constructions. An example of such ambiguity can be a generalized morphostructural image of a polygon (see Fig.3, d): the transition from a family of disparate local lineaments to a regular system of extended structures and their discordant relations is based on a regularizing functional. Another example of ambiguous constructions (Fig.4, a): the structure implies the need for iterative selection of the exact position of gradient zones, providing a minimum standard deviation from the axis of these zones of reference ore objects. The third example relates to the multiplicity of hypotheses concerning the occurrence of ore-controlling factors in the measured geofields. Distracting from the concept of coaxial and discordant ore-controlling structures, it is proposed to pay attention to Fig.5, a, where the family of reference and forecast ore objects tends to the periphery of the ring structure, contrastingly revealed in the semitone image of AMF. The contours of this structure are shown in Fig.7. Along with the noted ambiguity, it can be said that mapping of the ore-controlling ring structure, to the contours of which 100 % of the reference and forecast ore markers gravitate, additionally verifies the reasonable result of morphostructural analysis. In the southern part of the AMF task area, a similar circoid shape can be observed, despite the fact that some of the ore-controlling extended geostructures clearly extend in the direction of the center of curvature of the southern circoid structure. Thus, the issue of expanding the area of detail by ground surveys may be raised when clarifying ore genesis in the southern part of the polygon.
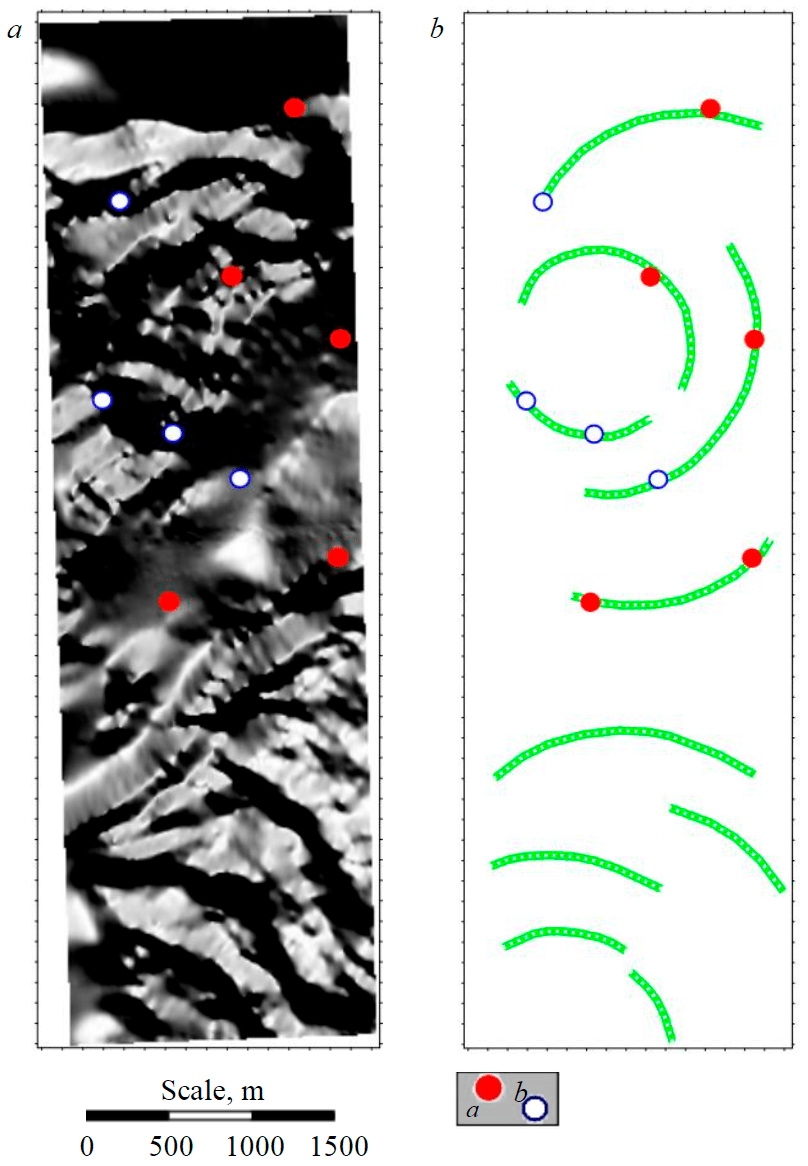
Fig.7. The image of a nonlinear (circoid) ore-controlling structure, alternative to the image of coaxial and discordant ore-controlling structures in Fig.4: a – a halftone image of AMF with reference and prognostic markers applied to it when selecting the azimuth of illumination, contrasting the image of the ore-controlling circoid structure; b – the result of decoding the contours of the ore-controlling ring structure in the northern part of the polygon and a ring structure of similar morphology and linear dimensions in the southern part of the polygon See the legend in Fig. 4
Conclusion
Magnetometric surveys, including those from unmanned carriers, have been tested for about 30 years in Russia and abroad, having managed to establish itself in the market as a reliable geophysical method. The noted reliability is formed on the basis of a number of methodological tricks and technological improvements, which over time will form a single methodological basis fixed in the regulatory documentation. At the moment, such documentation does not exist even for the use of UAV in cadastral surveying without taking into account geological and geophysical surveys. Therefore, the system of formulated recommendations to improve the quality and increase the profitability of unmanned aeromagnetic survey has a pronounced relevance. This is especially true for the points concerning the author's methods of optimizing the reach of flight routes and making an amendment that takes into account the influence of local forms of terrestrial relief on the structure of AMF. The first of these points concerns the parametric development of the reconstruction of the geostructural image of the polygon, which in its algorithmic implementation is a pronounced competition between the domestic WinLESSA and the Canadian PCI Geomatica. The proposed algorithmic module, based on the criterion of minimizing the dispersion functional, is able to isolate not only the integral characteristics of the lineament field (like WinLESSA) and obvious spatial structures (like PCI Geomatica), but also to map low-contrast geostructural elements, including circoid ones. The module of morphostructural reconstruction acquires special significance in terms of a single criteria basis for the qualitative interpretation of potential and non-potential fields during their integration. Against this background, the approbation of the AMF correction technology for local relief forms allows to determine the position of lineament structures corresponding to endogenous geostructural forms, most of which are represented by the elements of discontinuous tectonics that are currently activated.
Developed in addition to the technology of magnetometric surveys themselves, the methodology of qualitative and quantitative interpretation is designed to solve two fundamental problems: forecasting of indigenous ore objects in conditions of minimal geological and geophysical texture and reducing the time gap between field survey and its geostructural interpretation. Standard methods of pattern recognition with training are needed (discriminant analysis, k-averages method) as many independent geological and geophysical features detecting the reference object as possible. The same necessity is present in the technology of neural network assessments. The presented algorithm uses wave analogies that allow predictive constructions based only on primary geomorphological surveys with the construction and integration of DSM and DRM when sorting the result based on morphostructural analysis of AMF. Assigning any rank of significance to the identified promising objects turns out to be possible by appealing to the results of the quantitative interpretation of AMF, based on the same wave analogies. The applicability of the latter both within the framework of geological exploration tasks and for solving less deep and more substantive engineering and geophysical tasks is confirmed by the 20 years of experience.
A side result of the presented research is an express assessment of remote sensing results at the stage of DSM and DRM formation or at the stage of magnetometric measurements. If in the first case it means lineament reconstructions, then in the second case it means quantitative interpretation of AMF along individual routes (up to the stage of linking and leveling the observation network). Thus, it opens up the possibility of forming a single hardware and software conglomerate capable of generating geologically significant results in real time. With regard to this conglomerate, it is necessary to note the direction of the non-etalon forecast developed by the departments of VIRG-Rudgeofizika during the Soviet period of the formation of the geological industry in the Russian Federation: the concept of mine-controlling discordant structures developed by T.A.Milai and V.K.Orlov, marking weakened zones with tectonic stress centers in the LEGRA (MARS) software package. In this paper, these criteria were presented on the example of a geological polygon – one of the promising gold mining regions.
References
- Gurev K.N. Yakut Klondike – Golden Aldan. Istoriko-geograficheskii kulturologicheskii zhurnal. 2005. N 2 (43), p. 48-54 (in Russian).
- Maksimov E.P. Mesozoic ore-bearing magmatogenic systems of the Aldano-Stanovoi Shield: Avtoref. dis. … d-ra geol.-mineral. nauk. Yakutsk: Institut geologii almaza i blagorodnykh metallov, 2003, p. 47 (in Russian).
- Molchanov A.V., Terekhov A.V., Shatov V.V. et al. Gold ore districts and ore clusters of the Aldanian metallogenic province. Regional Geology and Metallogeny. 2017. N 71, p. 93-111 (in Russian).
- Petrov O.V., Movchan I.B. Applied aspects of dissipative structuring theory to the nonequilibrium geological environment. The Earth’s Dissipative Structures. Fundamental Wave Properties of Substance. Springer, 2019, p.187-255. DOI: 10.1007/978-3-319-93614-7
- Semenova T., Al-Dirawi A. Economic Development of the Iraqi Gas Sector in Conjunction with the Oil Industry. Energies. 2022. Vol. 15. Iss. 7. № 2306. DOI: 10.3390/en15072306
- Kuzmin D.K. Geoscan Group of Companies – geoinformation support is the future. Gornaya promyshlennost. 2015. N 2 (120), p. 98-99 (in Russian).
- Tarasov A.V., Ihina E.R., Kayukov A.E., Goglev D.A. Experience of Using Low-Altitude Aeromagnetic Survey with the Complex Geoscan-401-Geophysics at the Synyr Ultrapotassic Igneous Massif. Prospect and protection of mineral resources. 2019. N 10, p. 20-31.
- Skudneva O.V. There is no alternative to unmanned aerial vehicles in the realities of today's geopolitics. Nauchnye tendentsii: voprosy tochnykh i tekhnicheskikh nauk, 12 oktyabrya 2018, Sankt-Peterburg, Rossiya. TsNK MOAN, 2018, p. 27-35 (in Russian). DOI: 10.18411/spc-12-10-2018-09
- Firsov A.P., Zlygostev I.N., Savluk A.V. et al. Aeromagnetic low-altitude survey with UAV: achievements, prospects, problems. Effektivnost geologorazvedochnykh rabot na almazy: prognozno-resursnye, metodicheskie, innovatsionno-tekhnologicheskie puti ee povysheniya, 29 maya – 1 iyunya 2018, Mirnyi, Rossiya. Alrosa, 2018, p. 325-330 (in Russian).
- Dandan Jiang, Zhaofa Zeng, Shuai Zhou et al. Integration of an Aeromagnetic Measurement System Based on an Unmanned Aerial Vehicle Platform and Its Application in the Exploration of the Ma’anshan Magnetite Deposit. IEEE Access. 2020. Vol. 8, p. 189576-189586. DOI: 10.1109/ACCESS.2020.3031395
- Mahmut Sari, Aysel Seren, Selcuk Alemdag. Determination of geological structures by geophysical and geotechnical techniques in Kirklartepe Dam Site (Turkey). Journal of Applied Geophysics. 2020. Vol. 182. N 104174. DOI: 10/1016/j.appgeo.2020.104174
- Malehmir A., Dynesius L., Paulusson K. et al. The potential of rotary-wing UAV-based magnetic surveys for mineral exploration: A case study from central Sweden. The Leading Edge. 2017. Vol. 36. Iss. 7, p. 538-620. DOI: 10.1190/tle36070552.1
- Parshin A., Morozov V., Blinov A. et al. Low-altitude geophysical magnetic prospecting based on multirotor UAV as a promising replacement for traditional ground survey. Geo-spatial Information Science. 2018. Vol. 21. Iss. 1. p. 64-74. DOI: 10.1080/10095020.2017.1420508
- Shiliang Liu, Wenping Li, Wei Qiao et al. Zoning method for mining-induced environmental engineering geological patterns considering the degree of influence of mining activities on phreatic aquifer. Journal of Hydrology. 2019. Vol. 578. N 124020. DOI: 10.1016/j/hydrol.2019.1214020
- Goglev D.A. Low-altitude aeromagnetic survey using unmanned aerial systems based on a quadcopter in archaeology. Geoprofi. 2018. Vol. 6, p. 20-22 (in Russian).
- Cherkasov S.V., Sterlingov B.V., Semenov A.E. Using UAV to solve geological problems. Aeromagnetic survey. Primenenie tekhnologii Geoskan dlya distantsionnogo zondirovaniya Zemli i monitoringa obektov, mart-aprel 2016, Sankt-Peterburg – Moskva, Rossiya. URL: http://fcpir.ru/upload/iblock/96b/corebofs000080000ki60oc8ddmf1s7c_presentation.pdf (accessed 20.10.2021).
- Tada N., Ichihara H., Nakano M. et al. Magnetization structure of Nishinoshima volcano, Ogasawara island arc, obtained from magnetic surveys using an unmanned aerial vehicle. Journal of Volcanology and Geothermal Research. 2021. Vol. 419. N 107349. DOI: 10.1016/j.jvolgeores.2021.107349
- Zamani A., Nedaei M., Boostani R. Tectonic zoning of Iran based on self-organizing Map. Journal of Applied Sciences. 2009. Vol. 9. Iss. 23, p. 4099-4114. DOI: 10.3923/jas.2009.4099.4114
- Anikeeva I.A., Kadnichanskiy S.A. Evaluation of the actual resolution of digital aerial and satellite imagery using an edge profile curve. Geodesy and cartography. 2017. Vol. 78. N 6, p. 25-36 (in Russian). DOI: 10.22389/0016-7126-2017-924-6-25-36
- Beregovoi D.V., Mustafin M.G. Automated method of а topographic plan creation based on survey from a drone. Geodesy and cartography. 2018. Vol. 79. N 9, p. 30-36 (in Russian). DOI: 10.22389/0016-7126-2018-939-9-30-36
- Tang R., Fritsch D., Cramer M., Schneider W. A Flexible Mathematical Method for Camera Calibration in Digital Aerial Photogrammetry. Photogrammetric Engineering & Remote Sensing (PERS). 2012, p. 1069-1077. DOI: 10.14358/PERS.78.10.1069
- Wim Van Wegen. High-end UAVS. A Key Link in the Value Chain. GIM International. 2017. Vol. 31. Iss. 4, p. 30-31.
- Sadykov M.I., Blinov P.A., Nutskova M.V. Use of the water-swellable polymers (WSP) for wellbore stabilization in intensely fractured rock intervals. E3S Web of Conferences. 2021. Vol. 266. N 01013. DOI: 10.1051/e3sconf/202126601013
- Dolgal A.S. Computer technologies for processing and interpreting data from gravimetric and magnetic surveys in highlands. Abakan: Taimyrkomprirodresursy, 2002, p. 188 (in Russian).
- Parshin A., Budyak A., Babyak V. Interpretation of Integrated Aerial Geophysical Surveys by Unmanned Aerial Vehicles in Mining: a Case of Additional Flank Exploration. IOP Conference Series: Earth and Environmental Science. 2020. Vol. 459. Iss. 5. N 052079. DOI: 10.1088/1755-1315/459/5/052079
- Dolgal A.S. Evaluation of the influence of the shape of the measurement surface in the method of source-like approximation of geopotential fields. Gornoe ekho. 2020. № 2 (79), p. 49-57 (in Russian). DOI: 10.7242/echo.2020.2.10
- Muravina O.M., Dolgal A.S., Ponomarenko I.A. Application of statistical methods to take into account the influence of the terrain when conducting aeromagnetic surveys. Proceedings of Voronezh State University. Series: Geology. 2020. N 2, p. 69-75. DOI: 10.17308/geology.2020.2/2860
- Kalinin D.F., Egorov A.S., Bolshakova N.V. Prospective oil and gas potential of the West Kamchatka coast and its relationship with the structural and tectonic structure of the Okhotsk Sea region according to geophysical data. Vestnik KRAUNTs. Nauki o Zemle. 2022. N 1 (53), p. 59-75 (in Russian). DOI: 10.31431/1816-5524-2022-1-53-59-75
- Prokop'ev I.R., Doroshkevich A.G., Redina A.A. Mineralogy and fluid regime of formation of carbonatites of the Central Aldan: The Seligdar apatite deposit and the Ust-Chulman occurrences (Yu.Yakutia, Russia). Geologiya i minerageniya Severnoi Evrazii, 3-5 oktyabrya 2017, Novosibirsk, Rossiya. Institut geologii i geofiziki, 2017, p. 195-196 (in Russian).
- Radkov A.V., Molchanov A.V., Artem'ev D.S. et al. State Geological Map of the Russian Federation. Scale 1:1000000 (third generation). Aldano-Zabaikalskaya series. Sheet O-51 – Aldan. Explanatory note. St. Petersburg: Kartograficheskaya fabrika VSEGEI, 2015, p. 365 (in Russian).
- Kremcheev E.A., Danilov A.S., Smirnov Y.D. Metrological Support оf Monitoring Systems Based оn Unmanned Aerial Vehicles. Journal of Mining Institute. 2019. Vol. 235, p. 96-105. DOI: 10.31897/PMI.2019.1.96
- Pashkevich M.A., Smirnov Y.D., Danilov A.S. Estimation of quality of environment with the use of small pilotless aircrafts. Journal of Mining Institute. 2013. Vol. 204, p. 269-271 (in Russian).
- Smirnov Yu.D., Dobrynin O.S. Development of unmanned aerial vehicles for environmental monitoring. Journal of Mining Institute. 2014. Vol. 207, p. 213-216 (in Russian).
- Alekseev S.G., Kozlov S.A., Shtokalenko M.B., Smirnov V.E. Characteristics of 2D- and 3D-potential field anomaly interpretation. Journal of Mining Institute. 2011. Vol. 194. 128-131 (in Russian).
- Zakharov S.V. Modeling and interpretation of potential fields of some two-dimensional interfaces described by irrational functions. Journal of Mining Institute. 1987. Vol. 113, p. 109-114 (in Russian).
- RICS (2014). Measured surveys of land, buildings and utilities, 3rd edition. Guidance note. London: RICS. URL: www.rics.org/uk/upholding-professional-standards/sector-standards/land/measured-surveys-of-land-buildings-and-utilities/ (accessed 29.04.2019).
- Bian J., Wang X., Gao S. Experimental aeromagnetic survey using a rotary-wing air-craft system: a case study in Heizhugou, Sichuan, China. Journal of Applied Geophysics. 2021. Vol. 184. N 104245. DOI: 10.1016/j.jappgeo.2020.104245