
Possibilities of accounting the fracturing of Kashiro-Vereyskian carbonate objects in planning of proppant hydraulic fracturing
- 1 — 1st Category Engineer Branch of “LUKOIL-Engineering” LLC “PermNIPIneft” ▪ Orcid
- 2 — Ph.D., Dr.Sci. Professor Perm National Research Polytechnic University ▪ Orcid
- 3 — Ph.D. Researcher Perm National Research Polytechnic University ▪ Orcid
- 4 — Ph.D., Dr.Sci. Professor Perm National Research Polytechnic University ▪ Orcid

Abstract
One of the effective methods of oil production intensification for heterogeneous Kashiro-Vereyskian clay-carbonate sediments of the Volga-Ural oil and gas bearing province is proppant hydraulic fracturing. Prospects of realization for this technology are considered in the article on the example of the Vereyskian development object of Moskud’inskoye field. Based on the analysis of rocks samples investigations of Vereyiskian sediments, lithological types of carbonate rocks differing in their structural features are distinguished. Tomographic investigations of rock samples were carried out, as a result of which the rock fracturing for some lithotypes was determined and studieds. Under natural geological conditions, depending on the degree of fracturing progression and technological conditions of development, these intervals may or may not be involved in well operation. When hydraulic fracturing is performed, potentially fractured areas that are not in operation can be successfully added to oil production. Based on analysis of hydrodynamic well investigations, the fracturing of the Vereyskian object of the Moskud’inskoye field was studied on the basis of the Warren-Ruth model. With the help of geological and technological indicators of development, prediction fracturing was obtained, which was used for the construction of the natural fracturing scheme. Areas of both pore and fractured reservoirs development were identified on the deposit area. As a result of statistical analysis, the influence of fracturing on efficiency of proppant hydraulic fracturing was determined. Based on the linear discriminant analysis, a statistical model for predicting the efficiency of proppant fracturing was developed. It was shown that in addition to natural fracturing, the results are most strongly influenced by specific proppant yield, formation pressure, permeability of the remote bottomhole zone and skin effect. Based on the developed model, prospective production wells of the Moskud’inskoye field are identified for proppant hydraulic fracturing.
None
Introduction
One of the most promising objects in the Volga-Ural oil and gas province (VUOGP) is the Kashiro-Vereyskian carbonate deposits (K-V). Despite a long history of development, the current depletion of K-V formations for most of the deposits does not exceed 30 %. This is primarily due to the low efficiency of standard geological and technical measures (GTM) in highly inhomogeneous clay-carbonate formations. In the recent decades, the intensification of production in carbonate objects is associated with the introduction of hydraulic fracturing (HF) technology, which is massively applied in the study area as well. There is a great number of HF technologies and their modifications such as standard acid and proppant fracturing (AHF and PHF), acid-proppant [10, 16], massive fracturing, nitrogen-foam fracturing and others [3, 34]. In the last decade, proppant fracturing was the most used for Kashiro-Vereyskian objects, which under conditions of carbonate reservoirs is characterized by significant initial increases in oil flow rates and duration of the effect over time [11, 26, 30].
HF efficiency depends primarily on the geological and physical conditions of the formation layering, the physical and chemical composition of the formation fluids and the technological parameters of HF. The main technological parameters include the volume, ratio and concentration of acids, the amount, type and concentration of the propping agent, the energy state of the deposit, formation thickness and stratification, heterogeneity of permeability and porosity properties (PPP) of rocks, the azimuth of development and geometry of the HF fracture [13, 35]. Another important factor influencing the HF efficiency is the presence of natural fracturing in the geological section of the developed objects [29].
The scientific novelty of the research is determined by the presentation of the Kashiro-Vereyskian carbonate sediments as a complex object with development zones of pore- and fracture-type reservoirs. At the same time, some areas of fractured-type reservoirs development containing oil reserves are not accounted for by the State balance of the Russian Federation. Identification of fractured oil-saturated intervals together with HF optimization allows adding additional oil reserves to the production process. In turn, optimization of this technology is possible by applying statistical analysis of HF efficiency considering a set of geological and technological indicators, which in this work is implemented for formation B3B4 of Moskud’inskoye field by means of multivariate statistical models.
Statement of the problem
To study the effect of fracturing in carbonate rocks on HF efficiency, the Vereyskian development object B3B4 of the Moskud’inskoye oil field was selected. The active pool of the object, which is at the second stage of development, consists of more than 140 production wells. The main area of the deposit is characterized by a deteriorated energy condition and the formation pressure is below the pressure of oil saturation with gas. The Vereyskian formation is characterized by a significant number of quality investigations using geophysical and hydrodynamic methods and a representative rock samples collection, as well as long experience of acid (21 GTM) and proppant (26 GTM) HF.
The Vereyskian carbonate formation is characterized by a high degree of heterogeneity. The reservoirs, identified according to geophysical well investigations (GWI), are represented by limestones with different PPP ranges. When counting oil reserves the porosity coefficient Kp of Vereyskian reservoirs at the Moskud’inskoye field is estimated on the basis of volumetric hydrogen content W curve determined by the neutron-neutron logging (NNL-t) data with allowance for clay content of rocks and technical conditions of measurements in the well. The boundary limit values Kp of reservoirs in B3B4 formation were determined through dynamic porosity of 7 %. When identifying reservoirs, interlayers characterised by Kp less than the set limit values were not included in the effective thicknesses; as a result, potential oil reserves of these intervals are not included in the State balance of reserves of the Russian Federation.
Meanwhile, according to investigations of rock samples, intervals characterized by porosity of less than 7 % according to NNL-t may also contain oil-saturated interlayers, including those less than 0.2 m thick, which is below the sensitivity of GWI methods. The currently used simplified geological and hydrodynamic model of the Vereyskian deposit does not allow identifying the rocks of all lithological varieties participating in fluid filtration, including technologies of permeability anisotropy in interlayers [8, 14].
Methodology
According to [7, 18], the complex carbonate objects of the study area are characterized by connection between well operation and lithofacial heterogeneity of formation, which is reflected in the dynamics of well operation and energy state of the deposit. Fig.1, a shows rock samples of Vereyskian sediments in ultraviolet, where grey-brown colour indicates oil-saturated areas and violet indicates absence of oil occurrences. Based on the rock sample analysis in the geological section, four lithotypes of carbonate rocks, distinguished by structural features and PPP, can be distinguished.
Lithotype 1 is represented by highly porous carbonates characterized by intense saturation throughout the entire sample volume (Fig.1). Intervals of the geophysical section for this lithotype according to GWI are characterized by Kp > 20 %. Lithotype 2 is characterized by alternation of thin (3-10 cm each) interlayers of highly porous reservoirs and dense rocks (Fig.1). According to GWI, these rocks are also classified as reservoirs and are included in the State balance of the Russian Federation. Due to insufficient instrumentation resolution, lithotype 2 intervals are interpreted by GWI as homogeneous low-porosity reservoirs with Kp of around 12 %.
Rock intervals with lithotypes 3 and 4 are interpreted by GWI as non-collectors. However, low-porosity intervals in lithotype 3 contain oil occurrences (Fig.1) that, if actively exploited, can be included in the oil production process. In dense carbonates (lithotype 4), oil occurrences are completely absent (Fig.1).
In order to assess the porous space of rocks the tomographic investigations were carried out (Fig.1, b), in which the darkest areas correspond to substances with the highest X-ray density, and white – with the lowest. The method of X-ray tomography allows visualizing the structure of the porous space in the sample and the distribution of cavities by size [5, 24, 27].
Initially, tomographic investigations were carried out on a full-size rock sample (100 mm) to determine the type of reservoir and estimate the proportion of large pores, fractures and caverns in the rock. Samples for different lithotypes were tomographed individually and in pairs, the pore space was binarised in individual 1×1×1 cm sections and the porous space visible on the tomograms was measured with a lucidity of 0.2 mm or more.
The highly porous reservoir (lithotype 1) is characterized by an unevenly distributed cavernosity. The Kp seen in the tomograms was about 5 %. For lithotype 2, the porosity is distributed unevenly, there are layers of different density, for different areas Kp is from 1 to 3 %. The rock sample from the interval with GWI-estimated porosity below the boundary values of the reservoirs (lithotype 3) is represented by a dense sample. Within lithotype 3, there are areas of reduced density that can be interpreted as zones of decompaction, possibly fracturing. The rock sample for lithotype 4 is represented by dense rock with no evidence of decompaction. In general, for lithotypes 3 and 4, the pores are almost indistinguishable on full-size unextracted rock samples due to the low resolution of the tomography method.
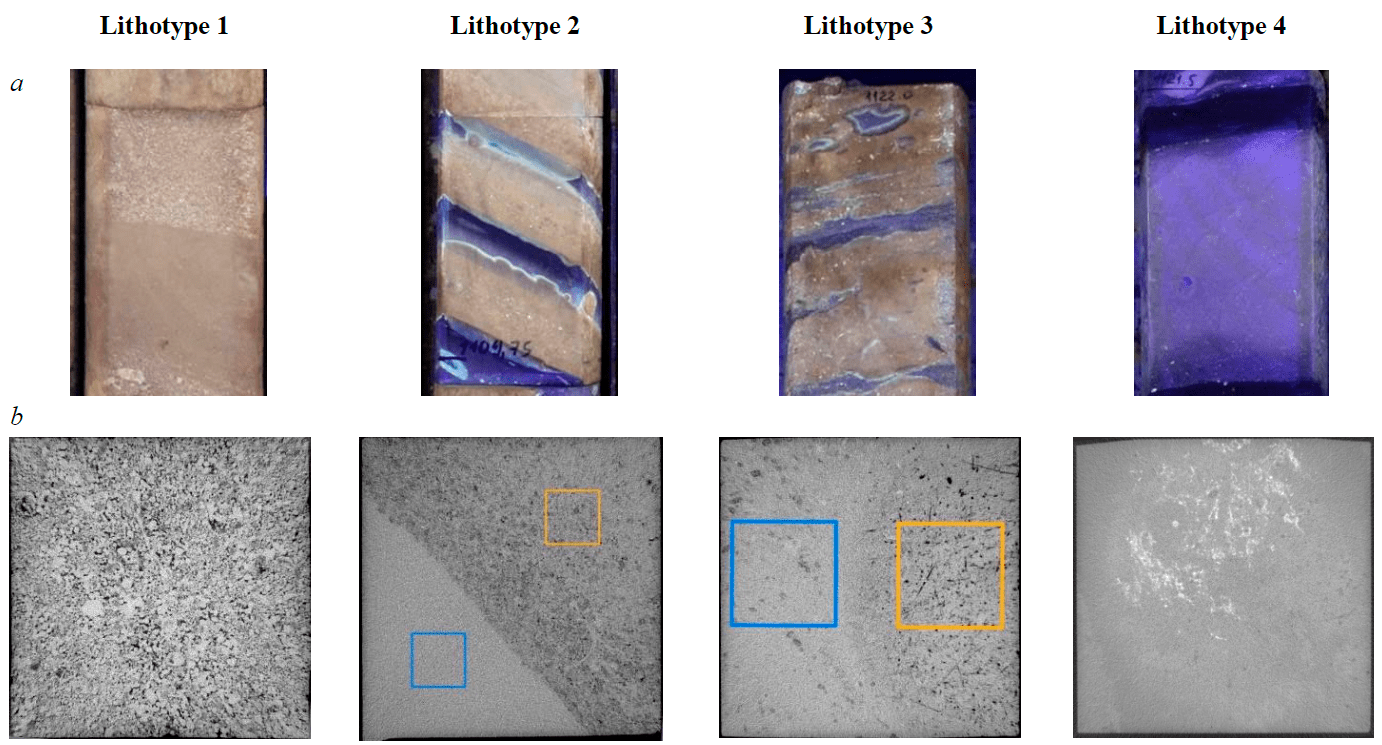
Fig.1. Rock samples of different lithotypes on UV photos (a) and according to X-ray tomography data (b)
To increase the resolution of the method, smaller samples were made for each of the lithotypes in the form of cubes with sides of 40 mm. A long-term extraction of the samples was carried out, which allowed a more detailed study of their cavity space geometry by tomography, resulting in a model ultimate resolution of 0.065 mm. Fig.1, b shows sections from tomograms in planes parallel to well axis direction for selected lithotypes.
According to tomography, lithotype 1 is composed of porous cavernous organogenic limestone with caverns up to 3 mm in diameter. Estimation of Kp for the tomographically visible part of the porous space (diameter not less than 0.065 mm) was 9.7 %. The ultimate case of impermeable rocks is lithotype 4, composed of dense limestone, for which the Kp according to tomography does not exceed 0.2 %. On tomograms for lithotype 4, inclusions with increased X-ray density are marked in white (Fig.1, b)
Lithotypes 2 and 3 can be considered as intermediate with respect to the development of PPP. For lithotype 2, porous and dense areas are distinguished, the sharp interface between which corresponds to the overlaying surface. The first section is composed of porous cavernous organogenic-detrital limestone (lithotype 2, yellow square), the diameters of large caverns reach 0.6 mm. The porous space in the rock is distributed unevenly; the tomographically visible Kp increases towards the boundary from 1.5 to 3.9 %. The dense type is composed of fine-grained limestone (lithotype 2, blue square) with Kp on tomography less than 0.2 %.
Lithotype 3 also consists of two lithologically heterogeneous parts. The potentially permeable section is composed of limestone permeated by elongated straight needle- and spindle-shaped pores located in the rock in different directions. These elongated pores (lithotype 3, yellow square) can be considered as elements of fracturing, their length reaches 23 mm, and diameter (opening) – 0.6 mm, Kp on tomography was 1.8 %. The dense part is composed of relatively homogeneous limestone (Kp < 0.2 %) with rare isolated areas of decompaction with a diameter of 0.3-1 mm. The dark gray tint on the tomogram allows interpreting these elements exactly as decompaction, but not porous space. The boundary between the sections is rounded and indistinct, which allows considering the rocks with higher PPP as inclusions within a layer of denser limestone.
Thus, in the geological section of the Vereyskian sediments, in addition to productive porous-cavernous and non-productive dense limestones, there are areas with widely developed potential fracturing. Under natural geological conditions, depending on the degree of rock fracturing progression and technological conditions of development, these intervals may or may not participate in the operation of wells. During HF, fractured intervals can be successfully included in oil production.
Construction of a statistical model for natural fracturing of rocks in the Vereyskian object at the Moskud’inskoye field
Based on development experience, the natural fracturing of rocks should form the main trends of HF fractures development, respectively, determining the ultimate effectiveness of PHF. Analysis of the possibilities for interpretation of fractured-type reservoirs in the investigated area shows that the GWI methods do not fully solve the issue of reliable studying the reservoirs fracturing [22]. Methods for interpretation of pressure recovery curves (PRC) are much more informative in solving this problem. In works [8, 12, 17] a comparison for applicability of various methods for PRC processing with determination of parameters for carbonate reservoir fracturing was carried out. As a result, conclusions were made that the methods of PRC processing based on Warren – Ruth model are the most reliable for solving this problem. A reservoir is interpreted as fractured if there are two parallel lines on the PRC and a characteristic bend between them [9]. Based on the analysis of hydrodynamic investigations (HDI) of wells by the PRC method, the fracturing of the B3B4 object of the Moskud’inskoye field was studied.
Works [28, 31, 36] consider theoretical issues about the influence of fracturing and, in a broader sense, microstructural features of rocks on development processes; the mechanisms of stress loading influence on fluid filtration in rock masses are shown. Namely, when formation and bottomhole pressures decrease in the process of development, the opening of natural fractures is reduced, or their complete closure is observed. Work [21] establishes reduction of fracture opening up to 70 % at formation pressure decrease by 20 % from the initial one for wells operating fractured reservoirs. In [15] there are examples of interpretation for reservoir operation in the well as a fractured one in the initial period of development, which is confirmed by a characteristic view of PRC with distinguishing of a bending point and two parallel lines. After a certain period of well operation, the pressure recovery rate became gradually fading, indicating that the fractures were closing.
Thus, development design must take into account the processes of probable reduction in current fracturing as the energy state of the formation deteriorates. Consideration of formation zones with decreased formation pressure in well investigations leads to distortion of information about initial rock fracturing. Therefore, wells for which HDI was conducted at late stages of operation when the current well production was characterized by significant water cut were excluded from the analysis. This resulted in a training sample of 36 wells, 18 of which were defined as fractured and the other 18 as pore-type reservoirs by the PRC data.
The reservoir type determination by the PRC for all wells was taken as the most reliable. In addition, reservoir type (porous or fractured) can be estimated by indirect indicators of well dynamics over time (oil and fluid flow rates, water cut) and by considering oil formation characteristics (thickness, PPP, etc.). In contrast to the results of conditioned PRC in the initial period of development, this information is available practically for all wells, operating B3B4 object. Therefore, its consideration together with the PRC results significantly increases the reliability of the final forecast decisions.
For all wells of the training sample, the following parameters were known: absolute top level of B3B4 formation Ht , total thickness of B3B4 formation Hf, oil-saturated thickness hs, porosity coefficient by GWI Kp , initial oil flow rate after putting the well into operation Qn0, initial water cut W0. Taking into account the fact that in some cases the well is put into permanent operation for a long period of time, the initial flow rate was calculated for the well after half a year of operation after its commissioning. Information from the sixth to twelfth months of well operation was also analyzed to characterize the dynamics of development indicators. The oil flow rate and water cut coefficients were calculated, respectively:
where i – number of the month for well operation.
The objective was to derive a statistical multivariate model to determine the type of reservoir in the wells without carrying out PRC investigations, based on the influence of geological and technological parameters. In this formulation of the problem, various statistical analysis methods can be used. In the recent years, methods based on neural networks [20, 33], decision trees [23, 25], etc. have been widely spread in the oil industry; their application is based on big data analysis. However, with a limited number of training sample objects (less than 50), machine learning algorithms are less effective, as they do not involve control of the physicality for the obtained statistical models. According to the authors, linear discriminant analysis (LDA) is most informative in such conditions, for which a high level of convergence for prediction results with actual data is confirmed by works [1, 6, 19]. An important advantage of LDA is the ability to control the physicality of the models constructed by analyzing the directionality of the coefficients (plus or minus) in the constructed linear discriminant functions (LDF). If significant inconsistencies are found, the statistical model can be promptly rebuilt.
At a preliminary stage, an analysis of the differences between pore- and fracture-type reservoirs in terms of the parameters average values was carried out. The results are presented in the table below.
Comparison of pore and fracture reservoir parameters
|
Parameter |
Pore |
Fractured |
Student's difference t-test |
Differences p |
|
Ht, m |
−907.2 ± 4.8 |
−910.9 ± 5.1 |
2.22 |
0.03 |
|
Hf, m |
16.4 ± 0.6 |
16.3 ± 0.8 |
0.60 |
0.55 |
|
hs, m |
4.7 ± 1.0 |
4.3 ± 0.9 |
1.36 |
0.18 |
|
Кp, % |
21.6 ± 3.0 |
20.2 ± 2.7 |
1.45 |
0.16 |
|
Qn0, t/day |
7.8 ± 6.2 |
8.8 ± 5.4 |
−0.50 |
0.62 |
|
W0, % |
6.3 ± 3.6 |
8.4 ± 5.8 |
−1.26 |
0.22 |
|
∆Qn12, units |
1.011 ± 0.063 |
0.945 ± 0.085 |
2.64 |
0.01 |
|
∆W12, units |
0.981 ± 0.225 |
1.114 ± 0.358 |
−1.33 |
0.19 |
When compared by Student's t-test the differences for Ht (p = 0.03) and ∆Qn12 (p = 0.01) were statistically significant. Accordingly, it was found that fractured reservoirs are hypsometrically lower than pore reservoirs, oil flow rate for fractured reservoirs, in general, decreases much faster, which is confirmed by lower values of ∆Qn12. For other indicators differences are also established, but with lower levels of significance (see table). Subsequently, the LDA method was implemented to comprehensively account for all indicators. As a result of LDF construction, dividing wells according to the type of reservoir into pore and fractured ones, has the following form:
When the calculated value of Z > 0, the reservoir in the well is porous type, when Z < 0, it is fractured type. As a result for the training sample 89 % of 18 objects of fractured type are correct (Z < 0), 83 % of 18 objects of porous type are correct (Z > 0).
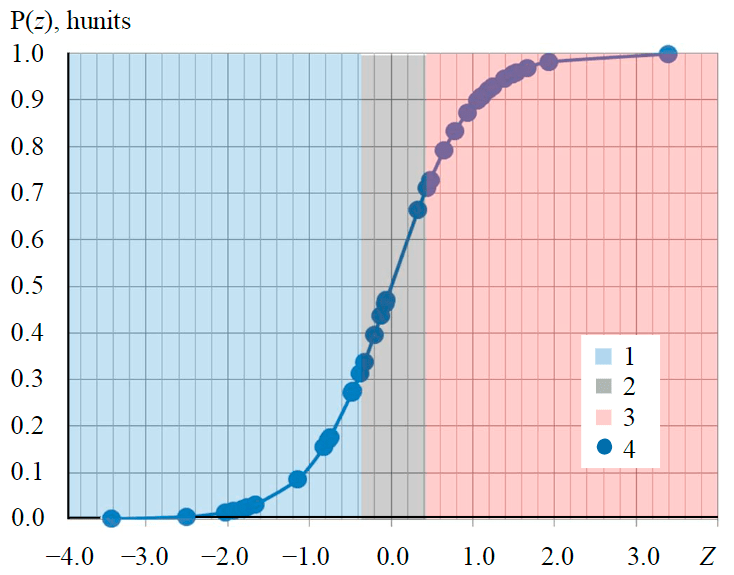
Fig.2. Probability plot of well attribution by LDA to pore and fractured reservoirs 1 – fractured reservoir; 2 – not clear; 3 – pore reservoir; 4 – LDA results for the wells in the training sample
he coefficient values for the parameters in the LDF do not contradict the physical meaning. For example, wells with fracturing established by the PRC are characterized by lower oil-saturated thicknesses and lower porosity by GWI. At the same time, due to fractures effect, more oil flow rate is established for them in the initial period, respectively, with higher water cut of production. During the operation, the rate of oil flow rate drop for wells with fractured reservoir is higher in comparison with the pore type, which is reflected in lower values of the index ∆Qn12.
As the Z criterion increases, the probability P(z) of assigning wells to the pore-type reservoir class grows. The probability of classifying wells as pore- and fracture-type reservoirs is shown in Fig.2.
Accordingly, if P(z) = 1, the LDF reservoir with a probability close to 100 % is interpreted as pore, if P(z) = 0, as frac-tured, and if P(z) = 0.5, the identification to these reservoir types can be regarded as equally probable.
Given the good convergence of prediction results on the objects of the training sample, the predictive model for estimating natural fracturing was applied to the wells of the Moskud’inskoye field with the absence of conditioned PRC investiga-tions. Provided Р(z) > 0.70 (Z > 0.40) a reservoir was estimated as porous, pro-vided Р(z) < 0.30 (Z < −0.40) – as frac-tured, if P(z) is from 0.30 to 0.70 a reservoir type by LDF was considered as uncertain (Fig.2). As a result, the sections for 22 wells were attributed to porous reservoir, for 41 wells – to fractured reservoir, for 12 wells the conclusion about reservoir type by LDF was not clear. Based on the predictive data obtained, a scheme for natural fracturing of the investigated object was constructed, a fragment of which is shown in Fig.3.
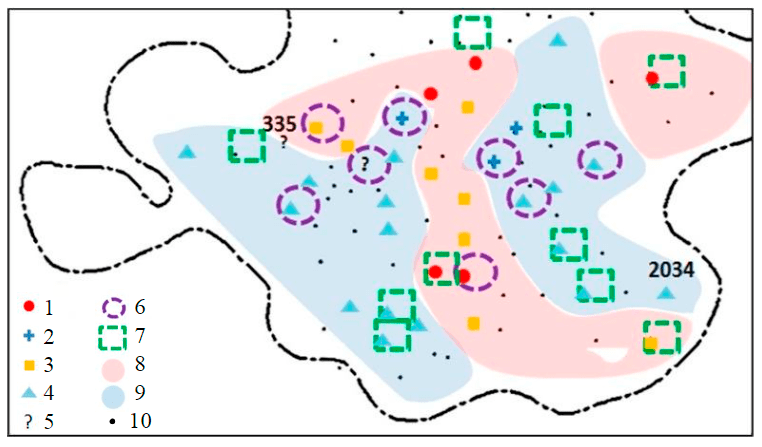
Fig.3. Fragment of the natural fracturing scheme for the southern part of the Vereyskian deposit at the Moskud’inskoye field 1 – pore reservoir according to the Warren-Ruth model; 2 – fractured reser-voir according to the Warren-Ruth model; 3 – pore reservoir according to the statistical model; 4 – fractured reservoir according to the statistical mod-el; 5 – uncertain prediction; 6 – AHF; 7 – PHF; 8 – zone of pore reservoir; 9 – zone of frac-tured reservoir; 10 – well
This scheme shows that sections of porous and fractured reservoirs were identified across the deposit area. The zonal nature of their distribution indirectly confirms the satisfactory results of LDA application in fracturing assessment.
Analysis of the natural fracturing influence on the PHF efficiency
Aqueous based fracturing fluid with a standard polymer loading of 3.0 kg/m3 and a linear gel viscosity of 18.6 to 20.8 mPa∙s (at 21 °C) is used for the PHF in the study area. The time for complete disintegration of the cross-linked gel is 3-6 h. According to laboratory investigations, the recovery degree of conductivity in the proppant pack after gel disintegration exceeds 65 %. In all cases, BORPROP aluminosilicate proppant of 16/20 fraction, which meets the requirements of GOST R51761-2013, was used for PHF. Technological properties of proppant and fracturing fluid in the wells with PHF can be considered constant, which suggests their equal influence on the GTM efficiency. Reliable prediction of injection and fracturing pressures during HF is usually problematic and is performed with a high degree of error. Thus, when analyzing PHF efficiency, the most informative technological parameters are specific proppant yield, with regard to drilled-in oil-saturated thickness, and injected fluid volume.
According to theoretical concepts, the presence of natural fracturing increases the inhomogeneity of reservoir characteristics. The maximum GTM efficiency is ideally achieved when the HF fracture propagates perpendicular to the natural fracture network. However, in the real formation, fractures during HF develop mainly in the direction of maximum horizontal stresses, i.e. parallel to the natural fracturing [2, 4, 32]. This to some extent reduces the potential effect of hydraulic fracturing in fractured reservoirs. At the same time, it should be noted that for the object B3B4 of Moskud’inskoye field there are no investigations by the method of acoustic wave cross-dipole logging VAK-D and microseismic monitoring. Accordingly, control of geometrical parameters of fractures in HF at the object of study by the present time was not conducted.
To assess the comparative effectiveness of PHF in porous and fractured reservoirs, a statistical comparison of geological and technological development indicators was made. As a result, no significant differences in average initial oil flow rate increases after PHF were found, initial increase ∆Qn0 in both cases averages around 8 t/day. However, while the oil flow rate for pore-type reservoirs is stable and, after 40 months, ∆Qn40 is also close to 8 t/day, it decreases to 5 t/day for fractured reservoirs during the same period. Figure 4 shows the dynamics of average fluid productivity coefficients Kprod for various reservoir types after PHF. For fractured areas, with slightly higher initial values (27.1 vs. 19.4 m3/day∙MPa), there is a sharp decline in Kprod in the first five months after PHF. As a result, after 40 months, Kprod for pore-type reservoirs is more than twice the value for fractured areas (15.0 vs. 6.2 m3/day∙MPa).
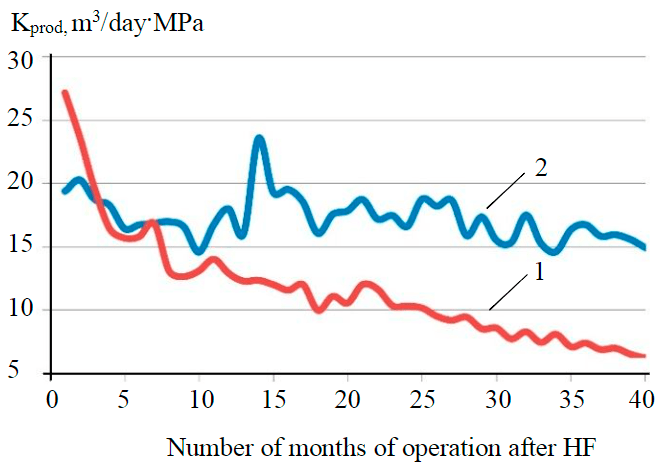
Fig.4. Dynamics of fluid productivity coefficient after PHF in porous and fractured reservoirs 1 – porous; 2 – fractured
Thus, when implementing LDA, the following geological and technological parameters most affecting the efficiency PHF were used: reservoir type T (1 – for porous type; 2 – for fractured type; 1.5 – for uncertain assessment); formation pressure before PHF Pf0 = 3.29-9.88 MPa; skin effect before PHF S0 = −5.8-6.0 units; permeability coefficient of remote-bottomhole zone (RBHZ) before PHF krbhz = 0.0124-0.4502 μm2; fluid yield during PHF qw = 3.5-4.0 m3/min; specific proppant yield per one meter of drilled-in oil-saturated thickness m/hs = 6.3-11.5 t/m; total injected volume of fracturing fluid Vfr = 123.1-175.9 m3.
The result is an LDF of the following form:
at R = 0.74.
As the Z criterion decreases, the probability P(z) of classifying the well PHF as successful increases. At a calculated value of Z < −0.3, P(z) exceeds 0.70 and the action can be recommended for implementation. With a calculated value of Z > 0.5 P(z) < 0.30, the prognosis for the well PHF efficiency is negative. With Z between −0.3 and 0.5, it is difficult to make a definite prediction about the PHF success.
The analysis shows that, in addition to natural fracturing, the following have the greatest influence on LDA classification results: specific proppant yield, formation pressure, RBHZ permeability and skin effect before HF. The coefficient signs (plus or minus) for all parameters in the LDF correspond to their physical meaning. In pore reservoirs, PHF efficiency is higher because of potentially greater connection of previously undrained interlayers. Higher formation pressure and permeability values increase potential gains in oil flow rate after the measure. PHF creates a highly conductive channel between the well and the RBHZ, reducing the effect of near-bottomhole zone bridging, resulting in additional flow rate gains after GTM in wells with high skin effect.
Increasing the specific proppant yield increases flow rates by fixing not only to the immediate reservoir zone, but also to more distant areas. In turn, increases in fracturing fluid yield and injected fluid volume can have a negative impact on GTM efficiency by increasing the likelihood of intense HF vertical fracture development outside the reservoir section with fracturing of reservoir clay interstices.
A number of LDF parameters characterizes current geological and technological well conditions (Т, Рfr0, S0, krbhz), it is problematic to change them just before GTM implementation. By organizing injection, it is possible to change formation pressure on the deposit section relatively quickly. Parameters qw, m/hs, Vfr determine the PHF design and as a result − technological efficiency. At the same time, complication of HF design considerably affects its cost, reducing economic indicators of the project.
The derived LDF was applied for prediction of PHF efficiency for wells 335 (western zone, Fig.3), 2144 (eastern part of deposit) and 2034 (eastern zone, Fig.3) of Moskud’inskoye field. For the considered wells, due to their technological features and low fracturing fluid efficiency (average 26 %), fracturing fluid yield in calculations was taken as 3.8 m3/min.
Well 335 at the current Рf0 = 5.8 MPa is characterized by a high skin effect (S0 = 2.6), and therefore the PHF is predicted to be successful with a sufficiently low specific proppant yield (m/hs not less than 6.4 t/m) and volume of fracturing fluid (Vfr not more than 155 m3).
Well 2144 is located in an area with increased formation energy (Рf0 = 8.3 MPa), due to which PHF is predicted to be successful with m/hs not less than 7.0 t/m and Vfr not more than 150 m3. In both cases low proppant yield and small volume of fracturing fluid significantly reduces the GTM cost, which makes PHF at these wells a priority under current conditions.
For well 2034, the most critical is a low current Рf0 of 5.1 MPa. In this case, according to the developed model, proppant yield of more than 11.5 t/m is required for a fracture fluid volume of about 290 m3. Such high values of m/hs and Vfr are ultimate for PHF, leading to additional material costs disproportionate to GTM efficiency enhancement. Taking this into account, when planning PHF at the well, it is feasible to make injection point, increasing Pf0 up to 8 MPa, after which the recommended value m/hs will be reduced to acceptable 9 tons/m, and Vfr – down to 200 m3. In general, the PHF at well 2034 is assessed as high-cost with ambiguous assessment of cost efficiency.
Conclusion
The results of conducted investigations showed a complex structure of clay-carbonate Kashiro-Vereyskian sediments, with four different lithotypes of carbonate rocks being distinguished. The presence of oil-saturated intervals in the geological section, unaccounted for in the State balance of the Russian Federation, which can be added to the oil production process, was established.
As a result of the conducted statistical analysis for the object B3B4 of Moskud’inskoye field, the scheme for natural fracturing of rocks, which affects the PHF efficiency, was constructed. Formation pressure, permeability of remote-bottomhole zone, skin effect and specific proppant yield also have a determining influence on the efficiency. Taking this into account the multidimensional statistical model of predicting the PHF efficiency was developed. Based on this model, the wells of Moskud’inskoye field that are promising for this technology were selected and the optimal design of the PHF was suggested.
References
- Shakhverdiev A.Kh., Shestopalov Yu.V., Mandrik I.E., Arefiev S.V. Alternative concept of monitoring and optimization water flooding of oil reservoirs in the conditions of instability of the displacement front. Oil Industry. 2019. N 12, p. 118-123. DOI: 10.24887/0028-2448-2019-12-118-123 (in Russian).
- Kashnikov Yu.A., Shustov D.V., Kukhtinskii A.E., Kondratiev S.A. Geomechanical properties of the terrigenous reservoirs in the oil fields of Western Ural. Oil Industry. 2017. N 4, p. 32-35. DOI: 10.24887/0028-2448-2017-4-32-35 (in Russian).
- Salimov V.G., Ibragimov N.G., Nasybullin A.V., Salimov O.V. Hydraulic fracturing of carbonate formations. Moscow: Neftyanoe khozyaystvo, 2013. 472 p. (in Russian).
- Zenchenko E.V., Trimonova M.A., Turuntaev S.B. Laboratory modeling of hydraulic fracturing and related processes. Oil Industry. 2019. N 10, p. 68-71. DOI: 10.24887/0028-2448-2019-10-68-71 (in Russian).
- Efimov A.A., Savitskii Ia.V., Galkin S.V., Soboleva E.V., Gurbanov V.Sh. Study of wettability of reservoirs of oil fields by the method of X-ray tomography core. Neftegaz GNKAR. 2016. N. 4, p. 55-63. DOI: 10.5510/OGP20160400298 (in Russian).
- Kochnev A.A., Zotikov V.I., Galkin S.V. Analysis of The Influence Of Geological Technological Parameters on The Effectiveness of Radial Drilling Technology on The Example of Operational Objects in Perm Region. Bulletin of the Tomsk Polytechnic University. Geo Аssets Engineering. 2018. Vol. 329. N 12, p. 20-29. DOI: 10.18799/24131830/2018/12/16 (in Russian).
- Lyadova N.A., Demchenko V.A. Waterflooding Efficiency Evaluation on Tournasian-Famennian Deposit of Magovskoye Field. Perm Journal of Petroleum and Mining Engineering. 2020. Vol. 20. N 3, р. 242-252. DOI: 10.15593/2712-8008/2020.3.5
- Martyushev D.A. Improving the geological and hydrodynamic model of a carbonate oil object by taking into account the permeability anisotropy parameter. Journal of Mining Institute. 2020. Vol. 243, p. 313-318. DOI: 10.31897/PMI.2020.3.313
- Martyushev D.A. Comparative Analysis of Warren – Ruth and Pollard Methods on the Example of Deposits Located in the North of Solikamsk Depression. Geology, Geophysics аnd Development of Oil and Gas Fields. 2016. N 9, p. 60-63 (in Russian).
- Elsukov A.V., Shipilov A.I., Krutikhin E.V. et al. Polymer-free viscosity controlling agent (viscoelastic surfactant) for acid-proppant fracturing. Oilfield Engineering. 2019. N 10 (610), p. 18-23. DOI: 10.30713/0207-2351-2019-10(610)-18-23 (in Russian).
- Novokreshchennykh D.V., Raspopov A.V. Trends in Improving Hydraulic Fracturing Efficiency in Carbonate Deposits at Komi Republic and Nenets Autonomous District Fields. Perm Journal of Petroleum and Mining Engineering. 2020. Vol. 20. N 2, p. 175-181. DOI: 10.15593/2224-9923/2020.2.7
- Cherepanov S.S., Ponomareva I.N., Erofeev A.A., Galkin S.V. Determination of fractured rock parameters based on a comprehensive analysis of the data core studies, hydrodynamic and geophysical well tests. Oil Industry. 2014. N 2, p. 94-96 (in Russian).
- Kondratyev S.A., Zhukovsky A.A., Kochneva T.S., Malysheva V.L. Some experience of the formation proppant fracturine in carbonate reservoirs of perm region deposits. Oilfield Engineering. 2016. N 6, p. 23-26 (in Russian).
- Yermekov R.I., Merkulov V.P., Chernova O.S., Korovin M.O. Features of permeability anisotropy accounting in the hydrodynamic model. Journal of Mining Institute. 2020. Vol. 243, p. 299-304. DOI: 10.31897/PMI.2020.3.299
- Mordvinov V.A., Martiushev D.A., Ladeishchikova T.S., Gorlanov N.P. Estimation of Effects of Natural Reservoir Fracturing on Producing Well Performance. Perm Journal of Petroleum and Mining Engineering. 2015. Vol. 14. N 14, p. 32-38. DOI: 10.15593/2224-9923/2015.14.4 (in Russian).
- Parfenov A.N., Letichevskiy A.E., Nikitin A.N. et al. Prospects of combined proppant-acid hydraulic fracturing in Samaraneftegas JSC. Oil Industry. 2015. N 11, p. 52-55 (in Russian).
- Ponomareva I.N., Martyushev D.A. Estimating reliability of reservoir properties determination on the basis of production analysis and pressure stabilization curve. Oil Industry. 2019. N 8, p. 111-113. DOI: 10.24887/0028-2448-2019-8-111-113 (in Russian).
- Putilov I.S., Ladeyshchikov S.V., Vinokurova E.E. Integrated Forecast of Facies of Tournaisian Carbonate Deposits in the Fields of Verkhnekamsk Depression, Being Developed, Based оn 3d Seismic Survey Data. Geology, Geophysics аnd Development of Oil and Gas Fields. 2017. N 4, p. 21-25.
- Putilov I.S., Pyatunina E.V. Forecast Procedure Based оn Step-By-Step Linear Discriminant Analysis and Geostatistical Modeling to Study Deposits’ Efficient Thicknesses of Visean Terrigenous Formations. Geology, Geophysics аnd Development of Oil and Gas Fields. 2012. N 1, p. 29-32.
- Redikultsev S.A., Liplyanin A.V., Paliy A.O. Using the neural network method for predicting the parameters of well operation after hydraulic fracturing. Roceedings of Gubkin Russian State University of Oil and Gas. 2010. N 1 (258), p. 33-37 (in Russian).
- Tcherepanov V.V., Matyushev D.A., Ponomareva I.N. Evaluation of filtration-capacitive properties of fractured carbonate reservoir of Preduralskogo edge deflection. Oil Industry. 2013. N 3, p. 62-65 (in Russian).
- Shumilov A.V. Analysis of the Existing and Development of New Software Packages for Processing and Interpreting of Geophysical Well Logging Data. Perm Journal of Petroleum and Mining Engineering. 2019. Vol. 19. N 2, p. 162-174. DOI: 10.15593/2224-9923/2019.2.6
- Aulia A., Jeong D., Saaid I.M. et al. A random forests-based sensitivity analysis framework for assisted history matching. Journal of Petroleum Science and Engineering. 2019. Vol. 181. DOI: 10.1016/j.petrol.2019.106237
- Mahanta B., Vishal V., Ranjith P.G., Singh T.N. An insight into pore-network models of high-temperature heat-treated sandstones using computed tomography. Journal of Natural Gas Science and Engineering. 2020. Vol. 77. N 1032274. DOI: 10.1016/j.jngse.2020.103227
- Zhi Chai, Nwachukwu A., Zagayevskiy Y. et al. An integrated closed-loop solution to assisted history matching and field optimization with machine learning techniques. Journal of Petroleum Science and Engineering. 2021. Vol. 198. N 108204. DOI: 10.1016/j.petrol.2020.108204
- Suleimenova A., Wang X., Zhu D., Hill A.D. Comparative Study of Acid Fracturing and Propped Hydraulic Fracturing for a Tight Carbonate Formation. SPE Europec featured at 78th EAGE Conference and Exhibition held, 30 May – 2 June 2016, Vienna, Austria. OnePetro, 2016. SPE-180114-MS. DOI: 10.2118/180114-MS
- Efimov A.A., Galkin S.V., Savitsky Y.V., Galkin V.I. Estimation of heterogeneity of Oil & Gas field carbonate reservoirs by means of computer simulation of Core X-Ray Tomography data. Ecology, Environment and Conservation. 2015. Vol. 21, p. 79-85.
- Yu H., Ng K., Grana D., Kaszuba J., Alvarado V., Campbell E. Experimental investigation of the effect of compliant pores on reservoir rocks under hydrostatic and triaxial compression stress states. Canadian Geotechnical Journal. 2019. Vol. 56. N 7, p. 983-991. DOI: 10.1139/cgj-2018-0133
- Kolawole O., Ispas I. Interaction between hydraulic fractures and natural fractures: Current status and prospective directions Journal of Petroleum Exploration and Production Technology. 2020. Vol. 10. Iss. 4, p. 1613-1634. DOI: 10.1007/s13202-019-00778-3.
- Zhang J., Kamenov A., Zhu D., Hill A.D. Laboratory Measurement of Hydraulic-Fracture Conductivities in the Barnett Shale. SPE Hydraulic Fracturing Technology Conference, 4-6 February 2013, The Woodlands, Texas, USA. OnePetro, 2013. SPE-163839-PA. DOI: 10.2118/163839-MS
- Pimienta L., Quintal B., Caspari E. Hydro-mechanical coupling in porous rocks: Hidden dependences to the microstructure? Geophysical Journal International. 2021. Vol. 224. Iss. 2, p. 973-984. DOI: 10.1093/gji/ggaa497
- Taleghani A.D., Olson J.E. How natural fractures could affect hydraulic-fracture geometry. SPE Journal. 2014. Vol. 19. Iss. 1, p. 161-171. DOI: 10.2118/167608-PA
- Turgay E., Qian S. Artificial Intelligence Applications in Reservoir Engineering: A Status Check. Energies. 2019. Vol. 12. Iss. 15. N 2897. DOI: 10.3390/en12152897
- Ugursal A., Zhu D., Hill A.D. Development of Acid Fracturing Model for Naturally Fractured Reservoirs. SPE Production & Operations. 2019. Vol. 34. Iss. 4, p. 735-748. DOI: 10.2118/189834-PA
- Vincent M.C. The next opportunity to improve hydraulic fracture stimulation. Journal of Petroleum Technology. 2012. Vol. 64. Iss. 3, p. 118-127. DOI: 10.2118/144702-JPT
- Zhang L., Ba J., Carcione J.M. A rock-physics model to determine the pore microstructure of cracked porous rocks. Geophysical Journal International. 2020. Vol. 223. Iss. 1, p. 622-631. DOI: 10.1093/gji/ggaa327