Cadastral valuation of forest lands, taking into account the degree of development of their infrastructure

Abstract
The article substantiates the need to improve methodology for cadastral valuation of forest lands and change the principles for calculating the rental rate of forest lands, on the basis of which the rent for the use of these lands will be determined in future. The methodology for determining the cadastral value of forest lands, taking into account the degree of development of their infrastructure, is presented. The infrastructure of lands of the forest fund is considered and an algorithm for assessing such infrastructure by means of geoinformation modeling is shown. A method for calculating a complex integral indicator (coefficient of infrastructure development) is presented, which is applicable to differentiate lands covered and not covered with tree vegetation, for their effective and rational management. The complex integral indicator determines the availability of forest plots, as it takes into account location of the forest fund infrastructure in relation to assessment plots, which makes it possible to obtain information about the time spent on covering the required distance. This methodology can be applied to assess the quality and condition of the existing infrastructure of the forestry sector in implementation of measures within the framework of the Strategy for the development of the forestry complex, providing for support and construction of infrastructure facilities on the forest fund lands. The method was tested in the Baltiysky district forestry of the Baltiysko-Belozersky taiga region. The results were as follows: the map of the forest fund infrastructure development within the boundaries of differentiation assessment according to the calculated integral indicator of infrastructure development was obtained; the regression model for calculating the rent rate taking into account the taxation value and integral indicator infrastructure development was received: the cadastral value of forest lands taking into account the developed model was calculated.
None
Introduction
Conservation and efficient use of forests are among the priority directions of development of the Russian Federation in accordance with the approved principles of state policy in the field of use, preservation, protection and reproduction of forests for the period up to 2030 [18]. The Russian Federation is the largest forest state in the world, accounting for a quarter of the world forest cover [17]. Currently, the state pays special attention to preservation, protection and rational use of forest lands. Forests are a multifunctional resource and represent a planetary phenomenon: they participate in the processes of oxygen and carbon dioxide circulation, they are a filter for cleaning the atmosphere from gaseous pollutants and solid dust particles, they are an important component of the biosphere, ensuring its sustainable functioning. Recently, all over the world, the ecological function of forests is of great importance. In order to support the formation of the national carbon balance and preserve forests, on behalf of the President of the Russian Federation V.V.Putin, a large-scale reform is being carried out in the field of forestry, which includes increasing the value of forests, developing forest infrastructure, taking measures to decriminalize the industry, since the data of the state the forest register are the basis for tracking the dynamics of the carbon balance in the forests of the federal districts of the Russian Federation. According to the reform the measures of state regulation in the field of forest conservation and protection the following the results of the reform were: creation of a unified federal state information system of the forestry complex to track the path of timber – harvesting, transportation, production and export of products; maintenance of the state forest register in electronic form, registration of accompanying documentation for timber and wood processing products, certifying the legality of timber harvesting and production of products. In addition, in order to preserve the carbon balance, the Strategy for the Long-Term Development of the Russian Federation with a Low Level of Greenhouse Gas Emissions until 2050 was developed, which contains a number of scenarios for maintaining the carbon balance: large-scale implementation of energy and resource-saving technologies in all sectors of the economy, drastic reduction in energy losses; significant reduction or complete rejection of clearcuts; increased energy efficiency through the introduction of the best available technologies and energy upgrades [26]. Improved wood felling practices are aimed at countering global deforestation caused by international timber trade. Due to the fact that the demand for timber products is growing every year, it is possible to slow down the rate of deforestation by strengthening the financial responsibility of producers and consumers, strengthening measures for the protection of forests, their effective and rational management [44, 49].
Despite the reform in the management of the forestry sector, the issues of valuation of a forest area, as well as the choice of the necessary approaches and methods for obtaining an objective value, remain unresolved. The indicator of effective and rational management of forest lands is the cadastral assessment [22, 46]. However, the existing methods of cadastral valuation of forest lands are general, i.e. do not take into account the individual characteristics of forest areas [1]. Under the current conditions, the state cadastral valuation of forest lands is not based on market data (auctions for the sale of forest plantations and lease of forest plots), the existing forest infrastructure, which is the main tool for the development, exploitation and effective use of forest areas, is not taken into account [16, 19]. This problem should be resolved not only at the economic level, but also at the legislative level, since improvements on forest lands at the expense of tenants' own funds and market prices for finished wood products are not taken into account in the cadastral valuation. The location of the plots relative to the transport infrastructure objects to a greater extent affects the amount of forest rent [5, 11, 27]. The methodology for assessing forest lands, based on the calculation of the specific indicator of cadastral value [16], which is currently used by appraisal organizations, is simplified and is of a recommendatory nature for the choice of approaches and methods of assessment, it takes into account only the main forest-forming species, but the composition of the species in the allotments boundaries, as a rule, differ. In addition, to assess the territory, too large territorial units are used – regional, district forestry, and not a forest quarter or allotment. The disadvantage of this technique is also that the costs of harvesting timber, transportation and sale of products on the market are not taken into account, also through the received forest rent. As a result, the specific indicators of the cadastral value for district forestries are underestimated, respectively, they are underestimated for forest areas. The methodology for assessing forests [15] does not contain specific mathematical formulas for determining the value of forests, the rest of the methodological normative legal acts have been canceled [13]. The improvement of the methodology for cadastral valuation of forest lands should take into account modern changes in the forest sector of the economy.
The main criteria for the availability of forest resources are the degree of forest infrastructure development and the distance from timber harvesting sites to transit routes [10, 30, 38]. In the constituent entities of the Russian Federation, the degree of development of forest infrastructure, which includes forest roads, fire reservoirs, bridges, hydraulic structures for drainage of the territory and other objects, is very low, despite the fact that it is necessary to ensure rational use, preservation, protection from fires and cutting, preventing waterlogging, reproduction of the country forests, etc. [8, 32, 45]. The costs of timber harvesting, construction of timber roads and removal of harvested products affect the final cost of forest products [5, 11, 31]. The rental rates [14], on which the rent for the use of forest land is based, are made up of the volume of harvested timber, taking into account the prevailing species and the distance of haulage with a recommended scale of the tax category, are low, other infrastructure of the forest fund, including the location of wood processing enterprises, points of collection and sale of products (upper and lower warehouses), is not taken into account. In addition, the type of road surface and the estimated speed of movement on a particular road type are not taken into account.
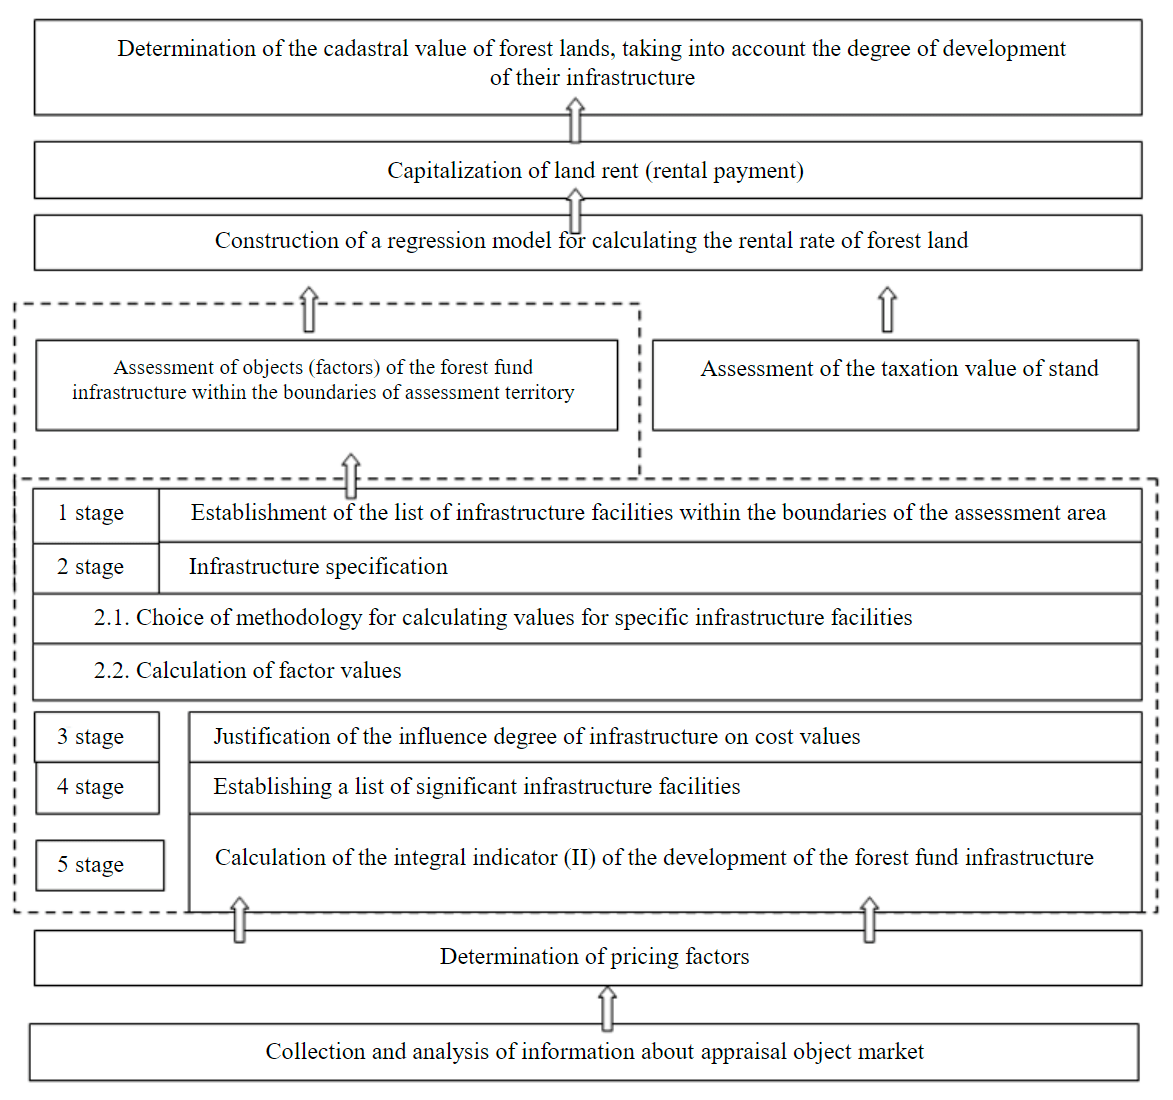
Fig.1. Methodology for determining the cadastral valuation of forest lands, taking into account the degree of development of their infrastructure
In order to carry out the activities determined by the strategy for the forestry complex development, in the absence of an objective methodology for forest valuation based on market data, an improved methodology for the cadastral valuation of forest lands, taking into account the degree of infrastructure development, is proposed, which is recommended for the valuation of forest resources used for various purposes, including differentiation of forest lands according to the degree of development of their infrastructure.
Methodology
The methodology for determining the cadastral value of forest lands, taking into account the degree of infrastructure development, is shown in Fig.1. At the first stage of the appraisal, market data on the appraisal objects was collected, as well as data on the forest fund infrastructure within the appraisal area.
Assessment of objects (factors) of the forest fund infrastructure. To assess the infrastructure of the forest fund, geoinformation modeling tools were used, location of the timber industry enterprise was determined using geocoding [3, 12, 41]. From the previously developed classification of the infrastructure of the forest fund lands [39], data on infrastructure objects were collected and presented in the form of geoinformation layers: forest warehouses (upper and lower), timber and forestry roads, highways, water bodies (rivers, lakes, inland waterway), forest offices, logging enterprises – objects that can potentially affect the value of a forest area.Within the boundaries of the territory, in order to assess the infrastructure, all existing objects (factors) are pricing at the initial stage, therefore, all objects are evaluated. Also, in order to take into account the influence of the factor “Proximity to settlements” on the amount of rent, the location of settlements in relation to the forest fund assessment sites was taken into account. The algorithm for assessing the infrastructure of the forest fund when modeling the rent and calculating the cadastral value of the forest area is shown in Fig.1.
The stage of collecting data on infrastructure facilities within the boundaries of the assessment involves the study of cartographic materials of the forest fund territory and other documents, including forestry regulations, forestry plan, etc., containing information about the infrastructure of the forest fund, as well as submitting this information in geoinformation (spatial) form for work in GIS-programs [3]. Approbation of the developed methodology for assessing the infrastructure of the forest fund was carried out on the example of the Baltic district forestry of the North-West district forestry of the Leningrad region. The Baltic forestry is located in the Vyborg district of the Leningrad region, the total area of the forestry is 15663 hectares. Baltic district forestry is located in a zone of strong forest pathological threat, in contrast to all other zonal forestries of this district forestry.
Infrastructure specification is a stage that implies the choice of a technology for assessing a particular infrastructure object (factor), a method for calculating a value that characterizes an infrastructure object: building isochrones, creating graphs, assessing the density of the road network, building buffer zones, etc.
The engineering infrastructure supporting forestry must have a rational logistic chain [42, 43]. To assess transport availability, the time spent on overcoming the required path is taken into account [34]. Therefore, at the stage of infrastructure specification of such objects as centers of settlements, timber industry enterprises, forestry offices, upper and lower warehouses, the availability of each assessment site must be taken into account.
Network analysis was carried out to represent the factors of accessibility of forest infrastructure facilities. The most common way to analyze networks of availability of objects is to build isochrones (Fig.2).
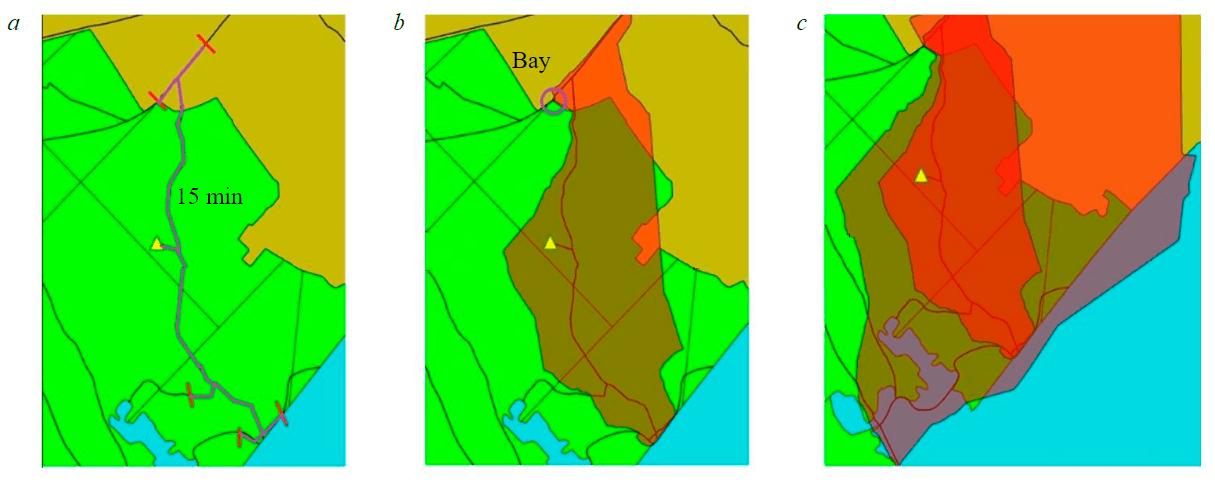
Fig.2. Algorithm for constructing isochrones on the example of a timber industry enterprise a – points are measured; b – dots are marked; c – points are connected to a polygon
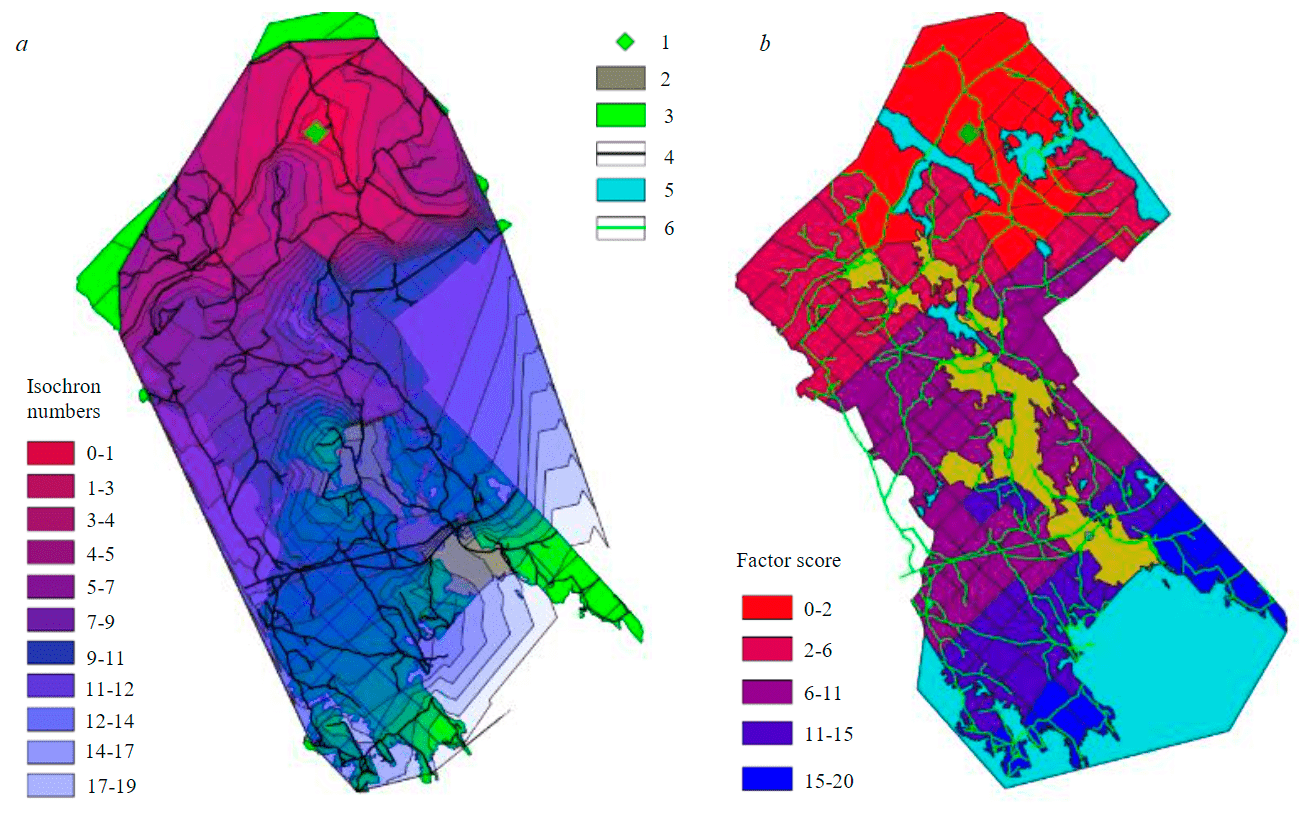
Fig.3. Construction of isochrones using the example of a forestry office (a), graded design of forest quarters according to accessibility to the forestry office (b) 1 – forest office; 2 – settlements; 3 – land plots; 4 – road network; 5 – water bodies; 6 – road network
The procedure for building isochrones is as follows:
- Using the Networks tool, a road network graph is created, then the road network layer is divided into the simplest primitives: individual nodes and segments connecting them. The sections indicate the direction of movement and the speed of movement along this primitive. The speed of movement was taken into account in accordance with the type of road surface (for a forestry road – 30, for a timber road – 50, for an unpaved country road – 40, automobile – 70 km/h).
- To construct isochrones, control points are selected for each layer under consideration. For an office and a timber industry enterprise, one point for each layer, for settlements, upper and lower warehouses – an array of points should be taken.
- With the help of GRASS tools, the distance from the control points along the road graph is plotted (Fig.2, a), which the vehicle travels in the allotted time.
- The specified time is used as an interval step. Points are marked along the deferred distance in each direction along the graph (Fig.2, b), subsequently connected into a polygon, which is one isochron (Fig.2, c).
- Subtraction of geometry was carried out: the overlying one was subtracted from the underlying isochron, separate polygons of isochrones in the form of a vector containing information on the time spent on overcoming space were the result [33, 35].
- Quarters are assigned an isochron value for each factor separately (for example, isochrones from the forest office to the polygon of the stand) according to the following rule: if the site crosses several isochrones, the best value is taken, since it reflects the availability of infrastructure facilities, which eliminates the need to calculate the weight mean value.
- If the geometry of the polygons of the selections is completely entered into the isochron, the corresponding value is assigned to it. The results of constructing isochrones are shown in Fig.3.
The economic activity of tenants of forest plots is favorably influenced by the density of internal road network, for example, for the operation of logging equipment, therefore it is important to take into account the quality of the road surface, as well as its total length. Therefore, at the stage of specification of the infrastructure assessment algorithm, it was decided to determine the density of the road network, the total length of roads was determined for each quarter, and differentiation by type was carried out [37]. The entire territory of the forestry is covered with a regular grid of 1000´1000 m [20], in each cell the density of roads was calculated by summing the length of the network included in the boundaries of the cell under consideration (Fig.4, a).
To substantiate dimension of the geometric grid, it is necessary to calculate the dimensions of the sides of a typical land plot of the forest fund. A typical forest block has the shape of a square. To determine the typical site for each of them, the configuration factor was calculated
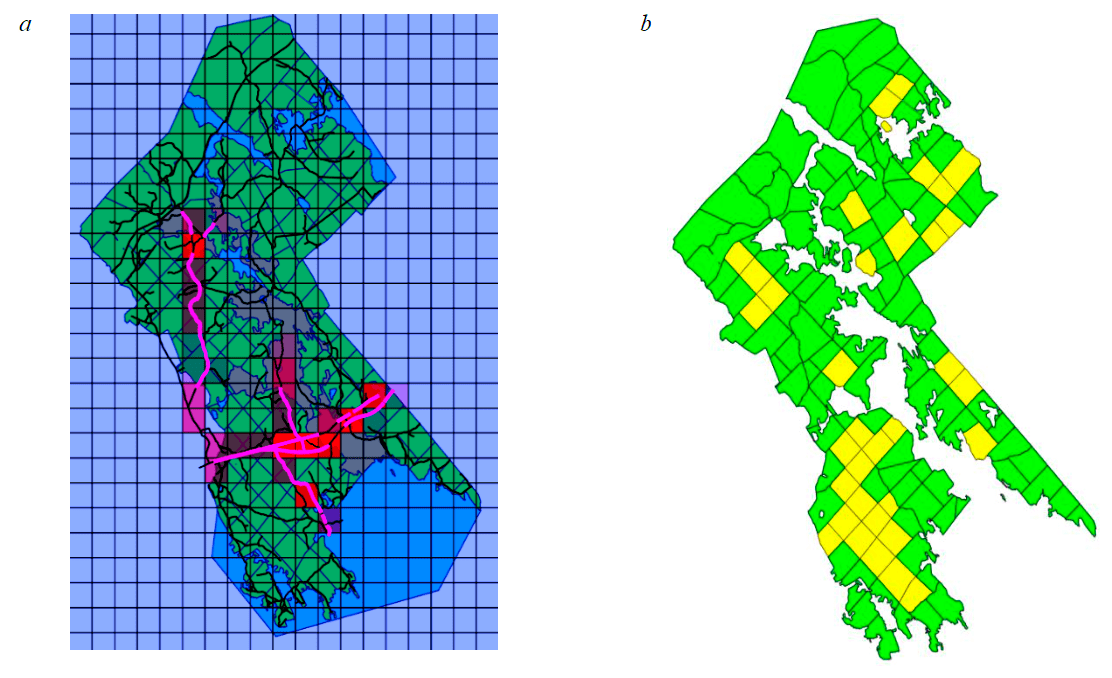
Fig.4. Construction of a geometric grid on the territory of a forestry: a – an example of assigning values of road densities; b – sample of typical forest blocks
where P is the perimeter of the forest quarter, km; S is the area of the forest quarter, km2.
A sample of 35 typical sites was formed according to the condition that the configuration coefficient is close to one (Fig.4, b).
Further, to determine the size of a typical site in the sample, the arithmetic mean value was calculated, which was raised to the radical. As a result, the side of a typical plot is 966.75 m. For convenience of calculations, the size of the geometric grid cell is rounded to the value of a typical site of 1000´1000 m.
The algorithm for assigning the density of a certain type of roads is as follows: for each forest quarter, the presence of intersections with each grid object was checked, a forest quarter can intersect with several cells, the density value is calculated based on the weighted average over the area. Density values were assigned using the high-level programming language Python (Fig.5) [9, 40].
Determination of the composition of significant pricing factors. To identify the most significant price-forming factors (objects) of the infrastructure, an expert assessment was carried out [25, 29]. To determine the composition of significant factors, a modernized method of hierarchy analysis was used [24]. As a result of the processing of expert assessments and construction of a Pareto diagram, four significant factors have been identified that, to a greater extent, affect the value of the lease payment for forest lands: forest warehouses, automobile, timber and forestry roads.
Determination of the integral indicator of infrastructure development. As a value characterizing the development of forest infrastructure, an integral quality indicator was chosen, which includes a set of significant infrastructure factors. The integral indicator of the quality of the object and the relative indicator of the property Kj take values from 0 to 1 [25, 29]. The integral indicator of the object j is calculated by the formula:
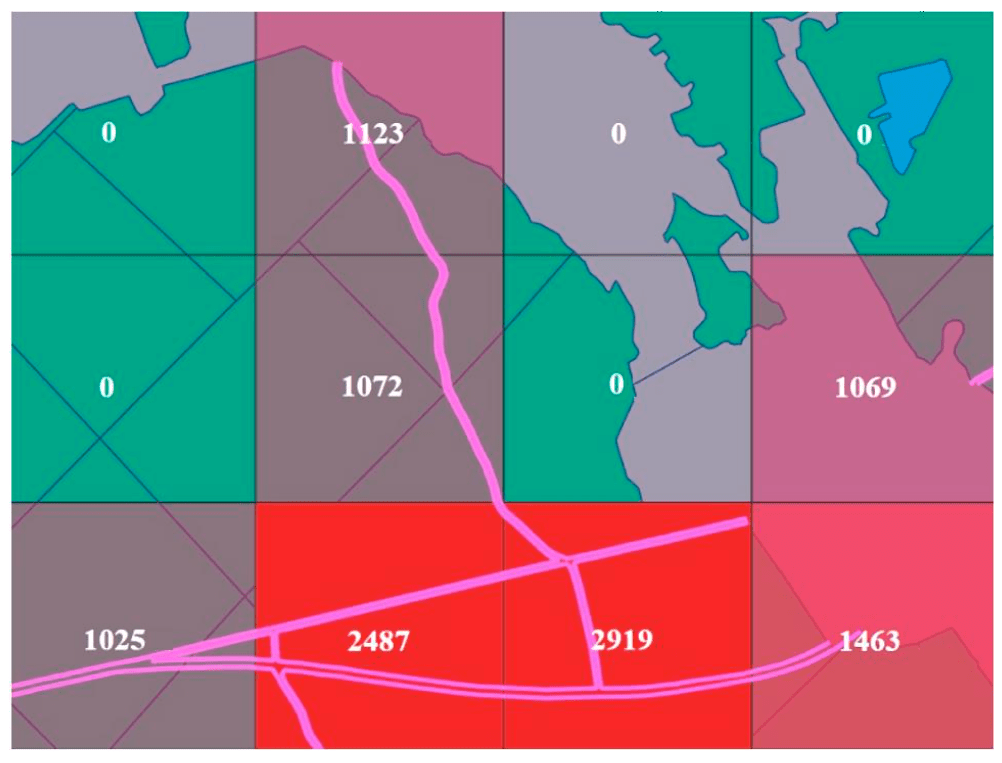
Fig.5. Calculation of the road network density on a geometric grid, m/ha
where is the relative index of property i of object j; Gi – weight or indicator of importance of property i; qav – the absolute indicator of property i of object j; qrej – rejection value of the indicator; qref is the reference value of the indicator.
Calculation of the values required to obtain the integral indicator is presented in Table 1.
Table 1
Values of the factors required to calculate the integral indicator
|
Values |
Isochron number of timber yards |
Density of roads, m/ha |
Density of forest roads, m/ha |
Density of timber roads, m/ha |
|
min |
1.00 |
0.00 |
0.00 |
0.00 |
|
max |
10.00 |
2919.55 |
2276.53 |
1072.07 |
|
qav |
3.30 |
352.05 |
599.65 |
227.12 |
|
qrej |
10.00 |
0.00 |
0.00 |
0.00 |
|
qref |
1.00 |
2919.55 |
2276.53 |
1072.07 |
|
Gi |
0.15 |
0.50 |
0.12 |
0.22 |
|
Sum Gi |
1 |
|||
The sum of the weights of the properties Gi should be equal to 1, and their calculation was carried out taking into account the tendency of the determination coefficient to 1 (R2→1). The rejection value of the qrej indicator is the value at which the attribute will have the least influence on the object of research, weights of the factors are determined by the method of hierarchy analysis. To combine various characteristics into one complex quantity, it is necessary that the values of the assessment criteria included in the model are normalized, since the use of variables without transformation can lead to the classification being determined by the criteria with the greatest scatter of values [25, 29].
On the basis of the normalized values and weighting coefficients of the criteria for the sections participating in the analysis, the values of integral indicator of the infrastructure development were calculated, which are in the range from 0 to 1. For correct work with the obtained coefficient, it is necessary to combine homogeneous elements. This can be done by clustering data, dividing the collection of information into homogeneous groups. There are several clustering algorithms: hierarchical, c-means, selection of related components, layer-by-layer clustering, k-means, minimum spanning tree [7]. The most effective method for splitting the integral indicator from the clustering algorithms is the k-means method, which, unlike the others, gives a specific result. For example, in the c-means method, observations can equally apply to one or the other cluster, the spanning tree method implies a complex computation algorithm. In addition, mean-value method has a simple interpretation.
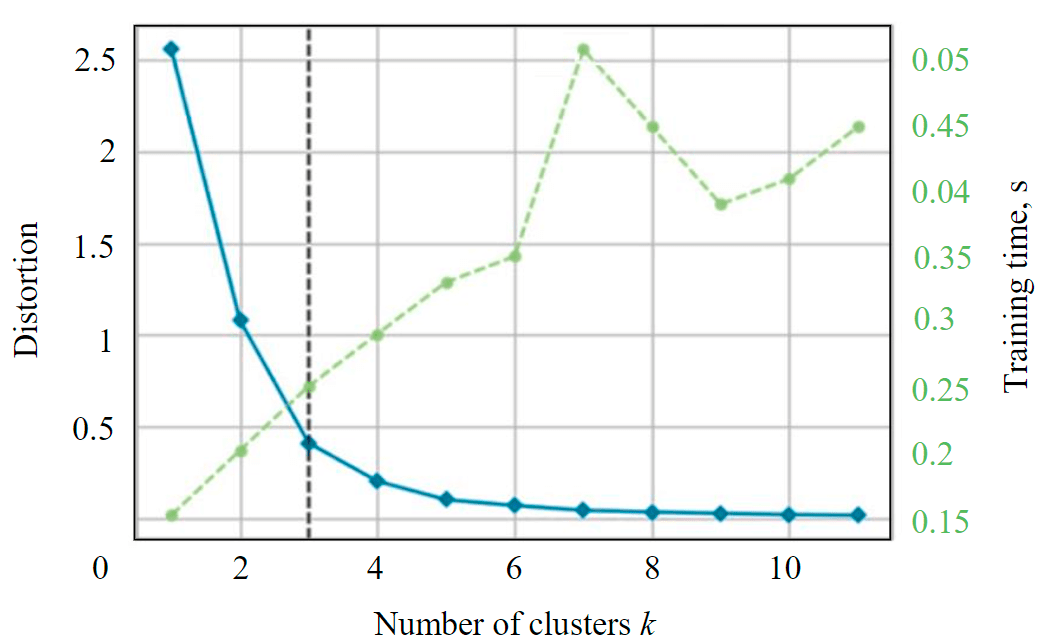
Fig.6. Determining the number of clusters by implementing the algorithm Elbow
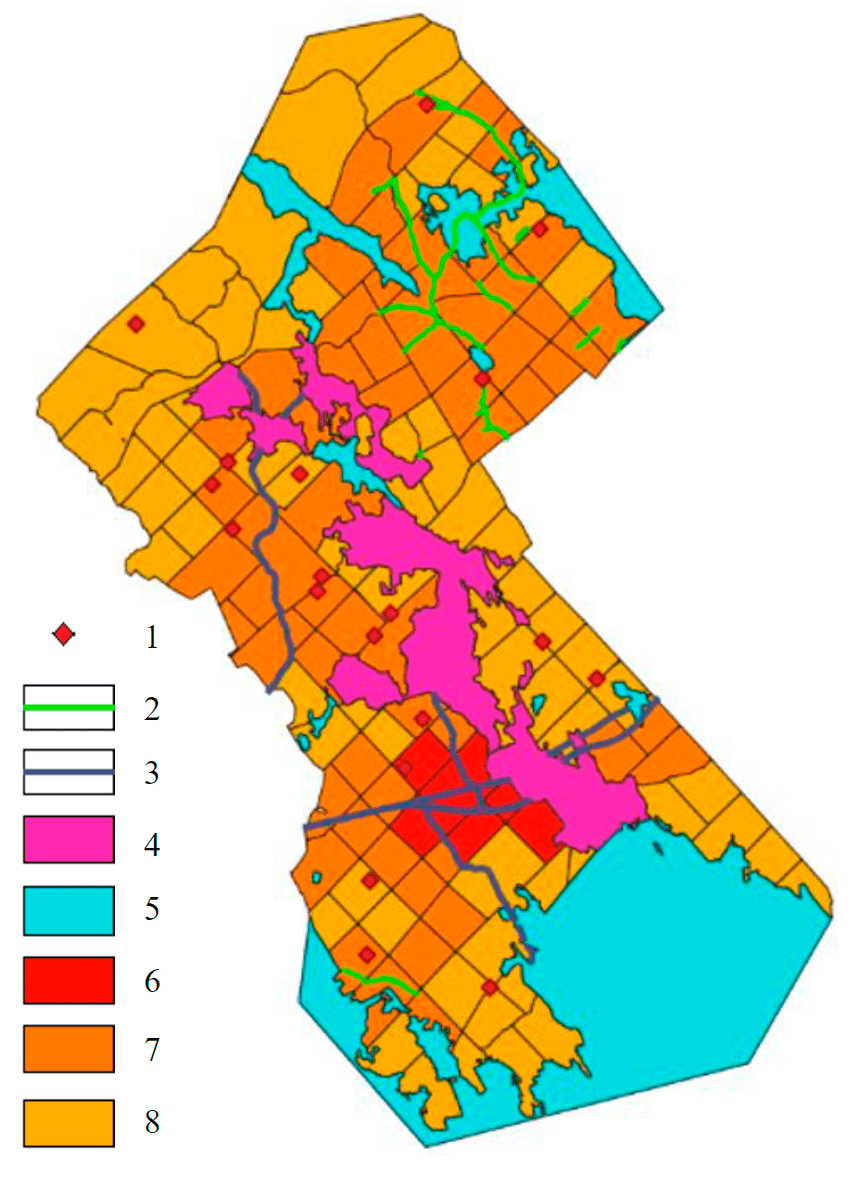
Fig.7. Differentiation of the territory of the Baltic precinct forestry by levels of forest infrastructure development 1 – upper/lower warehouses; 2 – timber road; 3 – motor road; 4 – settlements; 5 – hydrography; 6 – cluster 1; 7 – cluster 2; 8 – cluster 3
One of the tasks of cluster analysis is the selection of the optimal value of k, which has several versions of the solution [7]. The elbow method considers the nature of the change in the emission W with an increase in the number of groups k. When all n observations are combined into one group, the largest intra-cluster variance is obtained, which will decrease to 0 at k n. At a certain stage, the decrease in variance slows down – on the graph, this occurs at a point called the elbow. The elbow point corresponding to the optimal k value is automatically calculated using the Knee point detection algorithm [36]. The algorithm determines the maximum point of curvature, which is marked with a dashed line. The Python programming language library was used to determine the maximum point of curvature. An Excel spreadsheet containing data on the integral indicator was submitted to the script. In Fig.6, the y-axis shows the total group spread (dimensionless value), the x-axis shows the number of clusters, and the auxiliary axis shows the training time for the n-th number of clusters. As can be seen from the graph, the elbow point appears when there are three clusters with a learning time of 0.412 s. Thus, by clustering k-means, three levels (clusters) of forest infrastructure development were obtained. After that, belonging of units to the groups was recorded in the geoinformation layer, which made it possible to create a map with a graded design based on the discrete values of the cluster (Fig.7).
Modeling the rent of forest land and calculating the cadastral value. Modeling the calculation of rent for the use of forest land took into account the integral indicator (coefficient of development of the forest fund infrastructure) and the taxation value of the forest stand. At the first stage of regression modeling, the environment of the objects of assessment was analyzed [2]. In accordance with the theoretical base on forest lands and analysis of the environment, a list of pricing factors was compiled: an integral indicator characterizing the development of engineering infrastructure in the allotments, as well as a specific indicator of the taxation value of a land plot, expressed in the value of a forest per 1 hectare of area. The value of the rental rate per 1 m2, obtained as a result of the analysis of forest auctions (market data), was chosen as the resulting variable, which makes it unnecessary to include the value of the plot area in the number of factors. The task of regression analysis in the field of real estate appraisal is to identify the measure of the influence of a set of variables, which are price-forming factors, on the resulting value, as well as to analyze their influence separately. As a result, a regression model appears, which allows obtaining the resulting value for known values of the pricing factors. To assess the proximity of the two considered values (the integral indicator and the taxation value of the site), the correlation coefficient was used
where $\overline{x}, \overline{y}$, mean values of the features; δx,δy – estimates of standard deviations.
The influence of the factor of taxation value of the stand on the resulting indicator of the rental rate for 1 rub/m2 is carried out by calculating the correlation coefficient, as well as analyzing the distribution diagram (Fig.8).
In addition to the visual analysis of scatter diagrams, the correlation coefficient was calculated between the calculated value (rental rate RUB/m2) and the analyzed taxation value factor: ryx = 0.72. The data obtained allow us to draw the following conclusions:
- the diagram shown in Fig.8 indicates the presence of a linear dependence of the taxation value of the forest area on the rental rate;
- the correlation coefficient ryx = 0.72 shows the presence of a direct relationship between the rental rate of a land plot and the taxation value of 1 m2, according to the Chaddock scale, the relationship is strong;
- the value of the correlation coefficient does not contradict the ideas about the pricing of land plots of the forest fund, therefore the taxation value indicator increases the value of the rental rate;
- the observed scatter of values is not critical, the reason for the scatter may be that the model does not take into account the indicators of pricing factors, which individually do not significantly affect the value of the rental rate, therefore, it is not characterized by the presence of an outlier.
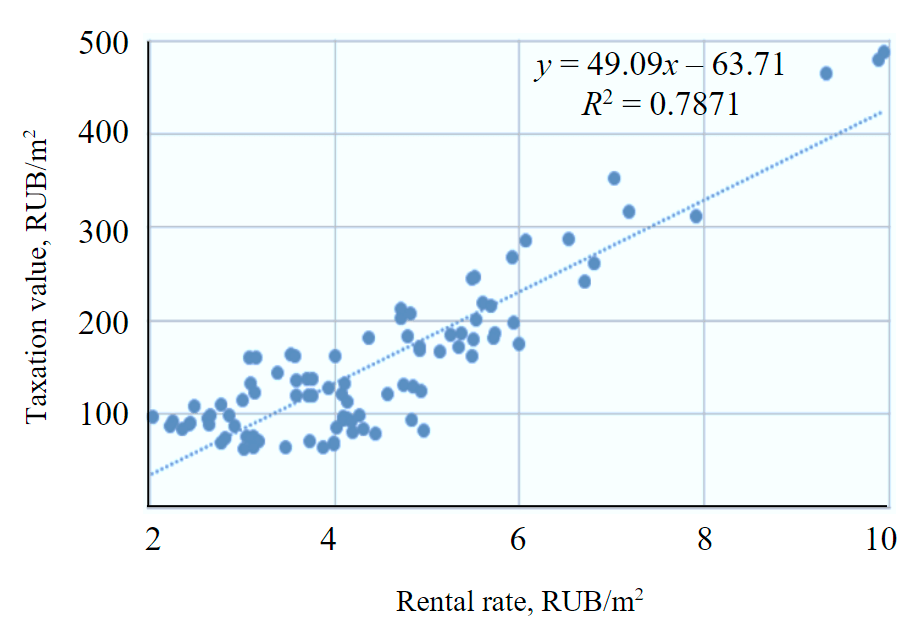
Fig.8. Dependence of the factor “Taxation value” forest stand from the rental rate
Based on the results of assessing strength of relationship between the rental rate and each pricing factor, an idea about the significance of the influence of all parameters on the resulting indicator, which allows them to be included in the regression model, is formed. The logical interpretation of the obtained coefficients of the model should correspond to the position dictated by the prevailing market conditions. The values of the coefficients allow us to show the difference between the two objects in terms of the influence of the considered value on the size of the rental rate, based on this, the following conclusions can be drawn:
- in the absence of the influence of the factors under consideration, the base rental rate will be 0.49 rub/ha;
- in case of equal influence of other factors, an increase in the taxation value indicator by 1 ruble per 1 ha increases the unit rental rate by 0.016 rub/m2;
- with equal influence of other factors, an increase in the integral indicator of infrastructure development by one unit increases the unit rental rate by 1,012 rub/m2.
As a result of constructing a linear model, the regression equation took the following form:
where y is the resulting variable, rental rate, rub/m2; x1 is the taxation value of the stand, rub/m2; х2 is an integral indicator of the development of the forest fund infrastructure;
- in the absence of the influence of the factors under consideration, the logarithm of the base rental rate will be –1.05 rub/m2. Such a value is devoid of economic sense, since the price for land cannot be negative;
- with equal influence of other factors, an increase in the logarithm of the taxation value by 1 RUB/m2 increases the logarithm of the unit rental rate by 0.44 RUB/m2;
- with equal influence of other factors, an increase in the integral indicator of infrastructure development by one unit increases the logarithm of the unit rental rate by 0.226 rub.
To determine the type of functional dependence, the quality indicators of linear and exponential model were summarized in Table 2.
Table 2
Comparison of quality parameters of models for calculating the lease rate of forest lands
|
Level of quality |
Linear model |
Indicative model |
|
Model equation |
y = 0.49 + 0.016x1 + 1.014x2 |
lny = –1.05 + 0.44lnx1 + 0.226x2 |
|
Determination coefficient R2 |
0.81 |
0.73 |
|
Adjusted coefficient of determination |
0.80 |
0.72 |
|
Results of checking the significance of the regression equation as a whole using the F-criteria |
Statistically significant |
Statistically significant |
|
Results of checking the significance of the coefficients of the regression equation using the t-test |
Coefficients for all variables are statistically significant |
Coefficients for all variables are statistically significant |
|
Coefficient of variation of the resulting indicator, % |
11.61 |
12.05 |
|
Average approximation error, % |
1.46 |
7.82 |
The linear model turned out to be the most preferable, since it has a greater value of the coefficient of determination and lower values of the coefficient of variation and the average approximation error than the exponential model. Also, the analysis of residuals did not reveal the presence of any dependences of the deviation distribution in the linear model, in contrast to the exponential model [4, 6, 28]. For 146 objects of appraisal, the specific indicator of the rental rate was calculated. After that, a transition from the specific indicator of the rental rate to the rental value for the entire area of the appraisal object was made. The rental price is calculated as follows:
where RR is the rental rate, rub / m2; S – forest area, m2.
Determination of the cadastral value of forest lands, taking into account the degree of development of their infrastructure. For the transition from the rental rate to the cadastral value, it is necessary to implement an income approach – the method of capitalizing land rent (rent) [47, 48]. The value of the capitalization rate for the type of use of forests, waste management and fishing for 2020 takes the value of 4.2 % [23]. Thus, the cadastral value of the property is calculated using the formula:
where Кc is the capitalization ratio, % (4.2 %).
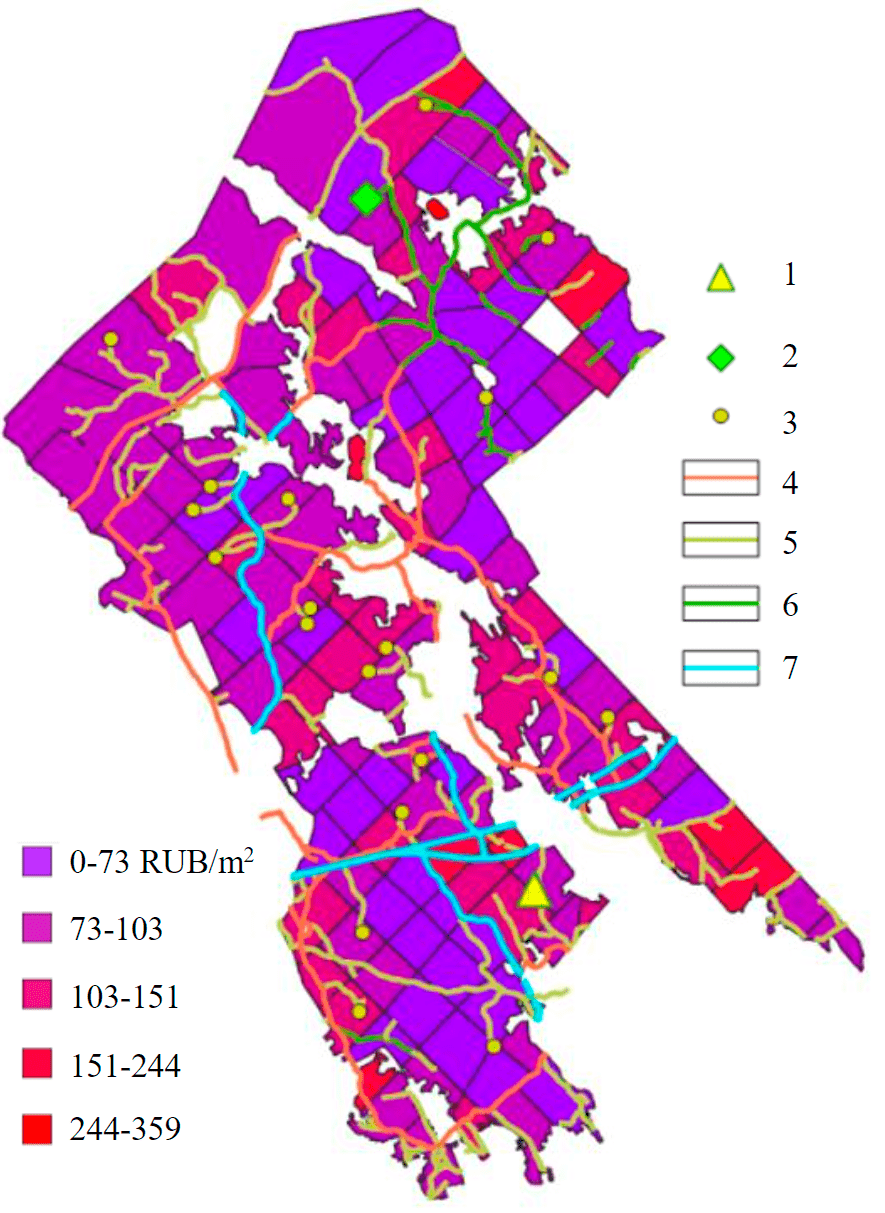
Fig.9. Differentiation of quarters by cadastral value, taking into account infrastructure 1 – timber industry enterprise; 2 – forestry office; 3 – upper/lower warehouses; 4 – unpaved country road; 5 – forestry road; 6 – timber road; 7 – road
To assess the distribution of the obtained value of assessment sites, a map of the estimated zoning of forest areas was built according to the specific indicator of the cadastral value (Fig.9).
Conclusion. As a result of the study, a methodology for cadastral valuation of forest lands was developed, taking into account the degree of development of their infrastructure. This technique can be used to determine the payment for the use of forest resources, to determine the effectiveness of forest harvesting and processing projects, to assess environmental damage, etc. As a result of assessing the infrastructure of the forest fund, an assessment algorithm was developed, a map was drawn up and an integral indicator (coefficient) of infrastructure development, dividing the territory of the forestry into three levels (clusters), was determined. A model for calculating the lease rate of forest land has been developed, taking into account the integral indicator of the development of infrastructure and the taxation value of plantations, according to which the value of the rental value of forest land is determined, this model is necessary to determine the cadastral value. As a result of the application of the income approach and the method of capitalization of land rent (rent), a specific indicator of the cadastral value of forest lands was obtained, taking into account the degree of development of their infrastructure. The following conclusions can be drawn from the map of the estimated zoning:
- allotments with the highest values of the specific indicator of the cadastral value are concentrated near settlements, which is explained by the development of infrastructure in places where people live;
- in the northwestern part of the considered territory with a low indicator of infrastructure development, there is a second price zone, which is explained by the high taxation value of this territory with valuable species.
Thus, distribution of the specific indicator of the cadastral value is consistent with the economic concept of the pricing of forest areas. When compared with the previous results of the cadastral assessment, the following conclusions were formed:
- on average, the value of the cadastral value, calculated according to the proposed methodology, is greater than the value of the current cadastral value; specific indicator of the cadastral value of forest lands is comparable in value with the specific indicators of the value of lands of other categories;
- the results of calculating the cadastral value of forest land plots of the Baltic district forestry based on the obtained analytical dependencies showed that they are comparable with their market prices, that is, they are objective. It has been established that the use of such an approach to assessing the cadastral value of forest lands provides an increase in the objectivity of the results, since it is based on real market data.
The developed methodology for the cadastral valuation of forest lands makes it possible to determine the objective value of the rent, taking into account the taxation indicators and location of the lease plot in relation to infrastructure facilities, i.e. for inaccessible forest areas the rent will be lower. This stimulates the creation of forest infrastructure facilities (forest roads, warehouses, etc.) at the expense of the tenant. The specific indicator of the cadastral value according to the data of the state budgetary institution is 0.65 rub/m2 [19, 21], this indicator is higher and averages 179, rub/m2, but it is close to market values, which corresponds to one of the goals of the cadastral assessment – comparability of the cadastral value with the market value. Despite the fact that the cost of forest land obtained using the new method is several times less than the cost of land of other categories (for example, the cost of a neighboring plot of land in the category of land in settlements is 715 rub/m2), the resulting specific indicator became comparable with the lands of other categories. It is obvious that a natural resource, which is the country-national wealth and performs a multipurpose function, cannot cost a penny, especially since not only the forest growing on the site at the time of assessment, but also the land itself is subject to cadastral assessment. In the course of the study, an integral indicator (coefficient of development) of the infrastructure was determined, it makes it possible to carry out a comparative characteristic of the territory according to the degree of forest infrastructure development. This indicator can be used to assess the territories in order to make comprehensive decisions and measures aimed at the development of certain forest areas, as well as when converting forest lands into lands of other categories for the construction of various facilities.
The development of modern transport and logistics infrastructure in forestry increases development of the timber industry. The results obtained using this methodology can be the basis for making decisions in the development of the forest sector in Russia, improving the level of development of the forest fund infrastructure and respecting the national resource, which is the forest.
References
- Romanchikov A.Yu., Kovyazin V.F., Zhivotyagina N.I. et al. Algorithm for mass cadastral valuation of forest lands according to taxation indicators of plantations. Izvestiya Tomskogo politekhnicheskogo universiteta. 2020. Vol. 331. N 11, p. 108-116. DOI: 10.18799/24131830/2020/11/2890 (in Russian).
- Artemenkova I.L., Artemenkov A.I., Mikerin G.I. European Valuation Standards 2012. Мoscow: Samoreguliruemaya obshcherossiiskaya obshchestvennaya organizatsiya “Rossiiskoe obshchestvo otsenshchikov”, 2014. Part 1, p. 331. (in Russian)
- Bogolyubova A.A. Automatic interpretation technology of aerial and satellite images according to different methods of land cover for protected areas. Journal of Mining Institute. 2012. Vol. 199, p. 269-275 (in Russian).
- Gribovskii S.V., Igolkin M.V. To the draft law on cadastral valuation. Imushchestvennye otnosheniya v RF. 2015. N 11 (170), p. 6-12 (in Russian).
- Gryazkin A.V., Kovalev N.V., Bazaev A.B., Khetagurov Kh.M. Foreign experience in the field of forest relations and assessment of the value of green spaces. Ekologicheskie problema Arktiki i severnykh territorii: Mezhvuzovskii sbornik nauchnykh trudov. 2014. Iss. 17, p. 9-15.
- Kiseleva V.A., Lepikhina O.Yu. The analysis of sufficiency and reliability of market information in small and average settlements in the Northwest district for estimation of the statistical method of ground area cadastral cost definition application possibility. Journal of Mining Institute. 2011. Vol. 189, p. 217-221 (in Russian).
- Classification, Regression, Data Mining Algorithms Using R. URL: https://ranalytics.github.io/data-mining/101-Partitioning-Algos.html#sec_10_1 (date of access 07.03.2021) (in Russian).
- Kovyazin V.F., Romanchikov A.Yu. The problem of cadastral appraisal of forest lands taking into account the infrastructure of the forestry fund. Journal of Mining Institute. 2018. Vol. 229, p. 98-104. DOI: 10.25515/PMI.2018.1.98 (in Russian).
- Lepikhina O.Yu., Pravdina E.A. Variable accounting of pricing factors in the cadastral valuation of land (in the case of city of St. Petersburg). Izvestiya Tomskogo politekhnicheskogo universiteta. Inzhiniring georesursov. 2019. Vol. 330. N 2, p. 65-74 (in Russian).
- Voronkov P.T., Voronkov A.P., Belov A.N. et al. Modeling the economic availability of forest resources using regression analysis. Lesokhozyaistvennaya informatsiya. 2009. N 1-2, p. 7-13 (in Russian).
- Moiseeva E.E. Formation of a mechanism for assessing the economic accessibility of forest resources when leasing forest land plots (on the example of the Krasnoyarsk Territory: Avtoref. dis. … kand. ekon. nauk. Krasnoyarsk: Sibirskii gosudarstvennyi tekhnologicheskii universitet, 2002, 9 (in Russian).
- Bykowa E.N., Volkova Ja.A., Sulin M.A. et al. Method of market data extrapolation in time for mass appraisal of land under conditions of weak developed market. Geodeziya i Kartografiya. 2020. Vol. 965. N 11, p. 40-49. DOI: 10.22389/0016-7126-2020-965-11-40-49 (in Russian).
- On recognizing as not subject to application of the Order of the Federal Land Cadaster Service of Russia dated October 17, 2002 N P/336 “On approval of the Methodology for the state cadastral valuation of forest lands of the Russian Federation”: Order of the Ministry of Economic Development N 96 of 03/15/2010. URL: http://www.consultant.ru/document/cons_doc_LAW_98530/ (date of access 10.01.2021) (in Russian).
- On the rates of payment per unit volume of forest resources and rates of payment per unit area of a forest plot in federal ownership: Resolution of the Government of the Russian Federation N 310 dated May 22, 2007 (amended on January 6, 2020) URL: http://www.consultant.ru/document/cons_doc_LAW_68813/0043cdfb5d4efbdbad6df71ffa20a6d884e10f16/ (date of access 10.01.2021) (in Russian).
- On the approval of the methodology for the economic assessment of forests: Order of the Federal Forestry Service of Russia dated October 3, 2000 N 43. URL: https://www.consultant.ru/document/cons_doc_LAW_27752/f87cab52f99e5dddead9d977f71edb78197803c0/ (date of access 10.01.2021) (in Russian).
- On the approval of guidelines on the state cadastral valuation: Order of the Ministry of Economic Development of the Russian Federation of December 5, 2017 N 226 (amended on September 9, 2019). URL: http://www.consultant.ru/document/cons_doc_LAW_217405/ (date of access 10.01.2021) (in Russian).
- On the approval of the Strategy for the development of the forestry complex of the Russian Federation until 2030: Order of the Government of the Russian Federation of February 11, 2021 N 312-r. URL: https://www.consultant.ru/search/?q=%D0%A0%D0%B0%D1%81%D0%BF%D0%BE%D1%8F%D0%B6%D0%B5%D0%BD%D0%B8%D0%B5+%D0%BE%D1%82+11+%D1%84%D0%B5%D0%B2%D1%80%D0%B0%D0%BB%D1%8F+2021+%D0%B3%D0%BE%D0%B4%D0%B0+%E2%84%96312-%D1%80 / (date of access 07.03.2021) (in Russian).
- On the approval of the Fundamentals of State Policy in the Field of Use, Conservation, Protection and Reproduction of Forests in the Russian Federation for the Period up to 2030: Order of the Government of the Russian Federation of September 26, 2013 N 1724-r. URL: http://www.consultant.ru/document/cons_doc_LAW_152506/ (date of access 07.03.2021) (in Russian).
- Report N 01-k/2020 dated November 2, 2020 on the results of the state cadastral valuation of real estate objects – land plots of industrial, energy, transport, communications, radio broadcasting, television, informatics, land for space activities, defense, security and other lands special purpose, lands of specially protected territories and objects, lands of the forest fund of the Leningrad region. Leningrad Regional Committee for State Property Management State Budgetary Institution of the Leningrad Region “Leningrad Regional Institution of Cadastral Appraisal” (GBU LO “LenKadOtsenka”, 2020, p.591 (in Russian).
- Pivovarov K.N., Zolotukhin A.B. Use of multicriteria approach and methods of fuzzy mathematics for estimating development conditions of arctic seas in terms of the southeastern part of the Barents Sea. Arktika: ekologiya i ekonomika. 2018. N 3 (31), p. 100-111. DOI: 10.25283/2223-4594-2018-3-100-111 (in Russian).
- Obtaining information from the State Cadastral Valuation Data Fund. URL: http://rosreestr.ru/wps/portal/cc_ib_svedFDGKO (date of access 07.01.2017) (in Russian).
- Romanchikov A.Yu. Cadastral valuation of woodland covered forest lands in the taiga zone of the North-West of the Russian Federation with the multipurpose use of their resource potential of territories: Avtoref. dis. … kand. tekhn. nauk. St. Petersburg: Saint Petersburg Mining University. 2017, p. 231 (in Russian).
- Russian Statistical Yearbook 2020. Мoscow: Federalnaya sluzhba gosudarstvennoi statistiki, 2020, p. 700 (in Russian).
- Sapozhnikova Y.I., Kornilov Y.N. Processing technology of pairwise comparisons at the peer review. Journal of Mining Institute. 2013. Vol. 204, p. 171-174 (in Russian).
- Senkovskaya K.E. Cadastral valuation of garden, vegetable garden and summer cottages, taking into account zones with special conditions for the use of territories: Avtoref. dis. … kand. tekhn. nauk. St. Petersburg: Saint Petersburg Mining University. 2018, p. 22 (in Russian).
- Strategy for the long-term development of the Russian Federation with low greenhouse gas emissions until 2050. URL: https://economy.gov.ru/material/file/babacbb75d32d90e28d3298582d13a75/proekt_strategii.pdf (date of access 18.04.2021) (in Russian).
- Tretyakov A.G. Economic accessibility of forest resources: its determining factors and the accuracy of the estimates. Lesotekhnicheskii zhurnal. 2015. N 1(17), p. 274-287. DOI: 10.12737/11285 (in Russian).
- Chernetskaya Y.V. Refinements of strategy for calculating cadastral value of ground area considering encumbrances and restrictions with the aim of taxation. Journal of Mining Institute. 2012. Vol. 196, p. 105-109 (in Russian).
- Shabaeva Yu.I. Cadastral valuation of land for individual residential development, taking into account the differentiation of the urban area in terms of prestige: Avtoref. dis. … kand. tekhn. nauk. St. Petersburg: Saint Petersburg Mining University, 2015, p. 20 (in Russian).
- Meignan D., Frayret J.-M., Pesant G., Mathieu B. A heuristic approach to automated forest road location. Canadian Journal of Forest Research. 2012. Vol. 42. N 12, p. 2130-2141. DOI: 10.1139/x2012-140
- Amacher G.S., Ollikainen M., Koskela E. Economics of Forest Resources. Massachusetts: The MIT Press. 2009, p. 320.
- Baltyzhakova T.I., Bryzhataya E.S. Analysis of urban territory in terms of accessibility to social objects. Journal of Physics: Conference Series. 2019. Vol. 1333. Iss. 3. N 032005. DOI: 10.1088/1742-6596/1333/3/032005
- Bont L.G., Heinimann H.R., Church R.L. Concurrent optimization of harvesting and road network layouts under steep terrain. Annals of Operations Research. 2015. Vol. 232(1), p. 41-64. DOI: 10.1007/s10479-012-1273-4
- Brazee J.R., Dwivedi P. Optimal Forest Rotation with Multiple Product Classes. Forest Science. 2015. Vol. 61. Iss. 3, p. 458-465. DOI: 10.5849/forsci.13-207
- Bykowa E.N., Gerasimova I.G. Land Plot Selection Rationale for the Location of Linear Facilities. Land. 2019. Vol. 4. Iss. 8, p. 1-17. DOI: 10.3390/land8040067
- Elbow Method. URL: https://www.scikit-yb.org/en/latest/api/cluster/elbow.html#elbow-method (date of access 21.03.2021).
- Hełdak M., Bykowa E. Construction of public roads at the meeting point of different legislation systems. Journal of Ecological Engineering. 2017. Vol. 18. Iss. 6, p. 86-94. DOI: 10.12911/22998993/76217
- Heinimann H.R. Forest Road Network and Transportation Engineering-State and Perspectives. Croatian Journal of Forest Engineering. 2017. Vol. 38. Iss. 2, p. 155-173.
- Kitcenko A.A., Kovyazin V.F., Romanchikov A.Y. Modern condition and prospects for the development of forest infrastructure to improve the economy of nature management. Scientific and Practical Studies of Raw Material Issues. 2019, p. 200-204. DOI: 10.1201/9781003017226-28
- Kolesnik O., Kolesnik D. The calculating the progressive collapse problem in the light of the existing regulatory framework of the Russian Federation. IOP Conference Series: Materials Science and Engineering. 2019. Vol. 698. Iss. 2. N 022048. DOI: 10.1088/1757-899X/698/2/022048
- Kopylova N.S., Bykova A.A., Beregovoy D.N. Geographic information modeling of Econet of Northwestern Federal District territory on graph theory basis. Journal of Physics: Conference Series. 2018. Vol. 1015. Iss. 3. N 032063. DOI: 10.1088/1742-6596/1015/3/032063
- Medvedev S., Mokhirev A., Rjabova T. Priority areas of research in the development of the timber industry complex in Russia: technical and logistics aspect. IOP Conference Series: Earth and Environmental Science. 2020. Vol. 574. N 012050. DOI: 10.1088/1755-1315/574/1/012050
- Niskanen A., Petrov A., Filoushkina G. Economic accessibility of forest resources in Northwest Russia. EFI Proceedings. 2004. Vol. 48, p. 45-52. DOI: 10.22004/ag.econ.198346
- Nguyen T.H., Kanemoto K. Mapping the deforestation footprint of nations reveals growing threat to tropical forests. Nature Ecology & Evolution. 2021. Vol. 5, p. 845-853. DOI: 10.1038/s41559-021-01417-z
- Preston L. The valuation of agricultural land for rating purposes in Australia: methodology and administration. The Farmers Club. 2011, p. 1-47.
- Roşu D.C., Ciolac V., Colţan O.N. Some aspects of cadastral documentation necessary registration agricultural land in land book. Journal of Horticulture, Forestry and Biotechnology. 2012. Vol. 20 (2), p. 231-233.
- Rybkina A.M., Demidova P.M., Kiselev V.A. Analysis of the application of deterministic interpolation methods for land cadastral valuation of low-rise residential development of localities. International Journal of Applied Engineering Research. 2017. Vol. 12. Iss. 21, p. 10834-10840.
- Rybkina A.M., Demidova P.M., Kiselev V.A. Working-out of the geostatistical model of mass cadastral valuation of Urban lands evidence from the city Vsevolozhsk (Russia). International Journal of Applied Engineering Research. 2016. Vol. 11. Iss. 24, p. 11631-11638.
- Stenger A., Harou P., Navrud S. Valuing environmental goods and services derived from the forests. Journal of Forest Economics. 2009. Vol. 15, p. 1-14. DOI: 10.1016/j.jfe.2008.03.001