
Automated digitization of radial charts
- 1 — Ph.D. Scientific Director Saint-Petersburg Mining University ▪ Orcid ▪ Elibrary ▪ Scopus ▪ ResearcherID
- 2 — Ph.D. Scientific Director of the Educational Research Center for Digital Technologies Saint-Petersburg Mining University ▪ Orcid ▪ Elibrary ▪ Scopus ▪ ResearcherID
- 3 — Research Assistant Saint-Petersburg Mining University ▪ Orcid ▪ Elibrary
- 4 — Dr.Habil. Head of Department Tomsk polytechnic university ▪ Orcid ▪ Elibrary ▪ Scopus

Abstract
Radial charts were commonly used in the industry to allow retrospective assessment of technological parameters. Today it is relevant to digitize the obtained data in order to simplify the automation of technological processes. Digitization of radial charts by means of standard methods is carried out with the help of human labor at significant time costs. The article proposes an automated method for digitizing radial charts using software, developed in the LabVIEW programming environment. The results of processing radial charts are displayed on the screen in numerical and graphical form, and can also be exported to a file (for example, to Notepad or MS Excel). The presented technique can be applied to images obtained on a color or black-and-white scanner, which minimizes geometric distortions, associated with the conversion of a paper document into electronic form, and ensures recognition quality of the clear plot line with an average relative error of up to 3 %. In case of ink fading or perspective photos of the diagram, the value of relative error can reach 8 %, as a result of which additional manual correction of the data will be required.
None
Introduction. A widespread distribution of paper chart recorders at the enterprises of chemical, metallurgical, mining and other industries in the middle of the last century was associated with the need to accumulate and evaluate data on technological processes [5, 14, 21, 26]. Based on the obtained values, it was possible to predict the variation of unit operating modes depending on the changes in the input parameters of the system, as well as to assess the possibility of emergency situations and to prevent them beforehand. With the emergence of intelligent systems of technological process control, including SCADA, MES, etc., it became possible to significantly simplify the work of operators and to convert received data to forms that are human-readable [13, 15, 24].
Nowadays the Russian Federation makes a transition to digital technologies, which implies both universal automation of technological processes and the creation of intelligent assistant systems based on archival data on the management of the technological process [11, 25, 28]. A number of industries store data obtained from recorders in various graphical forms in archives; along with this, some laboratories until recently used paper recorders in their experiments [8].
To minimize the volume of paper archives, as well as to simplify access to archival data, it is reasonable to use automated systems for digitizing data obtained with paper chart recorders [3, 12, 14].
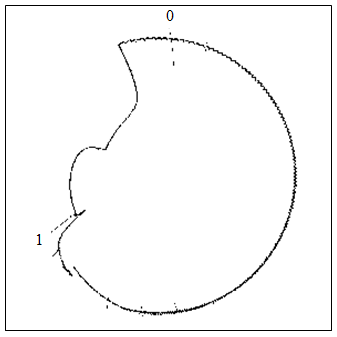
Statement of the problem. The paper addresses one type of graphical representation of data obtained from the recorder, namely radial charts. A radial chart is a graph in the polar coordinate system that represents a grid (a set of time circles and arcs) and one or two curves (diagrams of temperature, pressure drop, etc.). They are used in production for recording temperature, pressure, humidity and other parameters over a specific time period. Due to global computerization and the drive for automation, it became necessary to convert archives with diagrams into a digital form. The processing of radial charts implies active human involvement; a lot of time is spent on the processing of each diagram. In addition, since the diagrams are processed by planimeters, the processing accuracy is low and the main parameter is estimated with a large error. .
Therefore, there is a need to develop effective methods and algorithms for automatic recognition of curves in color images of radial charts, which can be classified as an image recognition task [3, 5, 6], as it is necessary to “distinguish” the points of the diagram among other points. The implementation of such techniques is complicated by the fact that the diagram may contain various interferences: spots, scratches, random line breaks. An algorithm for automatic recognition of curves in the digital images of radial charts was developed to solve this sort of problems.
The aim of the study is to develop a software product that will allow to automate the process of converting a raster image into a digital form. The paper considers a program for digitizing radial charts from raster images, recording temperature changes in the heating furnace, installed in a press shop for preparing steel ingots for forging. However, the proposed method is universal: it can be used to digitize any radial charts.
There are various software products for digitizing linear data (presented in a Cartesian coordinate system) in a graphical form. However, their tools do not allow to process radial charts due to a fundamental difference between polar and Cartesian coordinate systems.
To achieve this goal, it was decided to develop an algorithm and to implement a proprietary software product based on LabVIEW [9, 20, 30]. LabVIEW is a programming environment, developed and implemented by the company National Instruments (USA). On the basis of LabVIEW [15] it is possible to create software products using the graphical programming language G, which facilitates both the process of its learning and its application in software development. The toolkit of the programming environment consists of basic functions for working with data and additional modules that expand the functionality of the environment (machine vision systems, interaction with MS Office, connection to databases, etc.). LabVIEW functionality allows to create standard WINDOWS applications for personal computers with an intuitive interface. All of the above-mentioned advantages have led to the use of this programming environment for the proprietary software.
Research Methodology. The development and implementation of the software product is considered on the example of digitizing radial charts from raster images that record temperature changes in the heating furnace, installed in a press shop to prepare steel ingots for forging.
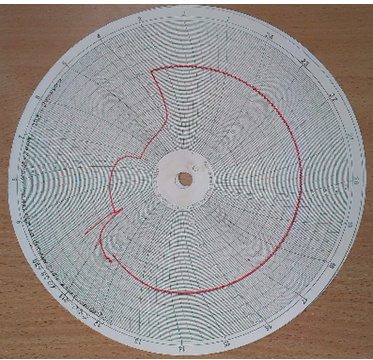
Initially, it was necessary to take into account the specifics of radial charts received for digitization. On the radial charts under consideration (Fig.1), the distance from the center shows the temperature in degrees 0С, and the polar angle φ shows the time of measurement in hours, with an accuracy of up to 4 minutes.
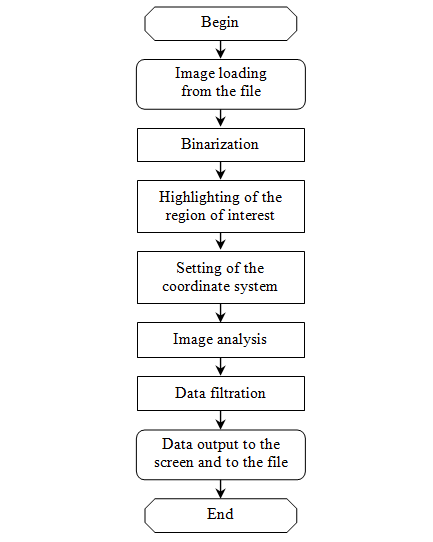
The program was written using the LabVIEW IMAQ Vision library (software for development of machine vision applications and image processing, including real-time functionality) [10, 23]. To perform mathematical operations and to display digitization results on the screen, built-in libraries from the Mathematics and Programming panels were used, respectively. The stages of the algorithm are presented in Fig.2.
The input data can be photographs or scanned diagram images. The latter are preferable, since they completely eliminate perspective distortions, and therefore reduce the value of instrumental error in image analysis and processing. If necessary, the downloaded files are converted from color to grayscale, which allows to speed up the processing, given that the object (plot line), the region of interest (the grid of the diagram) and the background (the surface where the diagram lies) are in sufficient contrast to each other and do not match in color.
Image preprocessing involves the procedure of “threshold binarization”. The image is split into two areas, one of them below the threshold and the other one above it. In this solution an algorithm of adaptive binarization was used, which is based on the use of local and global histograms of the image. Optimal threshold segmentation is achieved by representing a certain curve using the weighted sums of two or more intensity probabilities with a normal distribution. In this case, the threshold value corresponds to the minimum probability between the maxima of two or more normal distributions. The program implements the algorithm for automatic adjustment of brightness ranges (Otsu’s method, proposed in 1979) and, when necessary, more thorough manual processing. As a result, the background and then the coordinate grid of the diagram are successively removed, which allows to eliminate gross errors in image analysis [1, 17].
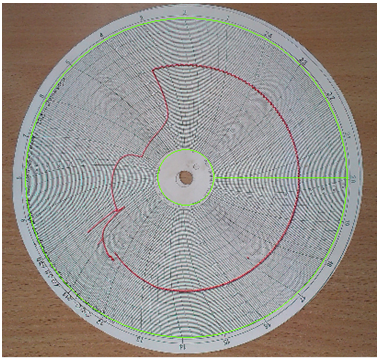
Next, the region of interest is determined in the image by means of automatic (or manual, if needed) selection of the diagram field (minimum and maximum values of time and temperature scales, as shown in Fig. 3) Thus, further processing will be performed over the area, which is either a closed or an open ring. At this stage, it is necessary to specify the polar angle, corresponding to the origin of time in the polar coordinate system.
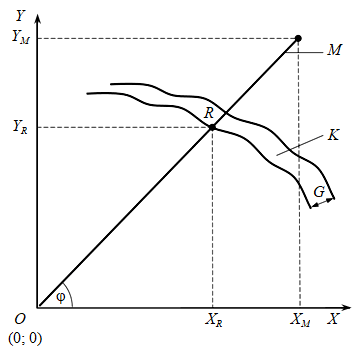
The technique for automatic recognition of curve coordinates is presented in Fig.4. Curve К has a thickness of G, marker М – is the auxiliary line on the diagram, which moves counterclockwise around the center, passing through the origin of coordinates and the second point, which is defined by the parametric equation of the circle x=x0+Mcos(φ); y=y0+Msin(φ) in increments of the angle φ = 1° angle φ corresponds to 4 minutes of time in the coordinate system of the initial radial chart, and is also limited by the size of the region of interest.
The result of this procedure is the coordinates of the point R (xR; yR) (the first intersection of the curve К and the marker М (see Fig.3), calculated by the threshold value of the brightness change along the auxiliary line M, where 0 is the white background and 1 is the object of interest, the plot line chart is white (Fig.5).
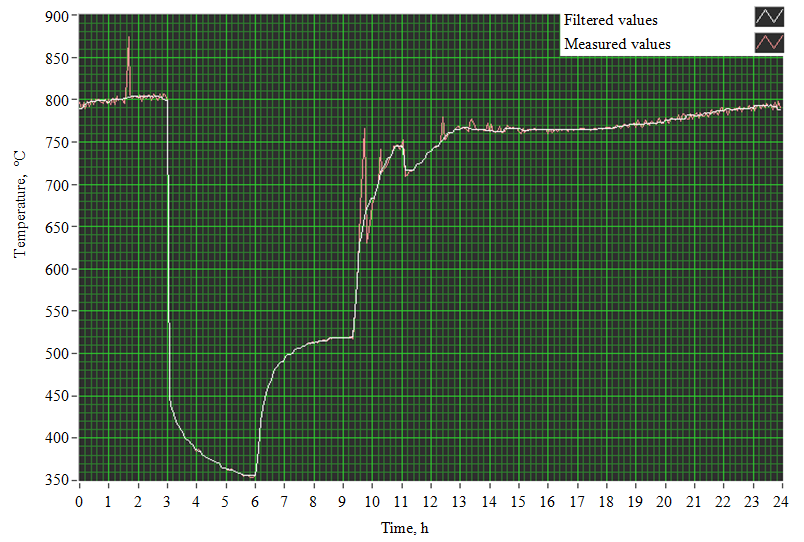
Results. Each intersection of the marker and the curve plot is recorded. The coordinates of intersection points are automatically exported to the file, and also displayed on the graph of time-temperature dependency in a Cartesian coordinate system (Fig.6). If no intersections are observes, the coordinates are assigned zero values.
Conversion of the length of the O,R segment to the temperature value T is performed using the coefficient k. This coefficient is calculated as the ratio of the length of the O,R segment to the length of the O,М segment of the temperature axis on the initial diagram (set manually).
It was decided to smooth out the obtained values of temperature T in order to filter the received signal and to eliminate interference [8, 16, 19, 22]. Smoothing (filtering) of the signal was carried out using the moving average method [4, 7]: smoothed value of the target temperature T at any point t is taken as its average value in the interval (t – 2l; t + 2l), where l – is a certain time period, chosen by the researcher. As t varies, this interval moves along the time axis, which explains the name of the method. Thus, the ordinates of the target temperature T(t) are estimated using the formula
As seen from the formula (1), the larger the 2l, interval, the better the smoothing. However, at very large values of l the function T(t) itself is also smoothed. It is recommended to choose the value of l not higher than 4. In this case, l was taken equal to 4.
To check digitization accuracy of the results, 36 points (every tenth value) were selected, and the relative measurement error was determined by the formula
where Ye and Yc – are experimental and calculated values of the determined parameter. The average value of the relative error was 2.14 %. The maximum error value of 7.95 % was recorded in the area from 1 to 2 hours (Fig.6). This is explained by the occurrence of noise in the analyzed radial chart (Fig.5). For time values from 3 to 10 hours (Fig. 6), the error is 0.09-0.9 %. From 14 to 24 hours (Fig.6), the digitization error is within 2 %.
To confirm the validity of the proposed technique for digitizing radial charts, another 45 tests were carried out in the same way to digitize the images of various quality. Scanned black-and-white and color images were digitized; pictures taken with a digital camera and smartphone, of high and low quality, with a clear plot line and a barely noticeable one.
The result of digitizing images of radial charts, obtained on a color and black-and-white scanner, demonstrated high-quality recognition of a clear plot line with an average relative error of up to 3 %. In case of fading ink or perspective photos of the diagram, the value of the relative error can reach 8 %, as a result of which additional manual correction of the data will be required [18, 27, 29].
Conclusions. The developed program simplifies the processing of radial charts, allowing to significantly reduce the time and systemize numerous measurements. Already at an early stage, it almost completely eliminates the influence of human factor on digitization.
The program can be used in production for converting measurement results from paper to digital form. The project is protected by the authors with the certificate of state registration of the computer program N 2019612907 [12].
References
- Aliev M.V., Panesh A.Kh., Kasparyan M.S. Identification of contours on low contrasting and blurred images using fractal filtration. The Bulletin of the Adyghe State University: Internet Scientific Journal. 2011. N 3, p. 101-107 (in Russian).
- Bilynskyi Y.Y., Mykulka I.V. The Method of Allocation of Contours of Objects on the Dim Images. Visnyk of Vinnytsia Polytechnical Institute. 2012. N 3 (102), p. 164-169 (in Russian).
- Bolshakova A. FemtoScan On-line: Digitization of Graphs and Curves. Nanoindustriya. 2012. N 2 (32), p. 52-53 (in Russian).
- Kalinkina D., Vatolin D. The Problem of Noise Suppression in Images and Videos and Various Approaches to Its Solution. Kompyuternaya grafika i multimediya. 2005. N 3 (2), p. 1-30 (in Russian).
- Lepskii A.E., Bronevich A.G. Mathematical Methods of Image Recognition. Taganrog: TTI YuFU, 2009, p. 155 (in Russian).
- Merkov A.B. Image Recognition. Introduction to the Methods of Statistical Learning. Moscow: Editorial URSS, 2011, p. 256 (in Russian).
- Mishin A.B., Tkachev P.Y. Choice of Structure Neural Network Filter for Digital Image Processing. Proceedings of the Soutwest State University. 2013. N 3 (48), p. 14-18 (in Russian).
- Mishin A.B. Image Filtering Using a Neural Network. Telekommunikatsii. 2012. N 13, p. 10-14 (in Russian).
- Vizilter Yu.V., Zheltov S.Yu., Knyaz V.A., Khodarev A.N., Morzhin A.V. Digital Image Processing and Analysis with Examples in LabVIEW IMAQ Vision. Moscow: DMK Press, 2008, p. 464 (in Russian).
- Kulchitskii A.A., Bulatov V.V., Boikov A.V., Komarova T.Yu., Bazhin V.Yu. The Use of Computer Vision Systems for Monitoring Technological Parameters and Equipment in Production. Novye informatsionnye tekhnologii v avtomatizirovannykh sistemakh. 2017. N 20, p. 17-22 (in Russian).
- Safiullin R.N., Afanasev A.S., Reznichenko V.V The concept of development of monitoring systems and management of intelligent technical complexes. Journal of Mining Institute. 2019. Vol. 237, p. 322-330. DOI: 10.31897/PMI.2019.3.322
- Boikov A.V., Vasileva N.V., Sizyakova E.V. Certificate of state registration of the computer program No. 2019612907. Program for Digitizing Charts from Raster Images. Appl. 14.02.2019. Publ. 04.03.2019 (in Russian).
- Tynkachev A.R., Bukhner A.V. Intellectualization of Production - the Path to Efficiency. Promyshlennye ASU i kontrollery. 2006. N 6, p. 8-11 (in Russian).
- Sharapova E.N., Dmitriev V.L. System of Digitization of Graphic Data. Software of systems in the industrial and social fields. 2014. N 1-2. p. 166-171 (in Russian).
- Khashper A.L., Lind Yu. B., Galeev S.R. Methods of Intellectual Digitization for Well Survey Data. Vestnik Bashkirskogo universiteta. 2013. Vol. 18. N 4, p. 984-988 (in Russian).
- Yarmolenko A.S., Skobenko O.V. Application of the Theory of Wavelets for Compression and Filtration of Geoinformation. Journal of Mining Institute. Vol 234, p. 612. DOI: 10.31897/PMI.2018.6.612
- Abakumov I.I., Kulchitskii A.A. Compensation of the Errors of a Passive Opto-Electronic System for Dimensional Control of Articles. Measurement Techniques. 2016. Vol. 59. Iss. 8, p. 826-831. DOI: 10.1007/s11018-016-1052-8
- Bulatov V.V., Kulchitskii A.A. Features of translucent materials and products defects detection with support of optical system. Journal of Physics: Conference Series. 2020. Vol. 1515. Iss. 5, p. 1-7. DOI: 10.1088/1742-6596/1515/5/052007
- Marpe D., Cycon H. L., Zander G., Barthel K.-U. Context-based Denoising of Images Using Iterative Wavelet Thresholding. Electronic Imaging, 2002, San Jose, California, United States. Proc. SPIE. 2002. Vol. 4671, p. 907-914. DOI: 10.1117/12.453135
- Posada-Gómez R., Osvaldo Sandoval-González O., Martínez Sibaja A. et al. Digital image processing using LabVIEW. Practical Applications and Solutions Using LabVIEW™ Software, 2011, p. 297-316.
- Marsov V., Ilukhin A., Mintsaev M., Khakimov Z., Aliev S. Fuzzy logic in automatic control of concrete thermal treatment using shuttering with heating Ilukhin elements. International Journal of Environmental and Science Education. 2016. Vol. 11. Iss. 18, p. 12803-12809.
- Graboskwi S, Bienieck W. A two-pass median-like filter for impulse noise removal in multi-channel images. KOSYR. 2003. Vol. 1, p. 195-200.
- Kim S.M., Lee Y.C., Lee S.C. Vision based automatic inspection system for nuts welded on the support hinge. 2006 SICE-ICASE International Joint Conference, 18-21 October 2006, Busan, South Korea. IEEE. 2006, p. 1508-1512. DOI: 10.1109/SICE.2006.315371
- Koteleva N., Bekenev K., Valnev V. Augmented reality system and maintenance of electromechanical equipment in industrial production. Youth Technical Sessions Proceedings: VI Youth Forum of the World Petroleum Council-Future Leaders Forum (WPF 2019), 23-28 June 2019, St. Petersburg, Russia. CRC Press. 2019, p. 156-163. DOI: 10.1201/9780429327070-22
- Litvinenko V.S. Digital Economy as a Factor in the Technological Development of the Mineral Sector. Natural Resources Research. 2020. Vol. 29. Iss. 3, p. 1521-1541. DOI: 10.1007/s11053-019-09568-4
- Khudyakova T.M., Kolesnikov A.S., Zhakipbaev B.E. et al.Optimization of Raw Material Mixes in Studying Mixed Cements and Their Physicomechnical Properties. Refractories and Industrial Ceramics. 2019. Vol. 60(1), p. 76-81. DOI: 10.1007/s11148-019-00312-2
- Sytko I.I., Kremcheeva D.A. Instrumentation for measuring the parameters and characteristics of four-poles. International Journal of Mechanical Engineering and Technology. 2017. Vol. 8. Iss. 10, p. 844-854.
- Ushakov E., Aleksandrova T., Romashev A. Neural network modeling methods in the analysis of the processing plant’s indicators. International Scientific Conference Energy Management of Municipal Facilities and Sustainable Energy Technologies (EMMFT 2019), 10-13 December, Voronezh, Russia. Springer, 2020. Vol. 1259 AISC, p. 36-45. DOI: 10.1007/978-3-030-57453-6_4
- Valkov V.A., Kuzin A.A., Kazantsev A.I. Calibration of digital non-metric cameras for measuring works. International Conference Complex equipment of quality control laboratories 17-19 July 2018, St. Petersburg, Russia. Journal of Physics: Conference Series. 2018. Vol. 118. Iss. 1. DOI: 10.1088/1742-6596/1118/1/012044
- Zadeh H.G., Janianpour S., Haddadnia J. Recognition and classification of the cancer cells by using image processing and labview. International Journal of Computer Theory and Engineering. 2013. Vol. 5. N 1, p. 104-107. DOI: 10.7763/IJCTE.2013.V5.656