
Dynamic simulation of industrial-scale gibbsite crystallization circuit
- 1 — Ph.D. Head of Department RUSAL Engineering & Research Center ▪ Orcid ▪ Elibrary ▪ Scopus
- 2 — Dr.Habil. professor Saint Petersburg Mining University ▪ Orcid ▪ Elibrary ▪ Scopus ▪ ResearcherID

Abstract
Population balance model is crucial for improving the method of aluminum hydroxide massive crystallization and enhancing the quality of control over industrial precipitation trains. This paper presents the updated population balance model, which can be used for simulation of industrial-scale precipitation. Processes of birth-and-spread and particle breakage are considered integral parts of the precipitation process along with secondary nucleation, growth and agglomeration of particles. The conceptual difference of the proposed system of equations is its ability to reproduce the oscillatory process that occurs in precipitation circuits as a result of cyclic changes in the quality of the seed surface. It is demonstrated that self-oscillations can occur in the system without any external influence. The updated model is adjusted and verified using historical industrial data. The simulation of seed-recycle precipitation circuit showed an exact correspondence between the calculated dynamic pattern of changes in particle size distribution of aluminum hydroxide and the actual data.
None
Introduction
The seeded massive crystallization of aluminum hydroxide from supersaturated pregnant liquor is well reported in literature. Depending on the composition of the solution, temperature and presence of growth modifiers or additives, crystallization of aluminum hydroxide can occur in the form of bayerite, gibbsite, boehmite, or an amorphous phase. Under the conditions of the Bayer process, the formation of aluminum hydroxide crystals takes from several days to several months. Industrial precipitation proceeds at various temperatures and supersaturation in the battery of precipitators.
Equations governing the rate of linear growth, agglomeration, secondary nucleation and breakage of crystals are well-known [12, 19, 21, 27]. The equation of population balance of the crystals during precipitation is widely applied, and several methods are used to solve this equation [4, 10, 14]. Verified mathematical models were developed to describe the units of precipitation circuits: classifiers, hydrocyclones, filters, agitators [18, 20, 22]. From this set of formulas, software specialists can easily generate a single equation system that can be solved using well-established simulation methods of the process systems [24, 25]. Methods for adjusting the population balance equation and its components were proposed, and a large amount of simulation experiments were carried out for periodical and semi-periodical tests without seed recycle [9, 13, 16]. However, the indicated methods have their limitations in describing the results of industrial seed-recycle precipitation and predicting its development in dynamic mode. The problem lies in the fact that existing models of growth, agglomeration and nucleation are too conservative. When using these models, the results demonstrate quick damping of oscillations and transfer to a steady-state mode, which contradicts the industrial observations [5].
The present paper explains the reasons behind the occurrence of dynamic waves of changes in particle size distribution (PSD) and liquor productivity; the authors also attempt to refine the equations of the population balance model to enable their use for simulation of dynamic changes in industrial precipitation circuits with aluminum hydroxide seed recycle.
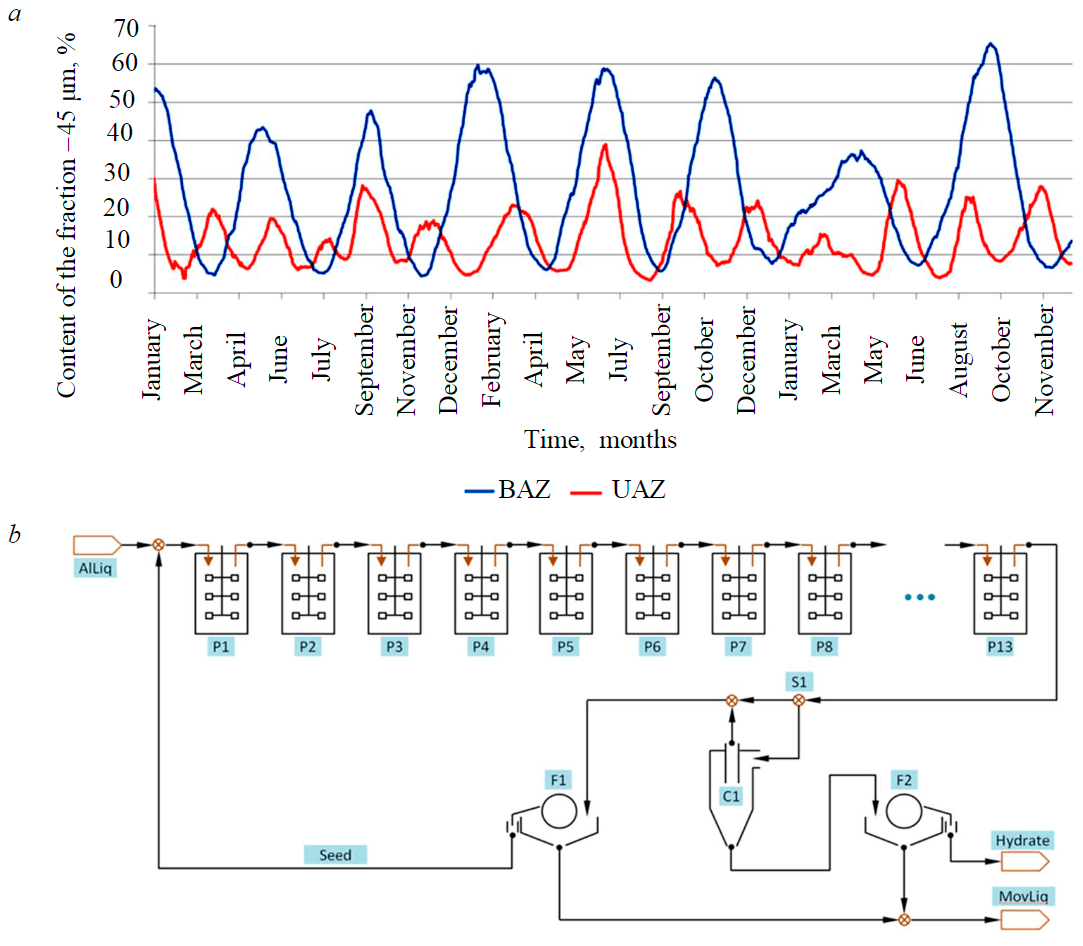
Fig.1. Fluctuations in the content of –45µm fraction in the seed of precipitation trains at Bogoslovsk and Urals alumina refineries over 3 years (a) and a process flow diagram of the precipitation train of aluminate liquor at UAZ alumina refinery (b)
Methodology
Process data. A typical example of significant instability of seed properties and liquor productivity is the systems that do not have fine crystals agglomeration upstream of the precipitation. Oscillating process of such systems gets at times too extensive, and at certain points creates the risk of producing alumina, the granularity of which is not compliant with specifications.
The process data (Fig.1, a) characterize the operation mode of precipitation areas at two alumina refineries, located in the Russian Federation: Urals (UAZ) and Bogoslovsk (BAZ) alumina refineries. The diagrams demonstrate the dynamics of fluctuations in the content of –45 µm fraction; regular changes of PSD can clearly be seen – with a period of around 2-3 months at BAZ and 1-2 months at UAZ. The amplitude of observed oscillations changes, their period is quite constant, and occurrence of the next extreme point seems inevitable.
Both refineries process boehmite-diasporic bauxites and use medium temperature digestion without sweetening. The caustic concentration in the pregnant liquor to precipitation amounts to 240-260 g/l (as Na2CO3); so, during precipitation A/С ratio in the liquor reduces from 0.55-0.57 to 0.28-0.31. Fine-seeded agglomeration is not very effective, therefore control of the precipitation process amounts to changing the temperature in head and tail precipitators, as well as altering the cones in product hydrocyclones (at UAZ).
One of the main objectives of such control method is to determine the best moment and level of involvement, so that control takes place in reversed phase to the natural flow of the process and its extent is adequate.
By using standard methods (microscope observations and laser analysis of particle sizes), it is possible to detect the coarsening or degradation after they have already started. In practice, attempts to take some preventive action prior to the appearance of instrumental signs of degradation or coarsening often resulted in a loss of control over the process. In this case, the peaks of –45 µm fraction content reached 1-3 % by the end of the coarsening phase, whereas in the degradation phase they run up to 60-70 %. In case of extensive coarsening, the yield of the area could decrease by 1.5 times.
The changes in the content of certain particle grades, productivity, composition of the liquor, temperature and concentration profiles of precipitation at UAZ and BAZ refineries have been monitored for 15 years; process parameters are registered on a daily basis. It provided for the sufficient amount of data to study gibbsite crystallization under process conditions and to verify the simulation methods. Significant fluctuations, registered during observations, proved to be very useful for the present study.
A precipitation area at UAZ refinery was selected as the main object of research. At the refinery there are several precipitation trains of various capacity, but the general layout of their arrangement is identical (Fig.1, b). Precipitation of the liquor is conducted in a single stage. Batteries of hydrocyclones are used as classifiers. Only a part of the slurry flow is fed to classification in order to separate coarse fractions. The product hydrate, represented by hydrocyclone underflow, is filtered using vacuum filters and supplied to washing. The major share of the slurry flow from the last precipitator bypasses hydrocyclones and together with hydrocyclone overflow is fed to the station of seed filtration.
Population balance model. The fundamental equations used in the study are the equations of population and mass balance, which associate the precipitation level of aluminate liquor with the changes in the properties of aluminum hydroxide crystals [21]:
where ni is the number of the ith grade particles; Li is the size of the ith grade particles, m; $\frac{\delta n_i}{\delta t}$ – the rate of change of particle number of certain size u over time in the slurry volume, 1/(m4·s); G is the linear rate of crystal growth, m/s; Bi, Di are the rates of formation and disappearance of the ith grade particles as a result of their occurrence and transfer between grades, respectively, 1/(m4·s); A is Al2O3 concentration in the liquor, g/l; M[Al2O3], M[Al(OH)3] are the molar masses of Al2O3 and Al(OH)3, respectively, kg/mol; rА is the density of aluminum hydroxide, kg/m3.
Models of growth and agglomeration. Equations (1)-(2) are solved simultaneously with expressions for crystal rates of linear growth and agglomeration, used in similar studies:
-
model of linear growth rate of the particles, independent of particle size [27]:
where k0is the pre-exponential factor of the linear growth rate constant; Eact is the activation energy of the reaction, J/mol; T is the temperature, K; Aeq is the equilibrium concentration of alumina in the liquor, g/l; z1 is the index of power at supersaturation;Сis the caustic concentration of Na2CO3, g/l;
- agglomeration model with a probability function, dependent on particle size, can be formulated for each particle grade as follows [11, 15]:
where v,u are the coordinates of particle in PSD; n is the number of particles in a volume; β(v,u) is the function, expressing the agglomeration probability of v- and u-sized particles (agglomeration kernel); kc – is the proportionality factor in the agglomeration model; b4 is the correction to accommodate agitation conditions in the precipitator; G – particle linear growth rate.
The first part in formula (4) describes the increment of particles in the analyzed v grade due to agglomeration of finer particles (from 0 to v), and the second part means the decrease of particles in the analyzed grade due to binding to agglomerates with other grades of particles.
Model of secondary nucleation. The rate of secondary nucleation or nucleation rate at the left boundary of the PSD (1/m3∙s) is usually calculated at a constant rate of nuclei formation per unit area of phase contact [19]:
where kn is the adjustable constant of nucleation rate, 1/(m3s); Ssl is the phase interface area in the slurry volume, 1/m; z2 is the supersaturation exponent, in paper [19] = 2.
Breakage model. The breakage of particles is usually associated with their attrition and cracking. Attrition results in insignificant changes in the size of the initial particles and formation of new nucleus-sized ones. In this sense, attrition is similar to contact nucleation so we will not analyze it separately and the term breakage means only an action of breaking of a particle to form new two similar particles, i.e. binary breakage.
where ϑ(t, u) is a function of breakage probability of uth grade particle at tth moment; the first part on the right-hand side of equation (7) represents the occurrence of uth grade particles due to breakage of coarser particles, and the addend corresponds to their breakage; n – number of particles in a volume.
Simplification of equation (7) for binary breakage provides the following:
Probability of particle breakage can be expressed by a power-law dependence [23]:
where kb and p are adjustable constants used to consider the ratio of shear forces in the fluid and internal cohesive forces in particles; ϒ – is the shear rate, с–1; $\overline{m}$ is the normalized first moment of crystal population in a volume, 1/m2.
Hydrocyclone model. To complete the mass balance of precipitation along the seed classification contour, a hydrocyclone model proposed by Nageswararao was applied. The model was used to estimate classification size of the hydrocyclone:
where KD0 is the correction factor for the classification size; Dc, Di, Do, Du are diameters of the cyclone, inlet, vortex finder and spigot, respectively, m; Lc is the length of cylindrical section of the cyclone, m; H is the hydraulic head, m; θ is the center angle of the conical section of the cyclone, deg; l is the hindered settling ratio, calculated by the following formula:
where CV is the volumetric fraction of feed solids.
The part of the liquid, discharged through the cone of the hydrocyclone (recovery of liquid to underflow), is calculated by the following formula:
where Kw0 is the correction factor.
Fractional efficiency of particle capture was calculated using Whiten equation [2]:
where a, ω, ω* are adjustable constants.
Oscillation character. There are different explanations for regular PSD fluctuations in seed-recycle precipitation circuits. Some authors point to the randomness of the process and fractal structure or roughness of the particles [28]; others associate the fluctuations with hydrate classifiers, which can cause PSD oscillations due to accumulation of aluminum hydroxide in the amounts, comparable to the solids amount in the precipitators [6]. The latter case, known in the theory of automatic control as a transport lag, under certain conditions can cause oscillations in the system, including non-damping ones. However, it does not explain the occurrence of a strong oscillatory process in crystallization circuits at UAZ, where seed classifiers are not used, and at BAZ, where aluminum hydroxide is not classified at all.
Under real process conditions, PSD fluctuations are also caused by perturbations of the flow rate, concentration, ratio and impurity content of the pregnant liquor [12], changes of daily ambient temperature, routine maintenance and shut-downs, and many other random factors. Nevertheless, no factor can explain the frequency, regularity and amplitude of the basic mode of oscillations shown in Figure 1, a.
A standard recommendation on nucleation control is monitoring and maintenance of a stable ratio of absolute supersaturation to full seed surface ΔС/Ssl [26]. Performed statistical analysis of industrial data from UAZ and BAZ refineries showed that the correlation between the rate of PSD changes and the ratio of supersaturation to full seed surface ΔС/Ssl is very weak (determination factor R2 is less than 0.1). Therefore, the recommendation is not applicable for these refineries.
As a working hypothesis on the character of oscillations, an assumption was adopted in the present study that the driving source of the longest wave of PSD fluctuation has natural causes and is associated with seed surface properties. This assumption complies with the generally accepted opinion that the moment, when the nuclei start actively passing into the liquor, is associated with a decrease in number density of linear growth centers on the surface of the crystal [7].
Birth-and-spread model. According to crystallization theory, the processes of growth and nucleation have a common beginning, which involves molecule adsorption on the surface of a particle with partial loss of the solvation sphere (Fig.2, a). Initial attachment of the molecule occurs on a flat, energetically least favorable site of the particle (Fig.2, b). Then the absorbed molecule migrates along the surface and overcomes energy barriers 3 and 5 to reach more favorable sites for fixation4 and 6 [7].
In case route 3 is unavailable, ripening of the nucleus and addition of new molecules will occur on the flat site; in this case the bond between this group of molecules and the base one will be the weakest, and subsequent separation of the nucleus by external mechanical force is most likely to happen.
Taking into consideration the indicated mechanism, the adsorption process of embryos on the seed surface does not depend on surface quality and is determined only by its area, diffusion factor, diffusion layer thickness and liquor supersaturation. Thickness of the diffusion layer can be considered conditional-constant at a fixed agitation rate. According to Stokes-Einstein formula, the diffusion factor depends on temperature, but there is no need to consider its impact separately, as in the first approximation this impact can be taken into account when tuning the index of power during supersaturation. Hence, to calculate embryo adsorption rate on the seed surface, equation (6), proposed for secondary nucleation, can be used without alterations.
Energy consumption, associated with the embryo navigating routes 3 and 5 (Fig.2, a, b), characterizes the probability of its transfer from seed surface to the liquor. If these routes are shortened, mainly due to agglomerate formation, increasing surface fractality and leading to generation of numerous growing sites on the crystal, the probability of nuclei fixation on the seed surface increases, while the inverse probability of nuclei passing into the liquor decreases.
As the particle grows and its shape improves, these routes get longer, embryo fixation in the growing points of the parent particle deteriorates, and the embryo has more chances to form its own growing point and to pass into the liquor as a nucleus.
It is proposed to describe birth-and-spread as a two-stage process, during which an embryo is formed on the surface and then grows together with the particle, if suitable vacant sites are available near the fixation site (Fig.2, c). The process rate is proportional to the product of two probabilities – the probability of embryo absorption on the seed surface and the probability of its firm bonding with the surface. Therefore, the expression for birth-and-spread rate will be written as follows:
or
where k1 is a dimensionless coefficient, considering other factors; Nv/Ne = nv is the number of available vacant sites for one embryo; = nv/ is the number density of available vacant sites per unit surface of the particle, $\sum_i(S_{fi}\mu_i)$ is the average surface vacancy over total particle population.
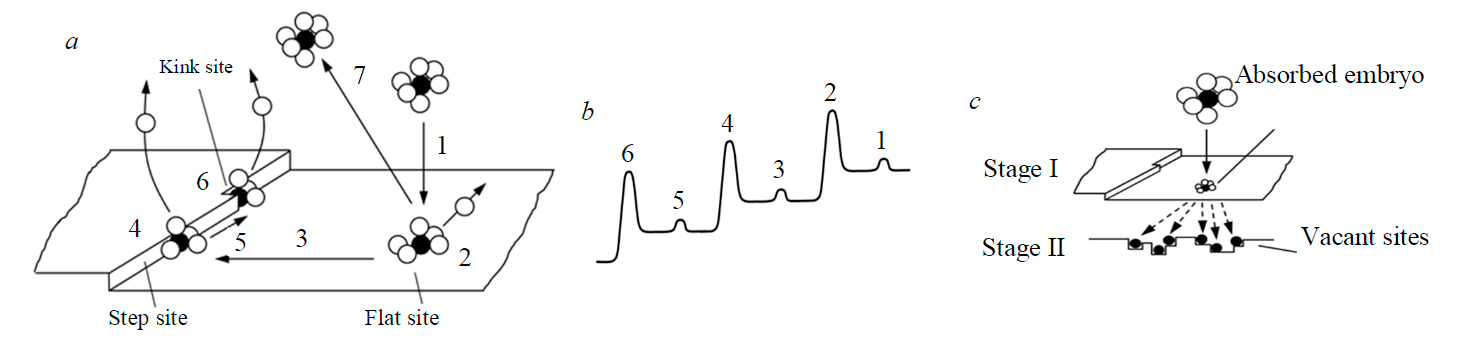
Fig.2.The energetics of crystal growth from the solution: movement of the solvated solute molecule (a); corresponding energy changes for each transformation [8] (b); sequence of nuclei bonding to the sites as a result of birth-and-spread (c)
The number density of available vacant sites is an expression of seed surface quality. It decreases as a result of prolonged growth of the particle and increases during agglomeration. Consequently, for the population of particles with prevailing agglomerates it will be higher than for the population with a small fraction of agglomerates. In this way, the fraction of agglomerates can be related to the number density of vacant sites. In order to avoid using absolute values of the number of vacant sites, a transition to relative values is required:
where µa and µg are number densities of available vacant sites for agglomerates and growing particles, respectively, 1/m2; and are the fractions of agglomerates and growing particles, respectively;$\mu_a/\mu_g=\overline{µ}$ is the value expressing how much the probability of an embryo binding with the agglomerate surface exceeds the same probability for the growing particle.
Assuming µgto be constant, expression (15) for birth-and-spread rate with due account of formula (16) can be rewritten as follows:
where ks = k1mg is an adjustable constant.
The fraction of agglomerates fa is a relative notion, as the same particle can be a newly formed agglomerate of two particles or an agglomerate, which for a long time has been growing as a single particle. For the sake of consistency, the authors suggest that particles are divided into agglomerates and non-agglomerates in the moment of their transfer between size grades. At each iteration, when new particles emerge in the grade, it will enable to register their type and calculate a new fraction of agglomerates in the grade. If the particle in the analyzed grade is formed as a result of nucleation, linear growth or breakage, it is classified as a common particle; if its formation is associated with agglomeration process, it is treated as an agglomerate.
Discussion
Updated model of secondary nucleation. Taking into consideration the competition between secondary nucleation and birth-and-spread processes, with due account of formulas (6) and (17), the expression for the rate of nuclei passing into the liquor can be formulated as follows:
or
where B0 is the rate of nuclei transition to the liquor, 1/(m3·s); BM is the overall rate of nucleation on the particle surface, calculated using formula (6), 1/(m3·s); BS is the rate of birth-and-spread process, 1/(m3·s) BM/BS is the ratio between the rates of secondary nucleation on the particle surface and birth-and-spread process.
kn, ks and $\overline{µ}$ parameters in formula (19) are adjusted in a dynamic mode in the process of model tuning by simulating actual PSD oscillations
Updated breakage model. Equation (8) adopted the binary pattern of particle breakage. In order to consider the possibility of multiple sequential breakages under such conditions, the breakage probability function for particles of different fractions needs to be introduced. For this purpose, a Gaussian function was used in the study, the peak of which corresponds to the size of particles that break the most:
where F(u) is the breakage intensity of the uth grade particle, 1/(m3·s); L* is the size of the particles that break the most, m.
The presence of multiple impurities hinders layer-by-layer linear growth of the particles, which causes formation of irregular particles and dendrites, poorly connected to the basis and prone to shearing. Such particles form during the period of active agglomeration, especially if it occurs at low temperatures. Similar to the birth-and-spread model, in order to consider the intensity of particle breakage in each grade, the fraction of agglomerates fa(t, u) can be used. After supplementing the equation of particle breakage probability (9) with new parameters, the following equation is obtained:
Thus, the proposed updated model of particle breakage consists of equations (8), (20) and (21).
Oscillatory process features. The introduced equations, comprising agglomeration model (4)-(5), updated nucleation model (19) and updated breakage model (8), (20) and (21), can be simplified and combined in a separate subsystem of ordinary differential equations
where
where $ N^{.}_{g.n},N^{.}_{g.a}, N^{.}_{g.b}$ are terms, indicating the change rate of growing particle number due to nucleation, agglomeration and breakage, respectively; $N^{.}_{g.b},N^{.}_{a.a}, N^{.}_{a.b}$ are terms, indicating the change rate of agglomerate number due to nucleation, agglomeration and breakage, respectively; $N_{g}(t),N_{a}(t)$ are the numbers of growing particles and agglomerates, respectively; $f_a=N_a(t)/[N_g(t)+N_a(t)]$ is the fraction of agglomerates in the population; $N_g(t)+ N_a(t)$ is a simplified assumption for full surface of the particles Ssl in formula (19); $k_{n1}, k_{n2}, \phi, k_{ga},k_{gg},k_{aa}, k_{b}$ are constant factors.
The system of equations (22)-(27) is solved under initial conditions $ dN_g(0)=n_g$ and $ dN_a(0)=n_a$. Mass sources and sinks were excluded from the system, liquor properties were assumed constant, particle growth was not taken into account. Under such conditions, the system can be analyzed for self-oscillations only in respect to seed surface properties.
The use of a specific set of values (e.g., kn1 = 0.07; kn2 = 0.8; φ = 3.33; kga = 8×10⁻⁴, kgg = 6×10⁻³; kgg = 8×10⁻⁴; kb = 0.001; ng = 0.01; na = 0.01) when solving a system of equations (22)-(27) results in occurrence of non-damping oscillations (Fig.3). With a different set of parameters, the oscillatory process can reach an equilibrium state. If any term is excluded from the system, self-oscillations cease.
The structure of equation system (22)-(27) is similar to a well-established Lotka-Volterra model of predator-prey relationships [17], only in the course of precipitation the competition takes place between growing particles and agglomerates as a result of secondary nucleation, birth-and-spread, agglomeration and breakage processes.
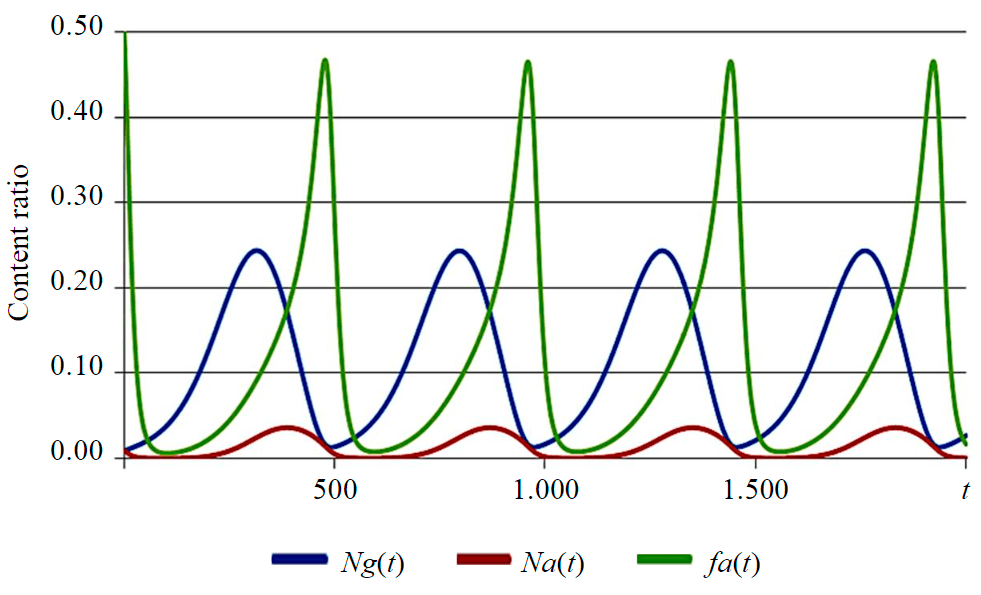
Рис.3. Self-oscillatory process in a closed loop system during precipitation Ng(t) – growing particles; Na(t) – agglomerates; fa(t) – fraction of agglomerates
Numerical simulation. Numerical simulation is performed using PrecipExpert software, integrated with the obtained model [1]. The software enables to create flow diagrams of industrial-scale precipitation from separate units, locate them on the worksheet and connect in the required order. The system of population balance equations is solved using discrete method [10, 14].
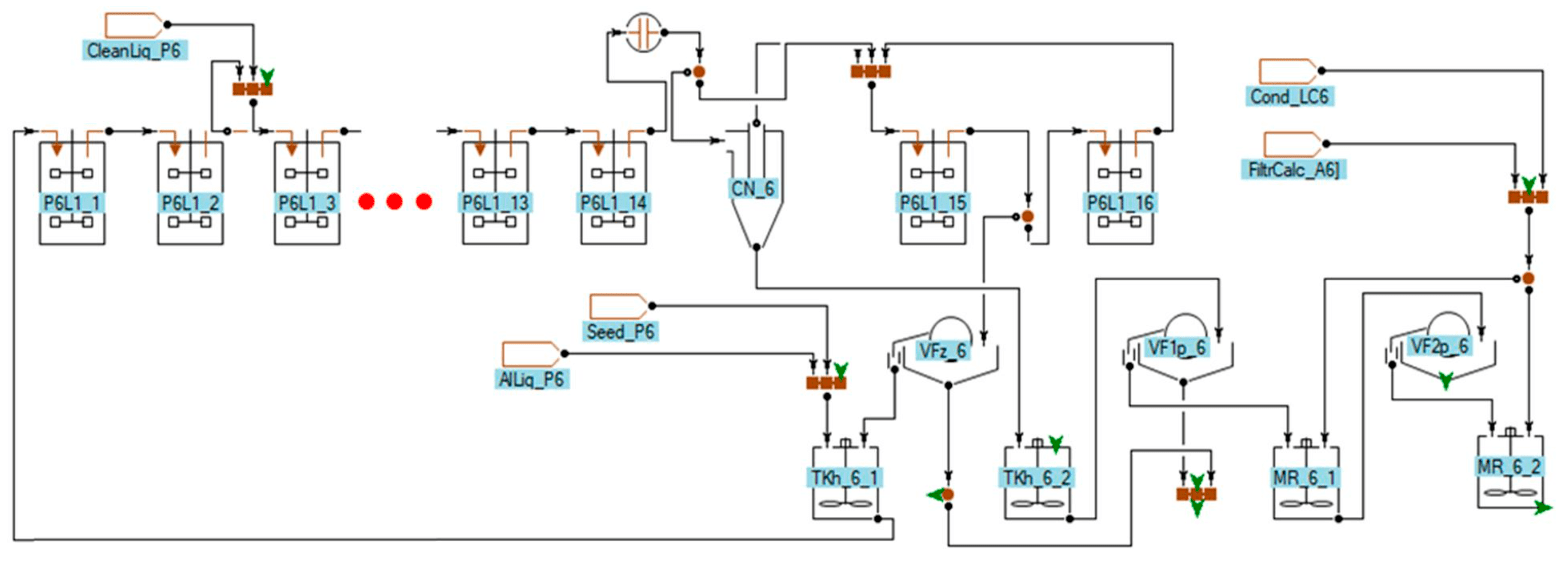
Fig.4. Flow diagram of the industrial-scale precipitation train used in the simulation
P6L1_1-P6L1_16 with the volume of 3500 m3, a battery of hydrocyclones CN_6, a seed filter VFz_6, a product separation filter VF1p_6, a first stage washing filter VF2p_6 and agitators. Preg-nant liquor and seed, inherent to the current precipitation train, are fed to the mixer TKh_6_1, the seed from another precipitation train is fed to this mixer. Additionally, the flow of liquor and finely-dispersed aluminum hydroxide CleanLiq_P6, generated in the process of chemical cleaning of pre-cipitators, is considered.
Different periods of precipitation train operation were selected for training and prediction. Initial data were taken from the historical database of the refinery and additional reports, which were added into the model in a dynamic mode during the solution process. The initial data were updated once a day, daily average values were used. Preparation of the initial data involved only removing outliers; data smoothing was not applied. The following parameters were loaded to the model as initial data: flow rate and composition of the pregnant liquor, solid concentration in the first precipitator, temperature in the precipitators, number of hydrocyclones in operation, spigot diameters of hydrocyclones, flow of additional seed from another precipitation train, volumes and compositions of liquors, supplied after cleaning of precipitators.
Data on aluminum hydroxide PSD were introduced to dynamic calculations only once, at the beginning. Then followed a short period of model self-tuning. The rest of the time, the PSD of aluminum hydroxide in each precipitator and the station was calculated by the model along with liquor compositions in all intermediate and outlet flows.
The system of population balance equations was solved using a mesh, comprising 30 grades:
Flow exchange period between the units (external transportation problem) amounted to 10 minutes; the population balance model was solved at a time step of 150 s. Execution time of one dynamic calculation over the period of 1.5 years was approximately 8 hours using a CPU with 133 GFlops.
The tuning of the model was performed in two stages. At the first stage, factors of growth, agglomeration and breakage models were selected for average values of all input parameters under steady-state conditions. In the growth model (3), k0 parameter was adjusted in such a way that the estimated ratio of the pregnant liquor corresponded to the average value for the monitored period, when the process reached a stable state. In a similar manner, the average content of –1 µm, –5 µm, –20 µm, –45 µm particles were adjusted by selecting factors kc in formula (5), δ in formula (20), kb and p in formula (21). The contents of the coarsest grades +100 µm and +125 µm were adjusted by changing hydrocyclone parameters and the curve of fractional particle capture efficiency (10)-(13).
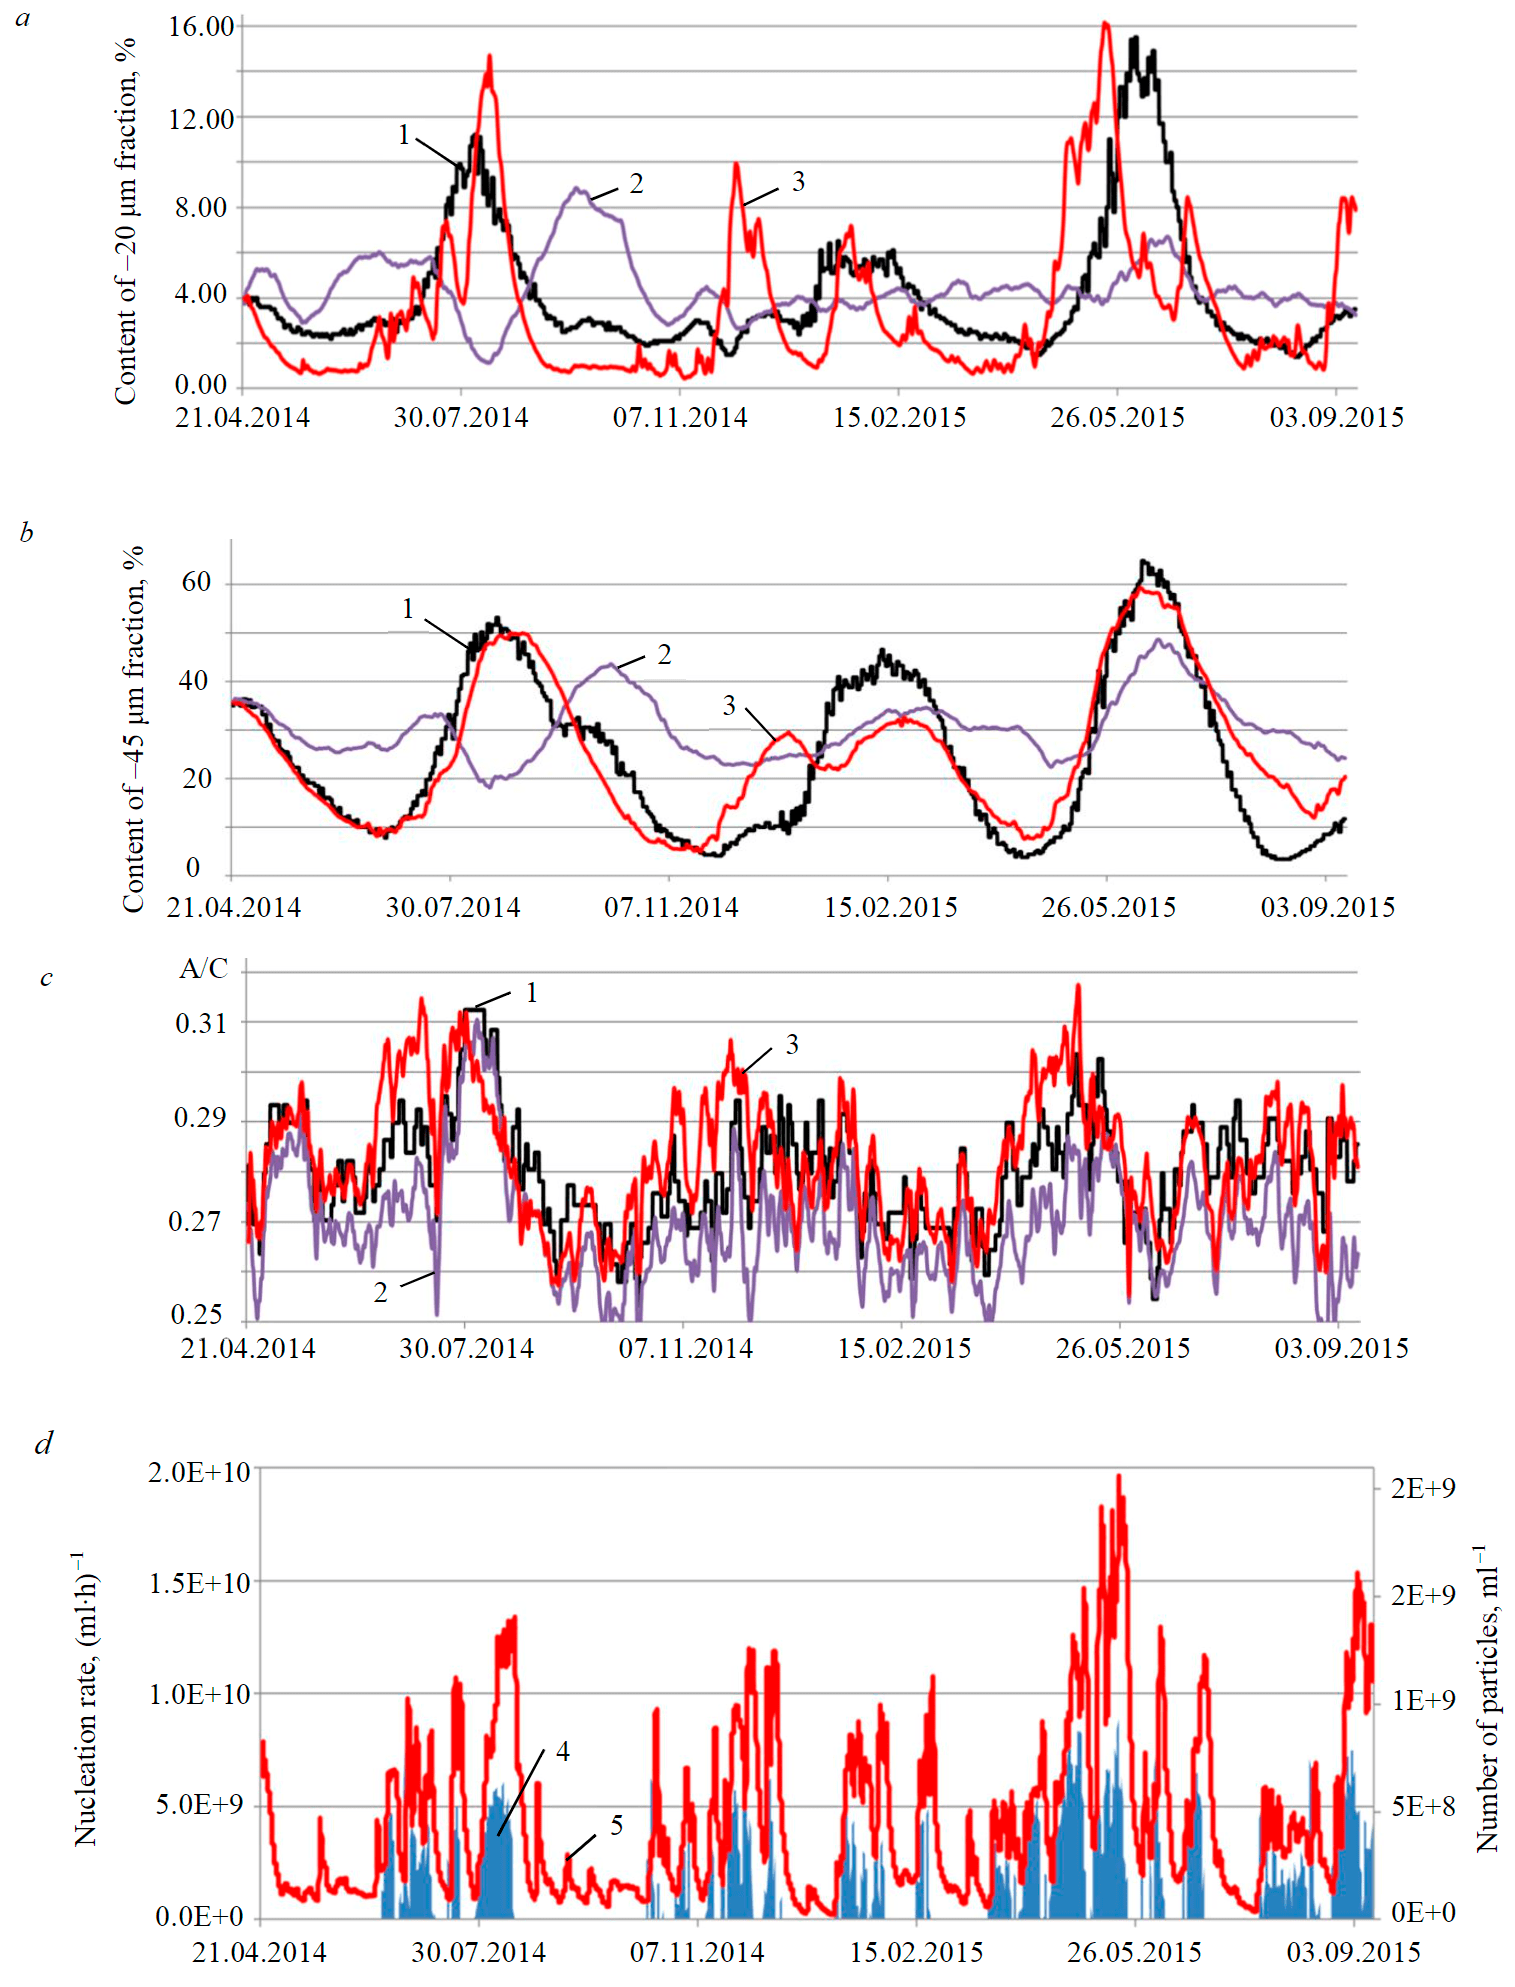
Fig.5. Simulation results of industrial-scale circuit of aluminum hydroxide precipitation in a dynamic mode: content of –20 μm fraction (a); –45 μm fraction (b) in the tail precipitator; A/C ratio in the spent liquor (c); calculated rate of secondary nucleation and crystal population per unit volume of slurry (d) 1 – experiment; 2 – initial model; 3 – updated model; 4 – nucleation rate; 5 – number of particles
The second stage of model tuning comprised the selection of , and factors in formula (19) in a dynamic mode. Several calculations were performed in parallel for different factor values. Optimum values were determined by means of comparing calculated curves of particle size changes with actual process data. Least square method was used for quantitative estimation of the simulation quality. As a result of model tuning, the following set of factors for the model was obtained: kn = 330; Eact = 6.32×10⁵; z1 = 4; ks = 0.61; kb = 0.95; p = 1; $\overline{µ}$ = 3.33; d = 2.5; kn = 1×10¹⁴; z2 = 2; ks = 12.
Quality tuning was also performed for the initial model, in which nucleation was described using formula (6), and breakage was described using formulas (8) and (9).
Results
The initial population balance model for precipitation and the updated model with suggested modifications – the equation (6) in nucleation model was replaced with (19), the equation (9) in the breakage model was replaced with (21) and supplemented with equation (20) – were solved under the same initial conditions and environmental variables. Duration of the simulation period amounted to 17 months. Over this period, three complete cycles of PSD fluctuations were registered.
The dynamics of changes in two most important particle grades –20 and –45 μm, calculated using the models and compared to the process data, is presented in Fig.5, a, b. Over the analyzed period, along with three maximum and four minimum peaks, the content of the main fractions demonstrated a large amount of minor fluctuations, which can be attributed to changes in the external factors. These factors produced a significant impact on both calculations. The prediction, obtained by the initial model, was not satisfactory. Calculated and actual waves were out of phase, and the amplitude of predicted fluctuations was approximately two times smaller than the actual one. The updated model reproduced the dynamics of PSD fluctuations much more accurately. For practical purposes it is important that the updated model can accurately predict the occurrence of PSD peaks and their amplitude. The Table specifies detailed statistics on the quality of simulations.
Simulation quality
|
Parameter |
Initial model |
Updated model |
||
|
Correlation ratio |
MSD, % |
Correlation ratio |
MSD, % |
|
|
Deviation in the peak content |
|
|
|
|
|
coarsening phase |
–0.21 |
17.5 |
0.65 |
1.55 |
|
degradation phase |
0.55 |
19.7 |
0.97 |
7.75 |
|
Fraction content, µm: |
|
|
|
|
|
–5 |
0.06 |
0.82 |
0.14 |
0.94 |
|
–10 |
–0.10 |
0.69 |
0.27 |
1.21 |
|
–20 |
–0.02 |
2.37 |
0.53 |
2.24 |
|
–30 |
0.16 |
7.00 |
0.80 |
3.47 |
|
–45 |
0.21 |
14.0 |
0.78 |
6.06 |
|
–63 |
0.60 |
17.1 |
0.85 |
9.22 |
|
+100 |
0.55 |
9.6 |
0.80 |
6.85 |
|
+125 |
0.58 |
4.95 |
0.83 |
4.24 |
|
A/C ratio in the mother liquor |
0.86 |
0.011 |
0.68 |
0.008 |
Deviation in the peak date of the coarsening phase is three days, of the degradation phase – 7 days.
Significant discrepancies in the content of –45 µm fraction between new model calculations and actual data in January and September 2015 are explained by the fact that prior to these two periods the system was subject to a strong external impact – within 1-2 days seed concentration in the slurry decreased sharply from 820-850 to 450-500 g/l. After that, fine seed from another precipitation line was added to the process; under the conditions of the problem, it did not contain any agglomerates. The model reacted to these actions by a consistent decrease in particle breakage rate, increase in agglomerate content, growth of secondary nucleation and, consequently, a reduction in the number of new nuclei passing into the liquor (Fig.5, d).
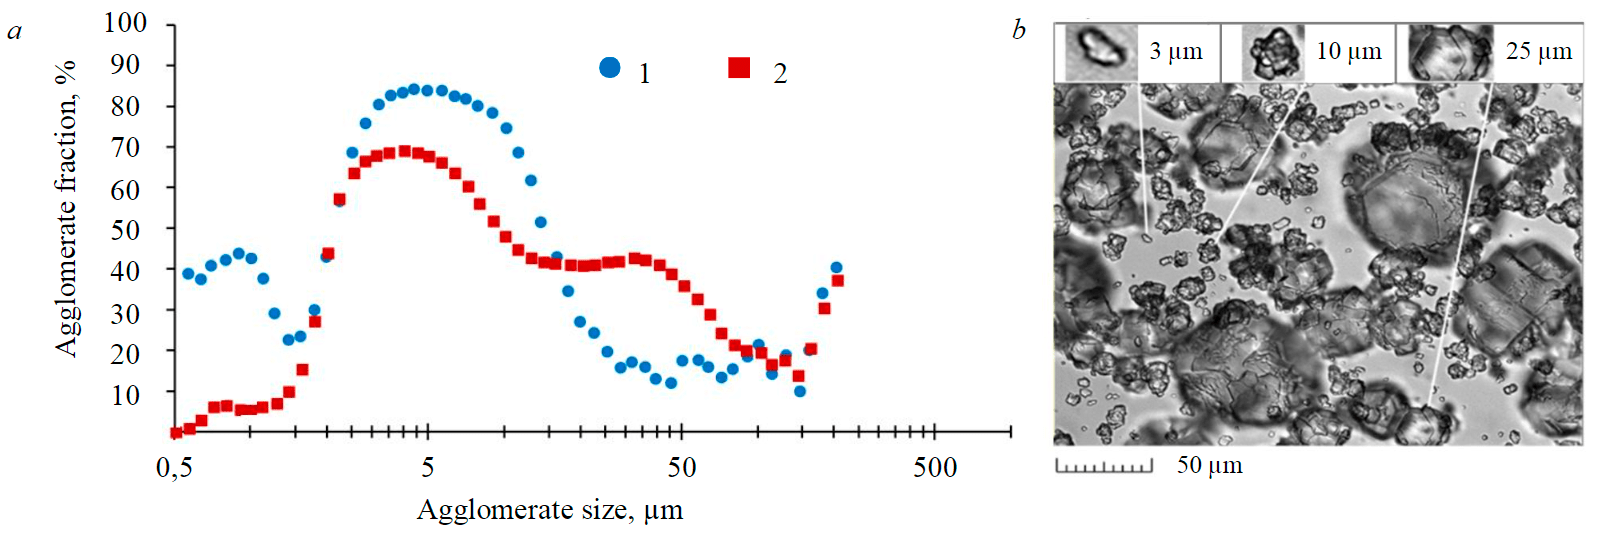
Fig.6. Agglomerate fraction in crystal population depending on particle size: a –calculation results; b – micrograph Content of –45 μm fraction: 1 – minimum; 2 – maximum
After failed results of simulation in January 2015, the new model corrected itself by demonstrating the next maximum peak of –45 µm fraction content in February and the minimum peak in April 2015.
The best agreement between the calculation results and the observations was achieved for A/C ratio in the spent liquor (Fig.5, c). Strong noise in the diagram is explained by fluctuations of composition and flow rate of the aluminate liquor and addition of seed from other areas, whereas the apparent wave is associated with changes in specific surface area of the intrinsic seed.
According to simulation results, the majority of agglomerates occur within the size ranges of 0.5-1.0 and 4-16 µm (Fig.6, a). The presence of the first peak aligns with the notion that 0-2 µm particles demonstrate an intensified growth compared to the remaining population [7]. Constant presence of the second peak is registered by means of microscopic investigation, which proved that particles of approximately 10 µm size are characterized by strong fractality (Fig.6, b).
According to simulation results, the agglomerate fraction in particle grades is not constant and subject to fluctuations just like other properties of particle population. In the periods of seed coarsening the agglomerates get coarser too, which causes the first peak in their content to disappear. In the periods of seed degradation, the agglomerate fraction in finer particle grades increases (Fig.6, a).
As a result, the updated model after performed tuning demonstrates a good predictive power for the content of coarse particles – the correlation ratio is within the range of 0.78-0.85, and mean square deviation, e.g. for –45 µm fraction, amounts to 6 %. As the particles get finer, predictive accuracy decreases. To control the precipitation process, it is critically important that the use of the updated model enabled to achieve adequate predictive accuracy for the coordinates of the next inflection point in the fluctuation curve of the –45 µm fraction content (see Table).
Conclusions
- Basing on the performed study, a conclusion can be drawn that the birth-and-spread process is one of the forms of particle population development during precipitation of pregnant liquor at low temperatures. It is governed by seed activity, accelerating simultaneously with agglomeration and slowing down with the reduction of agglomerate fraction in the population. Birth-and-spread serves as an inhibitory process, which hinders the ingress of secondary nuclei into the liquor.
- The competition between the processes of secondary nucleation, agglomeration and breakage of particles gives them properties of an oscillatory system. These oscillations are stable and under certain conditions can become non-damping.
- To determine fixed points, oscillation phases and the rate of exciting processes, a new property of the population can be introduced – the fraction of particles represented by agglomerates in different size grades.
- The absence of parameters characterizing seed surface quality in the equations (6) and (9), which express the intensity of nucleation and particle breakage, limits their application to crystallization circuits with fine seed agglomeration at high temperatures. Controlled agglomeration enables to supply active seed to the second stage of precipitation and to control the population of agglomerates. This significantly decreases the amplitude and oscillation period for PSD and liquor productivity. In single-stage precipitation circuits at low temperatures it is impossible to maintain constant activity of the seed surface, and that must be considered in mathematical modeling.
- The proposed updated models of nucleation, birth-and-spread and breakage processes cannot fully explain all PSD changes, observed during precipitation, as well as available historical data on the process do not reveal all the variability of external conditions. Nevertheless, obtained calculation results demonstrate that the model quite accurately reproduces the phase, amplitude and period of the basic mode of oscillations.
References
- Golubev B.О., Chistyakov D.G. Patent N 2019661712 RF. PrecipExpert computer program. Publ. 05.09.2019 (in Russian).
- Altun O., Benzer H. Selection and mathematical modelling of high efficiency air classifiers. Powder technology. 2014. Vol. 264, p. 1-8. DOI: 10.1016/j.powtec.2014.05.013
- Balakin B.S., Hoffmann A.C., Kosinski P. Population Balance Model for Nucleation, Growth, Aggregation, and Breakage of Hydrate Particles in Turbulent Flow. American Institute of chemical Engineering Journal. 2010. Vol. 56. Iss. 8, p. 2052-2062. DOI: 10.1002/aic.12122
- Bekker A.V., Livk I. An Implicit FEM Solution of a PBE Model of Gibbsite Crystallization with Constant and Nonlinear Kinetics. Industrial & Engineering Chemistry Research. 2011. Vol. 50. Iss. 8, p. 4641-4652. DOI: 10.1021/ie1019326
- Bekker A.V., Li T.S., Livk I. Dynamic response of a plant-scale gibbsite precipitation circuit. Hydrometallurgy. 2016. Vol. 170, p. 24-33. DOI: 10.1016/j.hydromet.2016.06.002
- Bekker A.V., Li T.S., Livk I. Understanding oscillatory behaviour of gibbsite precipitation circuits. Chemical engineering research and design. 2015. Vol. 101, p. 113-124. DOI: 10.1016/j.cherd.2015.07.006
- Dirksen J.A., Ring T.A. Fundamentals of crystallization kinetic effects on particle size distributions and morphology. Chemical Engineering Science. 1991. Vol. 46. Iss. 10, p. 2389-2427. DOI: 10.1016/0009-2509(91)80035-W
- Elwell D., Schell H.J. Crystall Growth from High-temperature Solutions. London: Academic Press, 1975, p. 634. DOI: 10.1107/S0021889876012612
- Farhadi F., Babaheidary M.B. Mechanism and estimation of Al(OH)3 crystal growth. Journal of Crystal Growth. 2002. Vol. 234. Iss. 4, p. 721-730. DOI: 10.1016/S0022-0248(01)01763-8
- Hounslow M.J. A Discretized Population Balance for Continuous Systems at Steady State. American Institute of chemical Engineering Journal. 1990. Vol. 36. Iss. 1, p. 106-116. DOI: 10.1002/aic.690360113
- Anashkin V.S., Teslia V.G., Kuznetcov I.A. et al. Influence of impurities on grain size distribution and morphology of aluminium hydroxide at the precipitation technology. 15th international symposium of ICSOBA “Aluminium Industry within World Economy: Problems and Trends of Development”, 15-18 June 2004, St. Petersburg, Russia. ICSOBA, 2004, p. 148-154.
- Ilievski D., Livk I. An agglomeration efficiency model for gibbsite precipitationin a turbulently stirred vessel. Chemical Engeneering Science. 2006. Vol. 61. Iss. 6, p. 2010-2022. DOI: 10.1016/j.ces.2005.10.051
- Li T.S., Rohl A.L., Ilievski D. Modelling non-stationary precipitation systems: sources of error and their propagation. Chemical Engineering Science. 2000. Vol. 55. Iss. 24, p. 6037-6047. DOI: 10.1016/S0009-2509(00)00210-4
- Litster J.D., Smit D.J., Hounslow M.J. Adjustable Discretized Population Balance for Growth and Aggregation. American Institute of chemical Engineering Journal. 1995. Vol. 41. Iss. 3, p. 591-603. DOI: 10.1002/aic.690410317
- Livk I., Ilievski D. A macroscopic agglomeration kernel model for gibbsite precipitation in turbulent and laminar flows. Chemical Engineering Science. 2007. Vol. 62. Iss. 14, p. 3787-3797. DOI: 10.1016/j.ces.2007.03.030
- Livk I., Pohar C., Ilievski D. Estimation of Batch Precipitation Kinetics by a Simplified Differential Method. American Institute of chemical Engineering Journal. 1999. Vol. 45. Iss. 7, p. 1593. DOI: 10.1002/aic.690450721
- Lotka A.J. Elements of Physical Biology. Baltimore: Williams and Wilkins Co., 1925, p. 495.
- Lynch A.J. Mineral Crushing and Grinding Circuits: Their Simulation, Optimisation, Design and Control. Amsterdam: Elsevier Scientific Publishing Company. 1977, p. 342.
- Misra C. The Precipitation of Bayer Aluminium Trihydroxide: PhD Thesis. University of Queensland. Brisbane, Queensland, Australia, 1970, p. 236.
- Nageswararao K., Wiseman D.M., Napier-Munn T.J. Two empirical hydrocyclone models revisited. Mineral Engineering. 2014. Vol. 17. Iss. 5, p. 671-687. DOI: 10.1016/j.mineng.2004.01.017
- Ramkrishna D. Population balances. Theory and Applications to Particulate Systems in Engineering. London: Academic Press, 2000, p. 355. URL: https://www.sciencedirect.com/book/9780125769709/population-balances#book-info (date of access 01.12.2020).
- Simulating Comminution and Classification Circuits with JKSimMet. 6 June 2020. URL: http://jktech.com.au/jksimmet (date of access 01.12.2020).
- Spicer P.T., Pratsinis S.E. Coagulation and fragmentation: universal steady-stateparticle-sizedistribution. American Institute of chemical Engineering Journal. 1996. Vol. 42. Iss. 6, p. 1612-1620. DOI: 10.1002/aic.690420612
- Stephenson R. Equivalence of Growth Rate and Yield Methods. Proceedings of 35th International ICSOBA Conference, 2-5 October 2017, Hamburg, Germany. ICSOBA, 2017. Vol. 46, p. 313-318.
- SysCAD – Innovative Software for Plant Simulation. 6 June 2020. URL: https://help.syscad.net/index.php/Precipitation3 (date of access 01.12.2020).
- Tachamper O. Improvements by the new Alusuisse process for producing coarse aluminium hydrate in the Bayer process // Light metals.Warrendale, Pennsylvania. TMS (The Minerals, Metals & Materials Society). Springer, 2016, p. 534-540. DOI: 10.1007/978-3-319-48176-0_74
- White E.T., Bateman S.H. Effect of caustic concentration on the growth rate of Al(OH)3 particles. Light Metals. Warrendale, Pennsylvania. TMS (The Minerals, Metals & Materials Society). Springer, 1988, p. 157-162.
- Yin J., Chen Q., Yin Zh., Zhang J. Study on the oscillation phenomena of particle size distribution during the seeded agglomeration of the sodium aluminate liquors. Aluminum Committee at the 135th TMS annual meeting, 12-16 March, 2006, San Antonio, Texas, USA. P. 173-176. URL: https://www.tib.eu/en/search/id/TIBKAT%3A526000430/Light-metals-2006-proceedings-of-the-technical/ (date of access 01.12.2020).