Development of complex system of geotechnical monitoring of technogenic objects based on geospatial data
- 1 — Master of Engineering Sciences Lecturer Abylkas Saginov Karaganda Technical University ▪ Orcid
- 2 — Ph.D. Associate Professor Abylkas Saginov Karaganda Technical University ▪ Orcid ▪ Scopus
- 3 — Ph.D. Associate Professor Siberian State University of Geosystems and Technologies ▪ Orcid ▪ Scopus
- 4 — Master of Engineering Sciences Senior Lecturer Abylkas Saginov Karaganda Technical University ▪ Orcid
- 5 — Ph.D. Associate Professor Abylkas Saginov Karaganda Technical University ▪ Orcid ▪ Scopus
Abstract
Monitoring of the stability of technogenic objects is a critical aspect of ensuring safety and preventing emergencies caused by mining and geological processes. The integrated use of various monitoring methods allows obtaining comprehensive information on the dynamics of deformation processes. The complex system of geotechnical monitoring of technogenic objects on the basis of geospatial data was developed, which was tested in the conditions of the “Edelweiss +” open-pit coal mine (Republic of Kazakhstan). The system was based on the step-by-step integration of Earth remote sensing methods, satellite radar interferometry, aerial photography with the use of unmanned aerial vehicles (UAVs), as well as modern instrumental methods – electronic tacheometry and GNSS measurements. The first stage – analysis of archive satellite images to identify areas of significant surface displacements. The second stage is aerial photography using UAVs to create detailed 3D models of surface areas with deformations. The third stage includes the creation of a geomechanical monitoring system based on instrumental observation methods in areas with critical changes. The final stage is the creation and updating of a geospatial database that provides continuous monitoring of the object’s condition. As a result of testing of the geotechnical monitoring system based on Sentinel-1 and TerraSAR-X/TanDEM-X satellite images, surface subsidence of up to 25 mm was detected on the northern side of the “Edelweiss +” open-pit mine. Aerial photography of the open-pit mine allowed us to construct digital 3D models of the terrain, the comparison of which confirmed deformation processes at the +556 m horizon. Instrumental observations using modern geodetic methods clarified the type and dynamics of deformations of the rock mass. Integration of geospatial data in the geotechnical monitoring system ensures prompt detection of deformations, their analysis and forecast, which allows us to minimize the risks of destruction and increase the safety of operation of technogenic objects.
The study was performed within the frameworks of agreement on grant financing for young scientists in scientific and scientific-technical projects of the Republic of Kazakhstan N 113/KМU-5-24-26, 20.06.2024, project N АR22788508.
Introduction
The current condition of the technogenic objects on the territory of the Republic of Kazakhstan needs constant monitoring in order to prevent possible emergencies and their negative consequences. There are several mechanisms to prevent and avoid the emergences, such as creation of a legal framework, development of tools for analysis, effective detection and control of the risks [1-3]. The risks of the major chemical accidents in the European Union (UN) are controlled by the Seveso directive. The directive demands stringent safety measures to prevent major accidents, and if prevention is not possible, to mitigate consequences for human health and the environment. There are other legal documents in the UN, such as European directive for the critical infrastructure, The Offshore Oil and Gas Safety Directive, Water Framework Directive or Floods Directive. Union civil protection mechanism includes the demand for the member-countries to prepare national assessment of the basic risks, including natural and technogenic [4, 5].
In France and Germany there are programs that work to prevent the chemical accidents. The special legislation has been implemented in several US states, in which possible risks, resulting from disasters on hazardous production facilities, has been addressed, for example, California Accidental Release Prevention (CalARP).
Joint Research Centre (JRC) in the UN has developed the RAPID-N system of the fast technogenic risks analysis, which represents the web-system of the analysis and decision support, in order to assess and visualize with the minimum data. RAPID-N helps the industry and the government monitor and reduce potential risks, perform fast damages and consequences assessment of these risks for the decision justification of the emergency response before sending emergency rescue services, alerting public, and plan land utilization [6].
Safety measures of the critical infrastructure objects on the Russian Federation territory, including technogenic objects, are performed in accordance with the Federal Law from July 26th 2017 N 187-FZ.
One of the key elements of the technogenic risks control system is geodesic monitoring, allowing to effectively monitoring the research objects’ deformation history, to quickly find potential hazards and to receive predictive development models of the discovered deformations. That being said, traditional geodesic monitoring models (natural visual examination, high frequency geodesic instrumental monitoring) is not often time efficient and does not have enough details of the research objects [7, 8], which makes it necessary to implement modern technology – aerophotography with the use of unmanned aerial vehicle (UAV), Earth’s remote sensing, for receiving the comprehensive information about deformation processes history.
In 2023 the scientists from Algeria has performed the research [9], directed at discovering the zones of sagging and ascension of the barrage. The appliance of the P-SBAS (Persistent Scatterer Small Baseline Subset) algorithm was described in the article, using the data from Sentinel-1 satellite, for accurate soil deformation monitoring on the Kramis barrage in Algeria. The research has discovered a sagging zone on the barrage’s left coast and ascending velocity in the upper part of the embankment, which allowed them to receive valuable information about the barrage deformations.
Satellite monitoring on the basis of InSAR (Interferometric Synthetic Aperture Radar) technology has been actively used in the open-pit mining, in order to provide reliable and safe environment for the mining works. This measuring method allows discovering even the small ground deformation, which is important for disruption and emergency prevention. The use of InSAR technology in Kazakhstan [10, 11], Uzbekistan [12-14] and Germany [15] has showed its effectiveness in deformation monitoring and risk control in mining industry.
The other method of the remote sensing, that is actively used for resolving monitoring objectives, is the UAV photography [16-18]. Currently, the UAV allow us to receive pictures of complicated and not easily accessible areas, that is impossible to observe from the ground [19]. The use of UAV in mining companies [20-22] cannot be replaced in hard-to-reach areas, where human presence is life threatening. In research [23, 24] the UAV show high efficiency for the dimensional monitoring goals, data integration and process automation in various fields, including urban science and mining industry. In the work [25] the use of UAV is targeted on the integration with geomonitoring systems for risk assessment and landslide control with the accent on the technology implementation factors, and in the work [26] the possibilities of highly precise geodesic monitoring are being researched, which makes this methodology accessible and practical for wide applicability. The research highlights the flexibility and economical efficiency of the UAV use. The works [27, 28] show the appliance of the UAV for the open-pit landscape analysis, creation of the geomorphological maps and digital elevation models, and also the examination of the human-induced and natural processes. The results of the aerophotography show the potential of the UAV use [29, 30] for the detailed collecting of data and open-pit mining landscapes monitoring [31-33].
Performed analysis of the scientific materials allows us to say, that currently there are no consolidated approaches to perform comprehensive analysis of the condition of the technogenic objects stability, or instruments, that allow to integrate traditional and modern methods of the geodesic monitoring into one unified system.
A complex geotechnical monitoring system has been developed, in which the method of the remote sensing, satellite-radar interferometry, aerophotography with UAV, as well as modern instrumental methods – electronic tacheometry and GNSS measurements was integrated step-by-step. Differential peculiarity of the system is its flexibility, depending on the monitoring goals it may be used as one element of the system, as well as all the elements, that gives the ability of executive decision-making on every stage of the implementation.
Suggested geotechniacal monitoring system on the base of the geospatial data is a unique digital seamless technology, that follows modern tendencies in the field of digital technology of the Republic of Kazakhstan, as presented in the “Digital Kazakhstan” program, allowing to effectively monitor the research objects’ deformation history, to quickly find potential hazards and to receive predictive development models of the discovered deformations.
Methods
Structural diagram of the complex geotechnical monitoring system is shown on Fig.1, demonstrating the integration process of the various geospatial data, received with classical, as well as with remote methods. The advantage of the suggested system is the ability of executive decision-making on every stage of the implementation.
The first stage of the geotechnical monitoring is the collection and analysis of the archive satellite images from Sentinel-1 and TerraSAR-X/TanDEM-X. This data allows identifying areas of significant surface displacements. Despite the high accuracy (5-10 mm) of determining vertical displacements, the images have the resolution capability of 10 m/pix, which restricts the precise determination of the area subject to change. For the correct displacement monitoring with the velocity up to 300 mm/year [34, 35], it is necessary to have no more than a two months gap between the images.
The second stage includes the production of series of images from aerophotography with the use of UAV to receive a more detailed data about the displacements (accuracy 2-5 cm) within the boundaries of the researched area, determined on the first stage of the monitoring system, according to satellite image data. The use of UAV is more flexible with time ranges and allows receiving the information about the object in the shortest period at the time of photography.
The aerophotography data is analyzed with the special software, allowing creating grids at the deformation areas and creating precise 3D model of the researched area of the object for analyzing deformation geometry and further monitoring.
The next step is to determine the areas of the object with the high possibility of collapsing. If the velocity of the area surface of the object is 40-100 mm/month [36], the system of geomechanical monitoring of stability condition on the basis of instrumental control (the third stage), including electronic tacheometry and GNSS measurements by benchmarks of observation stations is created. To select the locations of observation stations, it is necessary to consider the current state and direction of development of mining operations, areas of location of mining equipment and workers, geological disturbances and rock contacts, hydrogeological conditions, areas with a high probability of collapse. Production of a series of systematic high-precision instrumental geodetic observations on the benchmarks of observation stations and analysis of their results allow us to determine the magnitude of changes, establish the mechanism and causes of deformations, predict their development and develop measures to eliminate the causes.
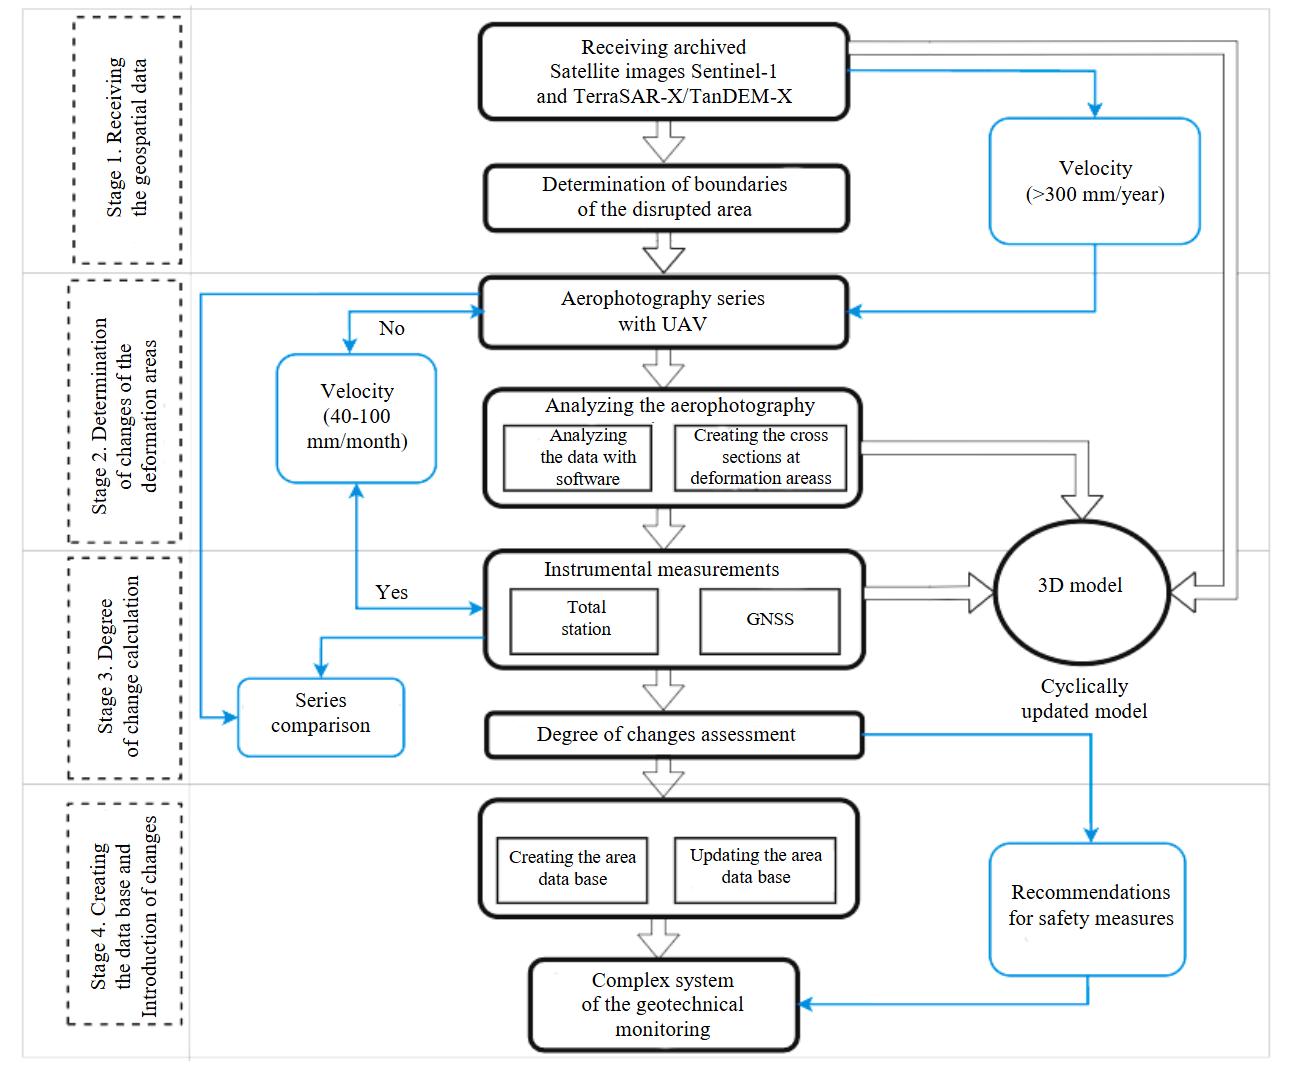
Fig.1. Structural diagram of the complex geotechnical monitoring system for the technogenic objects on the basis of geospatial data
The fourth stage of geotechnical monitoring is aimed to creating a geospatial database, which accumulates all the collected information. The database is constantly updated, which allows maintaining the relevance of information and promptly responding to changes. The basis of this system is a cyclically updated 3D model, which is used to develop recommendations for improving safety during the operation of technogenic objects.
The structural diagram illustrates the systematic process of implementing the integrated system of geotechnical monitoring of technogenic objects from preliminary analysis of Earth remote sensing data to the creation of a geospatial database and the development of measures to improve safety during the operation of technogenic objects.
Results
The probation of the proposed integrated system of geotechnical monitoring of technogenic objects based on geospatial data was carried out at the “Edelweiss +” open-pit coal mine in the Karaganda region of the Republic of Kazakhstan (Fig.2).
To monitor the condition of the quarry slopes of the “Edelweiss +” open-pit coal mine, Multi-pass radar interferometry (InSAR) [37] using data from the Sentinel-1 and TerraSAR-X/TanDEM-X satellites was applied. The main data processing method was the small baseline analysis method (SBAS), which allows detection of earth surface deformations with high accuracy over large areas.
In the period from April 2017 till October 2021, the radar imagery archive was used, which allows obtaining data from any part of the earth surface, from the Sentinel-1A and Sentinel-1B spacecraft in the Interferometric Wide Swath (IW) mode, which provides coverage of territories with high spatial resolution. Due to seasonal conditions affecting the accuracy of interferograms (for example, the presence of snow cover), images from December to February were not used to avoid distortions caused by strong decorrelation. Interferometry was performed using VV+VH polarization [38], which improved the accuracy of determining vertical and horizontal displacements. As a result, 72 images were obtained along the descending orbit and 78 ones along the ascending orbit of the satellite.
Initially, all radar images were aligned with the reference image using fine registration algorithms. This allowed us to reduce errors related to changes in orbital geometry and survey conditions. For Sentinel-1 data, an alignment algorithm was used based on spatial referencing of points between pairs of frames, which ensured stable geometry and reduced positioning errors.
The interferograms were generated in the Sentinels Application Platform (SNAP) software (Fig.3) for each pair of images with a small baseline (below 200 m). In the interferograms, which were constructed at an interval of 12 days, phase shifts are visualized using a color palette. Each complete cycle of the phase change (–π to +π) corresponds to a shift of about 2.8 cm. The most active deformation processes were identified in the period from May 2020 to October 2021 on the northern side of the “Edelweiss +” open-pit coal mine. In other areas of the open pit, the interferogram shows a relatively stable state of the open-pit slopes, where phase shifts are minimal (smooth transitions between colors). This indicates the absence of significant shifts in these areas.
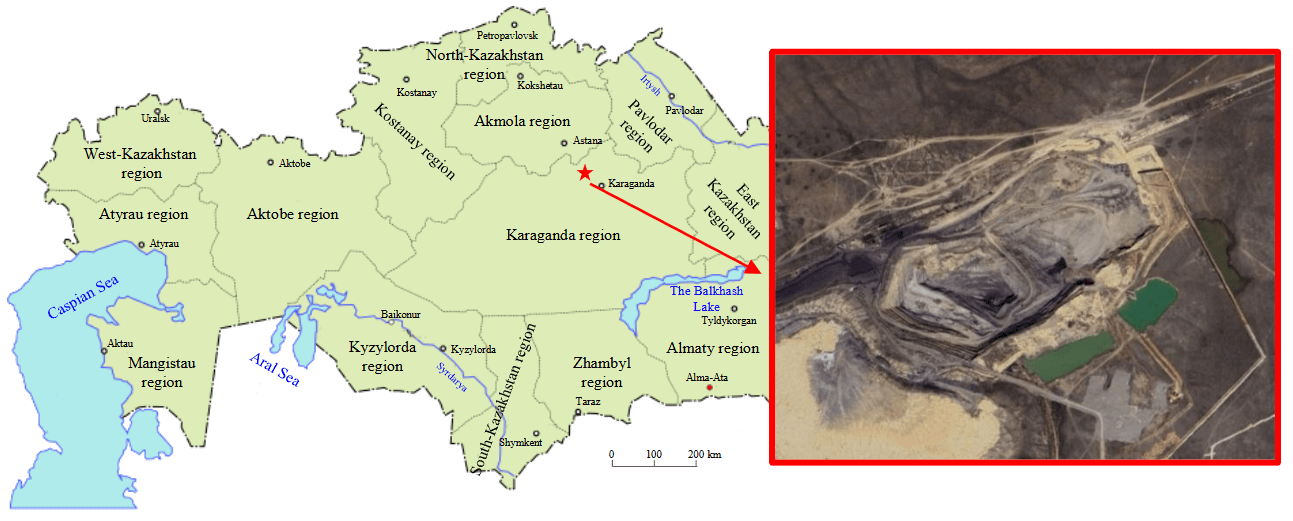
Fig.2. Location of “Edelweiss +” open-pit coal mine in the map of the Republic of Kazakhstan
High-resolution TerraSAR-X/TanDEM-X radar images collected by the German Aerospace Center (DLR) for the period from 11 May 2019 to 20 November 2021 were acquired. The acquired data were processed using SARscape software, at that the phase interferograms were filtered using the Goldstein algorithm, which minimizes the phase noise caused by atmospheric phenomena and multipath effect. Filtering allows to increase the coherence of the signal and to increase the accuracy of measurements of small displacements. In addition, filtering was used for consideration of influence of water bodies and vegetation, since these elements can cause strong decorrelation of the phase signal [39]. In total, 62 images from the satellite’s descending orbit were processed.
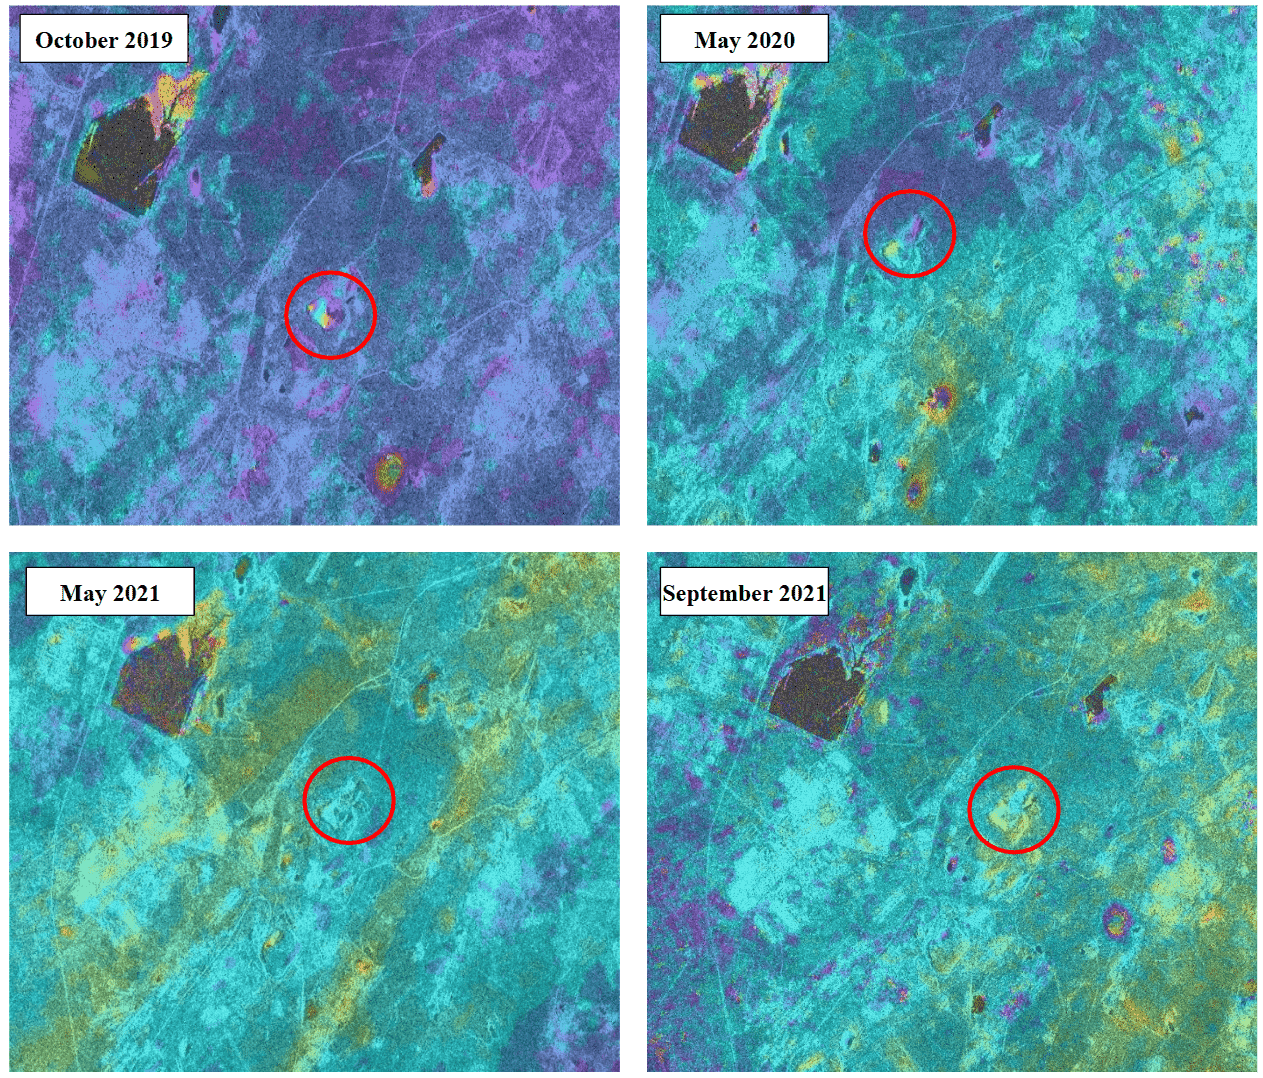
Fig.3. Satellite imagery Sentinel-1 of Karaganda region. Red round – location of “Edelweiss +” open pit
To transform the phase data into real displacement values, a phase unfolding process was used [40]. During this process, the phase shift ambiguities associated with the multi-valued phase information were eliminated and transformed into discrete values of the earth surface displacements.
Based on the processing results, a map-scheme of displacements in the studied area with a resolution of 10 m/pix was constructed. A color scale reflecting the magnitude of vertical displacements was used to visualize the displacements. Red shades indicate significant subsidence of the surface exceeding 20 mm, and blue shades correspond to zones of stability or minor changes (up to 2 mm). Green and yellow shades display intermediate values, which helps to highlight zones with medium deformation levels.
For more complete interpretation of the dynamics of deformation processes on the northern side of the “Edelweiss +” open-pit coal mine, a graph of the dependence of vertical displacements of the rock mass on the observation period (from May 2017 to October 2021) was constructed, which reflects the change in the height of the surface of the massif over time (Fig.4). Each point on the graph corresponds to the average value of the rock mass displacement for one survey cycle.
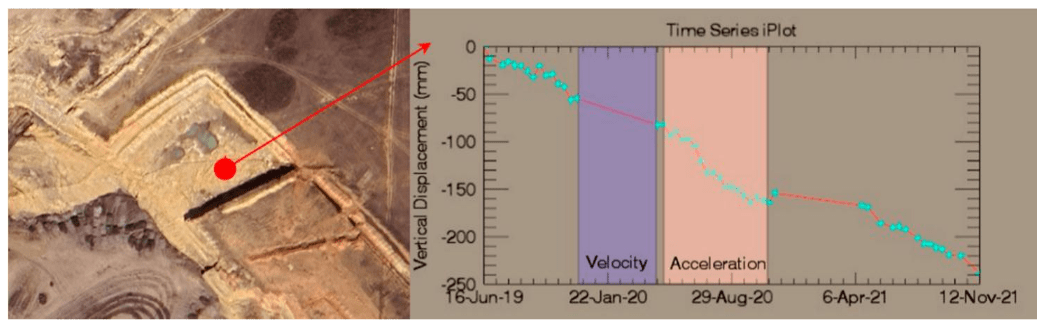
Fig.4. Shifting schedule of adjacent rock mass in northern side of “Edelweiss +” open pit
Within the period of active deformation processes on the northern side of the open pit, a linear trend of subsidence of the rock mass with a total displacement of up to 25 mm is observed. This fact confirms the presence of active deformation processes caused by mining operations, mining and geological factors and hydrological processes.
In May 2020, the second series of archival satellite images was obtained, the first series of ALS was made using the DJI Mavic 2 Pro UAV [41], equipped with a multi-system and multi-frequency GNSS receiver, which allows determining the position of the vessel in the air at the time of photographing with an accuracy of ±5 mm. As a result of processing of the first series of measurements, a digital surface model (DSM) was obtained with a root mean square error (RMS) in two planes at the reference points of 1.5 cm, and at the control points – 4.7 cm. The second series of measurements was carried out in November 2021 for the same flight mission as in the first series, while the reference points in the first and second series of measurements were common. The RMS of the DSM determination in the second series of measurements at the reference points was 1.5 cm, and at the control points – 2.2 cm. The third series of measurements was carried out in October 2022 for the same flight mission as in the first two. Unlike the first two series, due to the destruction of most of the control points, it appeared necessary to create a new control network including the maximum remaining points of the previous network. The RMS of the DSM determination in the third series of measurements by control points was 4.4 cm, and by control points – 8.2 cm. The last series of measurements was carried out in June 2023 for the previous flight mission, the RMS of the DSM determination by control points was 3 cm, by control points – 6.7 cm.
With the aim to identify areas with clearly expressed changes in the surface of the open-pit coal mine, all DSMs were compared with each other in the Leapfrog GEO software package. The predominance of one color over another shows areas of the open pit surface where mining operations were carried out, or deformation processes of the rock mass were manifested. Deformation processes of the massif were detected on the northern side of the open pit, which is confirmed by the analysis of satellite images using ERS.
To determine the magnitude of the rock mass shifting of the northern side of the open pit in the area with a pronounced deformation process, cross-sections with a solid coordinate reference to the terrain were constructed, which are applied to all series of aerial photography in the Agisoft Metashape software package (Fig.5). Agisoft Metashape allows processing images, converting them into dense point clouds, textured polygonal models, georeferenced orthophotos and digital relief/terrain models. The profile measurement function makes it possible to determine such parameters as length, height, and slope on the section of the 3D model, perform comparison and analysis between the aerial photography series (Fig.6), which allows establishing the shape, shifting value, and deformation mechanism of the rock mass.
Based on the results of comparison of cross-sections performed, the following conclusions are made:
- By profile line А, in the period from May 2020 till November 2021, the bench failure happened in horizon +557/+545 m in form of flaw of adjacent rock mass in the distance of 5.99 m from upper edge, the subsidence amounted 10.67 m.
- By profile line В, subsidence happened in two stages:
– in the period from May 2020 till November 2021, the flaw was found (hor. +556 m) in the distance of 7.44 m from upper edge, the subsidence amounted 3.40 m;
– in the period from November 2021 till October 2022 the following subsidence happened in horizon +553 m, distance from upper edge amounted 3.56 m, the subsidence – 2.65 m.
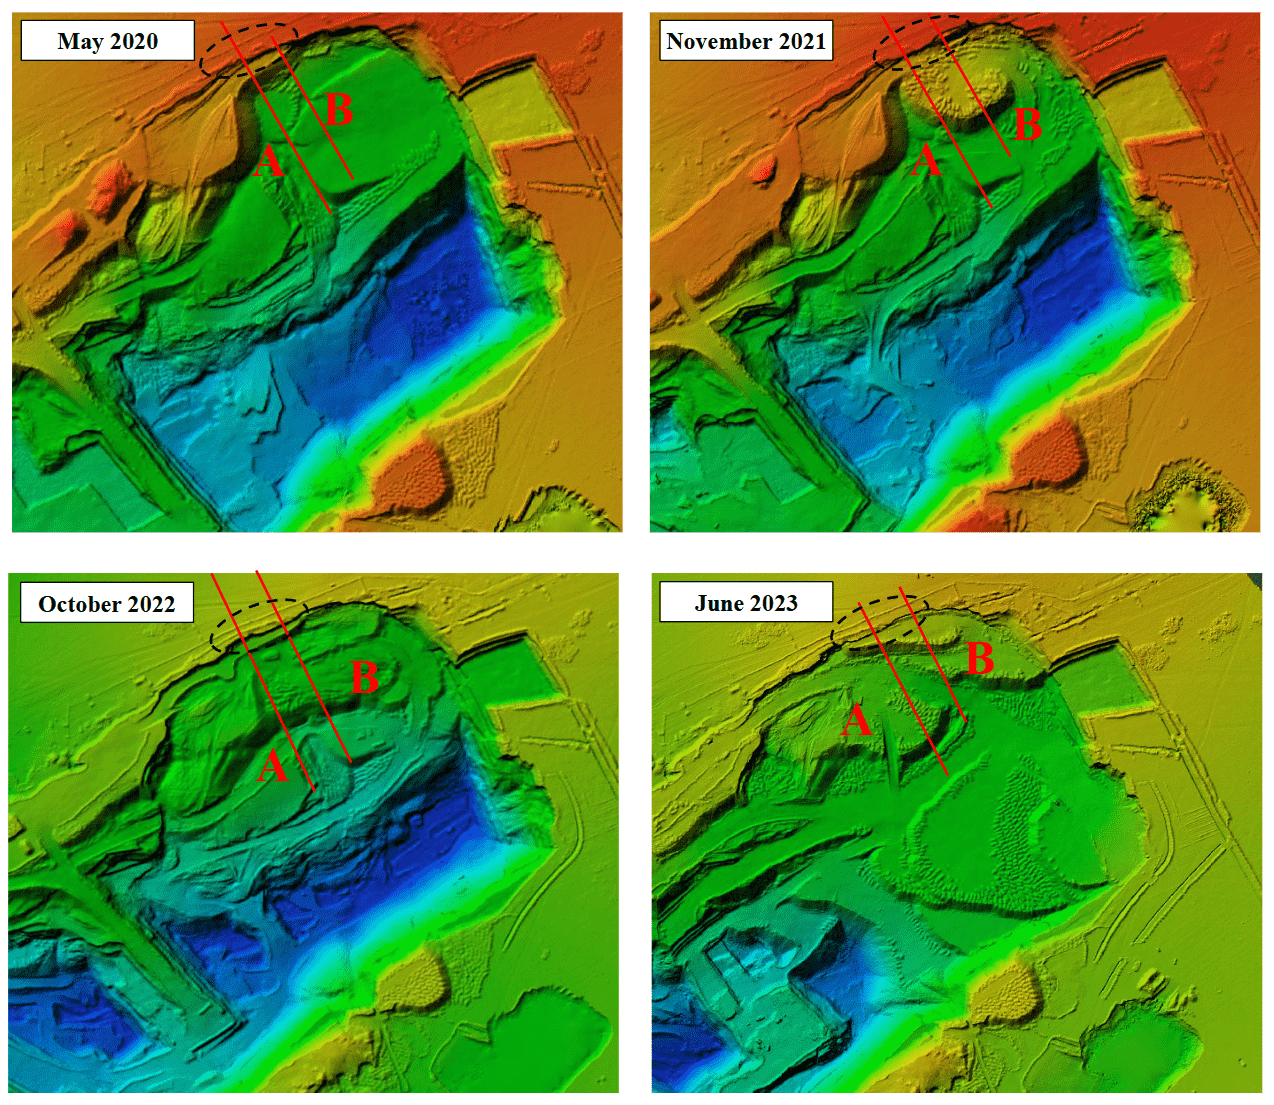
Fig.5. DSM according to ALS for the period 2020-2023. Red lines – profile lines А and В; black dashed ovals – zones with largest registered shifting of rock mass surface
Coal mining in this area was carried out along coal seam outbreaks under soil overburden, which could contribute to the development of deformation processes. In such conditions, the correspondence of the actual parameters of the quarry slopes of the open pit to the parameters of stable slopes becomes essential, since the discrepancy can lead to increased instability and an increased risk of dangerous deformations.
To determine deformations whose values are less than the resolution of aerial photography (2.5 cm/pixel), the classical method of geodetic instrumental observations [42-44] was used applying a high-precision electronic Leica MS 50 tacheometer and a Leica GS 14 GNSS receiver.
Geodetic instrumental observations were carried out using the benchmarks of the observation station’s profile lines. The location of the observation station’s profile lines corresponds to the sections along profile lines A and B (Fig.7). In Fig.7, benchmarks that are measured using a tacheometer and GNSS equipment are marked in blue, and benchmarks measured using a tacheometer only are marked in green.
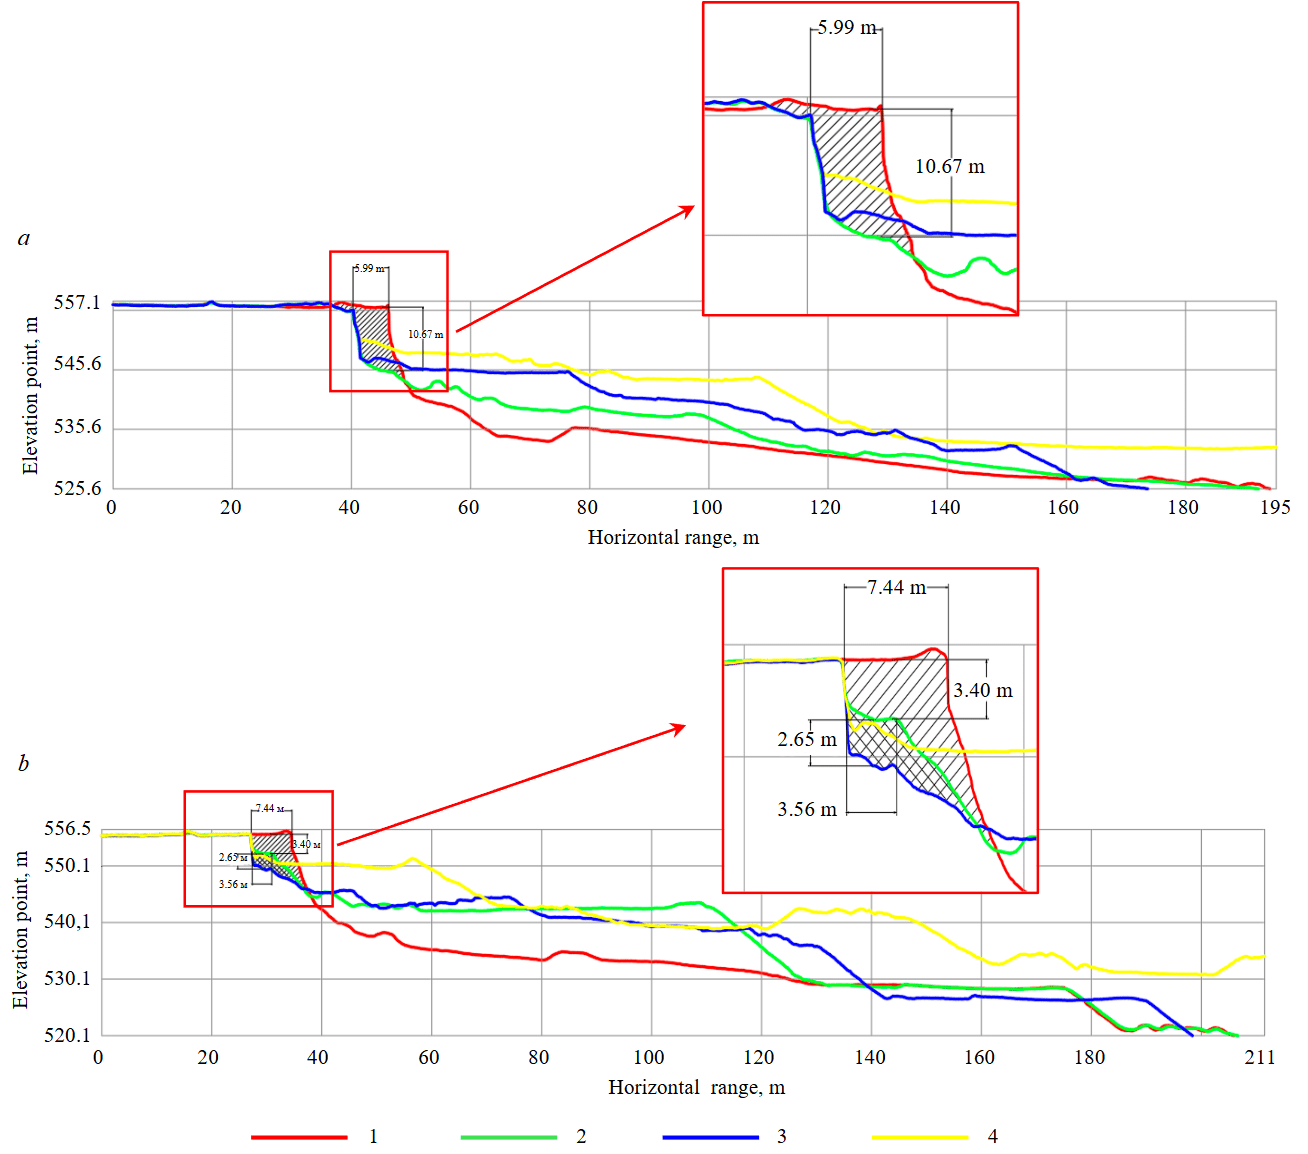
Fig.6. Cross-sections of 3D-model along profile lines А (а) and В (b)
1 – May 2020; 2 – November 2021; 3 – October 2022; 4 – June 2023
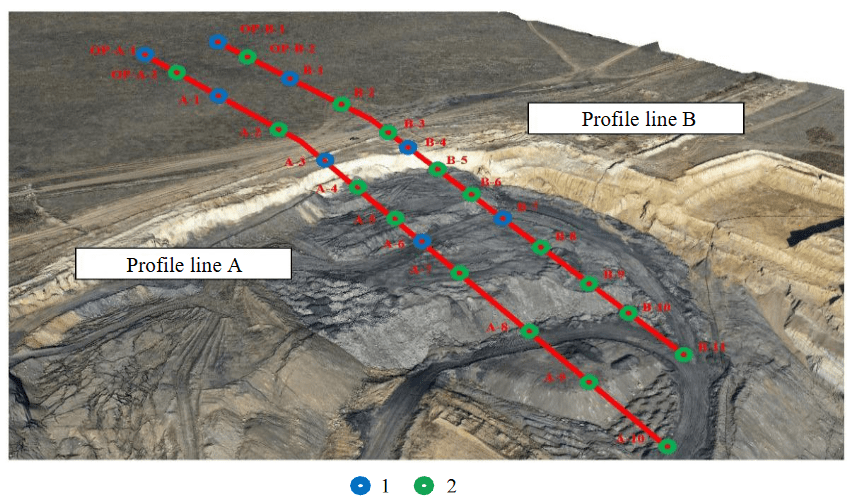
Fig.7. Observation station for instrumental monitoring
1 – measurement points for benchmarks using GNSS equipment and tacheometer; 2 – measurement points for benchmarks using tacheometer
The observation station consists of 4 reference and 21 operating benchmarks. The reference benchmarks are located at a distance of at least 1.5H (H is the depth of the open pit, m) from the upper edge of the open pit, in an area not subject to massif shifting in the result of mining operations.
Four series of highly precise geodesic instrumental observations were performed (May 2020, November 2021, October 2022, June 2023). Results of observations are presented in Tables 1-3.
Table 1
Comparison of measurements of the first and the second series
|
Point |
20.05.2020 |
15.11.2021 |
ΔZ, mm |
dS, mm |
ΔL, mm |
||||
|
Z, m |
S, m |
L, m |
Z, m |
S, m |
L, m |
||||
|
Profile line А |
|||||||||
|
ОР-A-1 |
550.783 |
550.780 |
–3 |
0 |
0 |
||||
|
ОР-A-2 |
553.159 |
58.714 |
58.714 |
553.160 |
58.709 |
58.709 |
1 |
–5 |
–5 |
|
A-1 |
554.341 |
34.797 |
93.439 |
554.338 |
34.797 |
93.435 |
–3 |
0 |
–4 |
|
A-2 |
555.409 |
33.409 |
126.845 |
555.406 |
33.410 |
126.842 |
–3 |
1 |
–3 |
|
A-3 |
555.800 |
40.176 |
167.016 |
555.774 |
40.223 |
167.060 |
–26 |
47 |
44 |
|
A-4 |
555.953 |
10.232 |
177.247 |
Demolished |
|||||
|
Profile line B |
|||||||||
|
ОР-В-1 |
551.788 |
551.789 |
1 |
0 |
0 |
||||
|
ОР-В-2 |
553.988 |
54.172 |
54.172 |
553.984 |
54.173 |
54.173 |
–4 |
1 |
1 |
|
В-1 |
555.795 |
34.346 |
88.478 |
555.793 |
34.341 |
88.473 |
–2 |
–5 |
–4 |
|
В-2 |
556.825 |
35.966 |
124.443 |
556.823 |
35.972 |
124.445 |
–2 |
6 |
2 |
|
В-3 |
556.508 |
34.769 |
159.209 |
556.480 |
34.794 |
159.236 |
–28 |
25 |
27 |
|
В-4 |
556.320 |
16.106 |
175.314 |
556.443 |
14.064 |
173.280 |
New |
||
Table2
Comparison of measurements of the second and the third series
|
Point |
15.11.2021 |
25.10.2022 |
ΔZ, mm |
dS, mm |
ΔL, mm |
||||
|
Z, m |
S, m |
L, m |
Z, m |
S, m |
L, m |
||||
|
Profile line А |
|||||||||
|
ОР-A-1 |
550.780 |
550.781 |
1 |
0 |
0 |
||||
|
ОР-A-2 |
553.160 |
58.709 |
58.709 |
553.158 |
58,711 |
58,711 |
–2 |
2 |
2 |
|
A-1 |
554.338 |
34.797 |
93.435 |
554.339 |
34,804 |
93,444 |
1 |
7 |
9 |
|
A-2 |
555.406 |
33.410 |
126.842 |
555.403 |
33,417 |
126,858 |
–3 |
7 |
16 |
|
A-3 |
555.774 |
40.223 |
167.060 |
555.751 |
40,250 |
167,103 |
–23 |
27 |
43 |
|
A-4 |
Demolished |
545.378 |
18.853 |
185.867 |
New |
||||
|
Profile line B |
|||||||||
|
ОР-В-1 |
551.789 |
551.787 |
–2 |
0 |
0 |
||||
|
ОР-В-2 |
553.984 |
54.173 |
54.176 |
553.985 |
54.174 |
54.178 |
1 |
0 |
2 |
|
В-1 |
555.793 |
34.341 |
88.476 |
555.796 |
34.341 |
88.478 |
3 |
1 |
3 |
|
В-2 |
556.823 |
35.972 |
124.447 |
556.821 |
35.971 |
124.448 |
–2 |
–1 |
1 |
|
В-3 |
556.480 |
34.794 |
159.239 |
556.464 |
34.812 |
159.258 |
–16 |
18 |
19 |
|
В-4 |
556.443 |
14.044 |
173.280 |
556.400 |
14.054 |
173.307 |
–43 |
10 |
27 |
Table3
Comparison of measurements of the third and the fourth series
|
Point |
25.10.2022 |
30.06.2023 |
ΔZ, mm |
dS, mm |
ΔL, mm |
||||
|
Z, m |
S, m |
L, m |
Z, m |
S, m |
L, m |
||||
|
Profile line А |
|||||||||
|
ОР-A-1 |
550.781 |
550.782 |
1 |
0 |
0 |
||||
|
ОР-A-2 |
553.158 |
58.711 |
58.707 |
553.158 |
58.715 |
58.715 |
0 |
4 |
8 |
|
A-1 |
554.339 |
34.804 |
93.440 |
554.345 |
34.791 |
93.435 |
6 |
–12 |
–5 |
|
A-2 |
555.403 |
33.417 |
126.854 |
555.418 |
33.404 |
126.836 |
15 |
–13 |
–18 |
|
A-3 |
555.751 |
40.250 |
167.099 |
555.742 |
40.288 |
167.119 |
–9 |
38 |
20 |
|
Profile line B |
|||||||||
|
ОР-В-1 |
551.787 |
551.789 |
2 |
0 |
0 |
||||
|
ОР-В-2 |
553.985 |
54.174 |
54.174 |
553.985 |
54.175 |
54.175 |
0 |
2 |
2 |
|
В-1 |
555.796 |
34.341 |
88.474 |
555.798 |
34.339 |
88.474 |
2 |
–2 |
0 |
|
В-2 |
556.821 |
35.971 |
124.444 |
556.826 |
35.967 |
124.440 |
5 |
–4 |
–4 |
|
В-3 |
556.464 |
34.812 |
159.253 |
556.431 |
34.852 |
159.289 |
–33 |
40 |
36 |
|
В-4 |
556.400 |
14.054 |
173.307 |
556.389 |
14.046 |
173.335 |
–11 |
–8 |
28 |
Parameters in Tables 1-3 – elevation point of Z benchmark, horizontal distance between benchmarks S, and distance from reference benchmark to measured L. For each benchmark, values Z, S, L are shown for two series of instrumental observations, and values ΔZ, dS, ΔL are shown between observation series, which allows to define vertical and horizontal shifting. These parameters are necessary for analysis of rock mass deformation and control over stability of examined area. Vertical changes ΔZ emphasize the subsidence or uplifts, and horizontal displacements dS, ΔL emphasize the mass shifting in horizontal plane.
Based on the results of instrumental measurements using electronic tacheometer, the following conclusions are made:
- In profile line А, in the period from May 2020 till October 2022, significant vertical shifting of benchmark A-3 (hor. +555 m) is registered, the subsidence amounted 26 mm and 23 mm in first two series respectively, maximal horizontal shifting towards mined-out space amounted 44 mm.
- In profile line В, in the period from May 2020 till June 2023, the shifting of benchmarks B-3 and B-4 (hor. +556 m) was found, maximal horizontal shifting towards mined-out space amounted 36 mm, maximal subsidence – 43 mm.
This emphasizes the displacement of massif in this area, which requires extra attention and further observation.
To carry out geodesic control, GNSS measurements were performed in observation station [45-47] in benchmarks OP-A-1, A-1, A-3, A-6, ОР-В-1, В-1, В-4, and В-7. Results of geodesic control (Tables 4-6) [48] give the opportunity to compare the values of changes with previous tacheometric values, check their accuracy, and find possible discrepancies.
Table 4
Comparison of GNSS measurements in the first and the second series
|
Point |
20.05.2020 |
15.11.2021 |
ΔY, mm |
ΔX, mm |
ΔZ, mm |
Vector shifting, mm |
V, mm/day |
|
Z, m |
Z, m |
544 days |
|||||
|
Profile line А |
|||||||
|
ОР-A-1 |
550.785 |
550.783 |
2 |
–1 |
–2 |
3 |
0.01 |
|
A-1 |
554.346 |
554.340 |
1 |
–6 |
–6 |
9 |
0.02 |
|
A-3 |
555.806 |
555.776 |
42 |
–36 |
–30 |
63 |
0.12 |
|
A-6 |
534.180 |
542.484 |
New |
||||
|
Profile line В |
|||||||
|
ОР-В-1 |
551.783 |
551.786 |
2 |
–2 |
3 |
4 |
0.01 |
|
В-1 |
555.791 |
555.790 |
2 |
2 |
–1 |
3 |
0.01 |
|
В-4 |
556.505 |
556.477 |
22 |
–24 |
–28 |
43 |
0.08 |
|
В-7 |
|
537.594 |
New |
||||
Table 5
Comparison of GNSS measurements in the second and the third series
|
Point |
15.11.2021 |
25.10.2022 |
ΔY, mm |
ΔX, mm |
ΔZ, mm |
Vector shifting, mm |
V, mm/day |
|
Z, m |
Z, m |
344 days |
|||||
|
Profile line А |
|||||||
|
ОР-A-1 |
550.783 |
550.784 |
–8 |
2 |
1 |
8 |
0.02 |
|
A-1 |
554.340 |
554.342 |
–1 |
–17 |
2 |
17 |
0.05 |
|
A-3 |
555.776 |
555.754 |
17 |
–37 |
–22 |
46 |
0.13 |
|
A-6 |
542.484 |
542.655 |
New |
||||
|
Profile line В |
|||||||
|
ОР-В-1 |
551.786 |
551.79 |
–2 |
3 |
4 |
5 |
0.02 |
|
В-1 |
555.790 |
555.799 |
–3 |
2 |
9 |
10 |
0.03 |
|
В-4 |
556.477 |
556.467 |
11 |
–11 |
–10 |
18 |
0.05 |
|
В-7 |
537.594 |
540.997 |
New |
||||
Table 6
Comparison of GNSS measurements in the third and the fourth series
|
Point |
25.10.2022 |
30.06.2023 |
ΔY, mm |
ΔX, mm |
ΔZ, mm |
Vector shifting, mm |
V, mm/day |
|
Z, m |
Z, m |
248 days |
|||||
|
Profile line А |
|||||||
|
ОР-A-1 |
550.784 |
550.785 |
1 |
–2 |
1 |
2 |
0.01 |
|
A-1 |
554.342 |
554.348 |
–8 |
5 |
6 |
11 |
0.05 |
|
A-3 |
555.754 |
555.745 |
11 |
–16 |
–9 |
21 |
0.09 |
|
A-6 |
542.655 |
543.113 |
New |
||||
|
Profile line В |
|||||||
|
ОР-В-1 |
551.790 |
551.792 |
–5 |
2 |
2 |
6 |
0.02 |
|
В-1 |
555.799 |
555.800 |
–7 |
2 |
1 |
7 |
0.03 |
|
В-4 |
556.467 |
556.433 |
29 |
–26 |
–34 |
52 |
0.21 |
|
В-7 |
540.997 |
543.962 |
New |
||||
Analysis of GNSS measurements data shows the following:
- In the profile line А, benchmark A-3 (hor. +555 m) demonstrates the most expressed horizontal shifting towards the mined-out space – 63 mm, average velocity of benchmarks displacement in deformation area – 0.13 mm/day.
- In the profile line В, benchmark В-4 (hor. +556 м) demonstrates the most expressed changes, horizontal shifting amounted 52 mm, and displacement velocity – 0.21 mm/day. This indicates the intensive influence or changes in rock mass in this area.
GNSS measurements confirm the results of measurements obtained using the high-precision electronic tacheometer Leica MS 50 (benchmarks A-3 and B-4), which emphasizes the need for an integrated approach to measurement methods in monitoring the state of technogenic objects and analysis of deformation processes for an accurate assessment of their dynamics.
The reason for the deformation processes on the northern side of the “Edelweiss +” open-pit coal mine is the discrepancy between the actual parameters of the mine side slopes and the parameters of stable slopes. Calculations of the parameters of the working side [49] did not take into account many factors negatively affecting their stability, such as weathering processes, melt water, and the development of coal outbreaks with structural dip of 15-20°.
Conclusion
Monitoring of stability of technogenic objects is a critically important aspect of ensuring safety and preventing emergencies caused by mining and geological processes. The integrated use of various monitoring methods, such as prototype visual inspection, high-precision geodetic instrumental control and monitoring of the condition of technogenic objects using unmanned aerial vehicles, as well as Earth remote sensing, allows us to obtain comprehensive information on the dynamics of deformation processes.
The work presents the developed integrated system of geotechnical monitoring of technogenic objects based on geospatial data, which has been tested at the “Edelweiss +” open-pit coal mine. The system is based on the integration of Earth remote sensing methods, satellite radar interferometry, aerial photography using unmanned aerial vehicles, and classical geodetic instrumental control methods as well – electronic tacheometric survey using high-precision geodetic equipment and GNSS measurements. The integration of these methods provides the ability to detect locally the changes in the studied surface of objects, and to determine the causes and mechanism of rock mass displacement as well. Particular attention should be paid to the use of archival Earth remote sensing data, which allow identifying high-risk zones subject to deformation processes.
The application of the proposed geotechnical monitoring methodology is effective for various types of technogenic objects, including quarries, waste dumps, areas subsided by underground mining, as well as critical infrastructure objects, such as dams and weirs [50]. The developed system can be used to formulate recommendations for ensuring the safety of operation of technogenic objects at increased frequency of monitoring measurements and analysis of the rate of deformation development. Thus, monitoring gives the opportunity for the prompt identification of critical deformation processes, forecasting their development and taking timely measures to minimize the consequences, which significantly increases the safety of objects operation.
References
- Misuri A., Landucci G., Cozzani V. Assessment of risk modification due to safety barrier performance degradation in Natech events. Reliability Engineering & System Safety. 2021. Vol. 212. N 107634. DOI: 10.1016/j.ress.2021.107634
- Suarez-Paba M.C., Cruz A.M. A paradigm shift in Natech risk management: Development of a rating system framework for evaluating the performance of industry. Journal of Loss Prevention in the Process Industries. 2021. Vol. 74. N 104615. DOI: 10.1016/j.jlp.2021.104615
- Park H., Cruz A.M. Insights on Chemical and Natech Risk Management in Japan and South Korea: A Review of Current Practices. International Journal of Disaster Risk Science. 2022. Vol. 13. Iss. 3, p. 359-371. DOI: 10.1007/s13753-022-00409-2
- Misuri A., Antonioni G., Cozzani V. Quantitative risk assessment of domino effect in Natech scenarios triggered by lightning. Journal of Loss Prevention in the Process Industries. 2020. Vol. 64. N 104095. DOI: 10.1016/j.jlp.2020.104095
- Corritore D., Paolacci F., Caprinozzi S. A Screening Methodology for the Identification of Critical Units in Major-Hazard Facilities Under Seismic Loading. Frontiers in Built Environment. 2021. Vol. 7. N 780719. DOI: 10.3389/fbuil.2021.780719
- Girgin S., Krausmann Е. RAPID-N: Rapid natech risk assessment and mapping framework. Journal of Loss Prevention in the Process Industries. 2013. Vol. 26. Iss. 6, p. 949-960. DOI: 10.1016/j.jlp.2013.10.004
- Guanwen Huang, Shi Du, Duo Wang. GNSS techniques for real-time monitoring of landslides: a review. Satellite Navigation. 2023. Vol. 4. N 5. DOI: 10.1186/s43020-023-00095-5
- Raufu I.O., Tata H., Olaosegba S. et al. Modelling local geoid undulations using unmanned aerial vehicles (UAVS): A case study of the Federal University of Technology, Akure, Nigeria. Geodesy, cartography, and aerial photography. 2023. Iss. 98, p. 63-75. DOI: 10.23939/istcgcap2023.98.063
- Hasni Kamel, Bachir Gourine, Mohammed El Amin Larabi. Dam Deformation Monitoring Using Cloud-Based P-SBAS Algorithm: The Kramis Dam Case (Algeria). Engineering Technology & Applied Science Research. 2023. Vol. 13. N 3, p. 10759-10764. DOI: 10.48084/etasr.5857
- Nurpeissova M., Bitimbayev M.Zh., Rysbekov K.В. et al. Geodetic substantiation of the Saryarka copper ore region. News of the National Academy of Sciences of the Republic of Kazakhstan. Series of Geology and Technical Sciences. 2020. Vol. 6. N 444, p. 194-202. DOI: 10.32014/2020.2518-170X.147
- Nizametdinov F.K., Baryshnikov V.D., Oralbay A.O. Kentobe Pitwall Stability Estimation Using a Digital Geological–Geomechanical Model. Journal of Mining Science. 2022. Vol. 58. N 6, p. 896-902. DOI: 10.1134/S1062739122060035
- Khamitov N., Kazakov A., Akramov A. et al. Implementation of satellite monitoring of the sides of the “Kalmakyr” mine. AIP Conference Proceedings. 2024. Vol. 3152. Iss. 1. № 050005. DOI: 10.1063/5.0218943
- Markov A., Kazakov A., Haqberdiyev M. et al. Calculation of tectonic stresses in the earth’s crust of SouthWestern Uzbekistan. IOP Conference Series: Earth and Environmental Science. 2021. Vol. 937. N 4. N 042087. DOI: 10.1088/1755-1315/937/4/042087
- Fazilova D., Arabov O. Vertical accuracy evaluation free access digital elevation models (DEMs): case Fergana Valley in Uzbekistan. Earth Sciences Research Journal. 2023. Vol. 27. N 2, p. 85-91. DOI: 10.15446/esrj.v27n2.103801
- Rudolph T., Goerke-Mallet P., Homölle A. et al. Participatory Geomonitoring for Future Mining–Resilience Management in the Cavern Storage Epe (Germany). Mining. 2024. Vol. 4. Iss. 2, p. 230-247. DOI: 10.3390/mining4020014
- Haske B., Rudolph T., Bernsdorf B., Pawlik M. Innovative Environmental Monitoring Methods Using Multispectral UAV and Satellite Data. First Break. 2024. Vol. 42. Iss. 2, p. 41-47. DOI: 10.3997/1365-2397.fb2024012
- Chuangang Gong, Shaogang Lei, Zhengfu Bian et al. Analysis of the Development of an Erosion Gully in an Open-Pit Coal Mine Dump During a Winter Freeze-Thaw Cycle by Using Low-Cost UAVs. Remote Sensing. 2019. Vol. 11. Iss. 11. N 1356. DOI: 10.3390/rs11111356
- Bouguettaya A., Zarzour H., Taberkit A.M., Kechida A. A review on early wildfire detection from unmanned aerial vehicles using deep learning-based computer vision algorithms. Signal Processing. 2022. Vol. 190. N 108309. DOI: 10.1016/j.sigpro.2021.108309
- Martín-Béjar S., Claver J., Sebastián M.A., Sevilla L. Graphic Applications of Unmanned Aerial Vehicles (UAVs) in the Study of Industrial Heritage Assets. Applied Sciences. 2020. Vol. 10. Iss. 24. N 8821. DOI: 10.3390/app10248821
- Türk Y., Balaban B., Alkan E. et al. The use of UAV-based RTK/PPK method in monitoring the ground change after excavation in open-pit mine sites: A case study in the Düzce-Tatlıdere quarry. Ormancılık Araştırma Dergisi. 2022. Vol. 9. Special Issue, p. 76-85 (in Turkish). DOI: 10.17568/ogmoad.1093694
- He Zhang, Aldana-Jague E., Clapuyt F. et al. Evaluating the potential of post-processing kinematic (PPK) georeferencing for UAV-based structure-from-motion (SfM) photogrammetry and surface change detection. Earth Surface Dynamics. 2019. Vol. 7. Iss. 3, p. 807-827. DOI: 10.5194/esurf-7-807-2019
- Taddia Y., Stecchi F., Pellegrinelli A. Coastal Mapping Using DJI Phantom 4 RTK in Post-Processing Kinematic Mode. Drones. 2020. Vol. 4. Iss. 2. N 9. DOI: 10.3390/drones4020009
- Lee E., Park S., Jang H. et al. Enhancement of low-cost UAV-based photogrammetric point cloud using MMS point cloud and oblique images for 3D urban reconstruction. Measurement. 2024. Vol. 226. N 114158. DOI: 10.1016/j.measurement.2024.114158
- Carabassa V., Montero P., Crespo M. et al. Unmanned aerial system protocol for quarry restoration and mineral extraction monitoring. Journal of Environmental Management. 2020. Vol. 270. N 110717. DOI: 10.1016/j.jenvman.2020.110717
- Rădulescu A.T., Rădulescu C.M., Kablak N. et al. Impact of Factors That Predict Adoption of Geomonitoring Systems for Landslide Management. Land. 2023. Vol. 12. Iss. 4. N 752. DOI: 10.3390/land12040752
- Memmolo A., Famiglietti N.A., Moschillo R. et al. UAS-LC-GNSS: Precision Surveying with a Low-Cost GNSS System for Commercial Drones. Rendiconti Online Societa Geologica Italiana. 2023. Vol. 60, p. 134-139. DOI: 10.3301/ROL.2023.37
- Famiglietti N.A., Cecere G., Grasso C. et al. A Test on the Potential of a Low Cost Unmanned Aerial Vehicle RTK/PPK Solution for Precision Positioning. Sensors. 2023. Vol. 21. Iss. 11. N 3882. DOI: 10.3390/s21113882
- Buzmakov S.A., Sannikov P.Yu., Kuchin L.S. et al. The use of unmanned aerial photography for interpreting the technogenic transformation of the natural environment during the oilfield operation. Journal of Mining Institute. 2023. Vol. 260, p. 180-193. DOI: 10.31897/PMI.2023.22
- Bailon-Ruiz R., Bit-Monnot A., Lacroix S. Real-time wildfire monitoring with a fleet of UAVs. Robotics and Autonomous Systems. 2022. Vol. 152. N 104071. DOI: 10.1016/j.robot.2022.104071
- Pitombeira K., Mitishita E. Influence of On-Site Camera Calibration with Sub-Block of Images on the Accuracy of Spatial Data Obtained by PPK-Based UAS Photogrammetry. Remote Sensing. 2023. Vol. 15. Iss. 12. N 3126. DOI: 10.3390/rs15123126
- Zeybek M., Taşkaya S., Elkhrachy I., Tarolli P. Improving the Spatial Accuracy of UAV Platforms Using Direct Georeferencing Methods: An Application for Steep Slopes. Remote Sensing. 2023. Vol. 15. Iss. 10. N 2700. DOI: 10.3390/rs15102700
- Ocalan T., Turk T., Tunalioglu N., Gurturk M. Investigation of accuracy of PPP and PPP-AR methods for direct georeferencing in UAV photogrammetry. Earth Science Informatics. 2022. Vol. 15. Iss. 4, p. 2231-2238. DOI: 10.1007/s12145-022-00868-7
- Kosarev N.S., Kolesnikov A.A., Reznik A.V. et al. The Use of Geospatial Data in the Industrially Disturbed Land Evaluation. Journal of Mining Science. 2023. Vol. 59. N 6, p. 1058-1065. DOI: 10.1134/S1062739123060182
- Poggi F., Montalti R., Intrieri E. et al. Spatial and Temporal Characterization of Landslide Deformation Pattern with Sentinel-1. Progress in Landslide Research and Technology. Springer, 2023. Vol. 2. Iss. 1, p. 321-329. DOI: 10.1007/978-3-031-39012-8_15
- Rehman M.U., Yi Zhang, Xingmin Meng et al. Analysis of Landslide Movements Using Interferometric Synthetic Aperture Radar: A Case Study in Hunza-Nagar Valley, Pakistan. Remote Sensing. 2020. Vol. 12. Iss. 12. N 2054. DOI: 10.3390/rs12122054
- Carabassa V., Montero P., Crespo M. et al. Unmanned aerial system protocol for quarry restoration and mineral extraction monitoring. Journal of Environmental Management. 2020. Vol. 270. N 110717. DOI: 10.1016/j.jenvman.2020.110717
- Zhiguo Pang, Qingguang Jin, Peng Fan et al. Deformation Monitoring and Analysis of Reservoir Dams Based on SBAS-InSAR Technology–Banqiao Reservoir. Remote Sensing. 2023. Vol. 15. Iss. 12. N 3062. DOI: 10.3390/rs15123062
- Gao Q., Crosetto M., Monserrat O. et al. Infrastructure monitoring using the interferometric synthetic aperture radar (InSAR) technique. The International Archives of the Photogrammetry, Remote Sensing and Spatial Information Sciences. 2022. Vol. XLIII-B3-2022, p. 271-276. DOI: 10.5194/isprs-archives-XLIII-B3-2022-271-2022
- Villarroya-Carpio A., Lopez-Sanchez J.M., Aguasca A. et al. Decorrelation rate and daily cycle in sub-daily time series of SAR coherence amplitude. Remote Sensing of Environment. 2024. Vol. 313. N 114358. DOI: 10.1016/j.rse.2024.114358
- Baek W.-K., Jung H.-S. Phase unwrapping of SAR interferogram from modified U-net via training data simulation and network structure optimization. Remote Sensing of Environment. 2024. Vol. 314. N 114392. DOI: 10.1016/j.rse.2024.114392
- Vellemu E.V., Katonda V., Yapuwa H. et al. Using the Mavic 2 Pro drone for basic water quality assessment. Scientific African. 2021. Vol. 14. N e00979. DOI: 10.1016/j.sciaf.2021.e00979
- Turner D., Lucieer A., de Jong S.M. Time Series Analysis of Landslide Dynamics Using an Unmanned Aerial Vehicle (UAV). Remote Sensing. 2015. Vol. 7. Iss. 2, p. 1736-1757. DOI: 10.3390/rs70201736
- Nizametdinov F.K., Nizametdinov N.F., Nizametdinov R.F., Oralbai A.O. Instrumental monitoring of ore stockpile stability in heap leaching area. Gornyi zhurnal. 2022. N 2, p. 19-22 (in Russian). DOI: 10.17580/gzh.2022.02.03
- Golser J., Steiner W. International and European standards for geotechnical monitoring and instrumentation. Geomechanics and Tunnelling. 2021. Vol. 14. Iss. 1, p. 63-77. DOI: 10.1002/geot.202000047
- Nizametdinov N.F., Baryshnikov V.D., Nizametdinov R.F. et al. Analysis of Ground Surface Displacements under the Influence of Repeated Mining Activities in the Zhezkazgan Area. Journal of Mining Science. 2021. Vol. 57. N 2, p. 184-189. DOI: 10.1134/S1062739121020022
- Kaftan V.I., Gvishiani A.D., Morozov V.N., Tatarinov V.N. Methods and results of determination of movements and deformations of the Earth’s crust according to GNSS data at the Nizhne-Kansk geodynamic test network in the area of radioactive waste disposal. Sovremennye problemy distantsionnogo zondirovaniya Zemli iz kosmosa. 2019. Vol. 16. N 1, p. 83-94 (in Russian). DOI: 10.21046/2070-7401-2019-16-1-83-94
- Akmatov D.Zh., Manevich A.I., Tatarinov V.N. et al. Assessment of rock massif sustainability in the area of the underground research laboratory (Nizhnekanskii Massif, Enisei site). Journal of Mining Institute. 2024. Vol. 266, p. 167-178.
- Mazurov B.T., Mustafin M.G., Panzhin A.A. Estimation Method for Vector Field Divergence of Earth Crust Deformations in the Process of Mineral Deposits Development. Journal of Mining Institute. 2019. Vol. 238, p. 376-382. DOI: 10.31897/PMI.2019.4.376
- Anisimov O.A. Parameters of loading faces of deep open pits at formation of work area with steeply inclined joints. Collection of scientific works of NSU. 2017. N 52, p. 47-56.
- Bessimbayeva О.G., Khmyrova E.N., Oleinikova E.A., Kasymzhanova A.E. Simulation of ash dump embankment stability. Mining Science and Technology. 2023. Vol. 8. Iss. 4, p. 303-312. DOI: 10.17073/2500-0632-2022-11-30