Investigation of the specific features of fracture of andesite and sandstone subjected to quasi-static and dynamic loading
- 1 — Ph.D. Researcher Institute of Continuum Media Mechanics, Ural Branch of the RAS ▪ Orcid
- 2 — Ph.D. Senior Researcher Institute of Continuum Media Mechanics, Ural Branch of the RAS ▪ Orcid
- 3 — Engineer Institute of Continuum Media Mechanics, Ural Branch of the RAS ▪ Orcid
- 4 — Ph.D. Researcher Institute of Continuum Media Mechanics, Ural Branch of the RAS ▪ Orcid
Abstract
An experimental study has been conducted on natural materials such as sandstone and andesite, which are commonly used in the mining, oil and gas industries, as well as in road construction. Cylindrical samples were tested under quasi-static and dynamic loads in fragment preservation conditions. X-ray tomography was used to determine the stages and mechanisms of destruction and the spread of cracks in the material before and after testing. The quasi-static uniaxial compression tests were performed, in which the deformation fields were measured, in situ, by using the digital image correlation method and acoustic emission signals. Analysis of the results revealed the specific features of fracture of andesite and sandstone samples. The destruction of andesite, which consists of hard and soft phases, follows a quasi-brittle scenario in the soft phase, with the size of the resulting fragments corresponding to the solid phase. When main vertical cracks spread throughout the entire volume of sandstone, which is a homogeneous material and consists of strong, loosely interconnected grains of sand, there was no sharp drop in its bearing capacity because friction forces between sand grains contribute significantly to holding them together, especially under compression conditions. Once the load was taken off, the sample broke up into pieces. The destruction of the tested samples subjected to quasi-static loading proceeds in two steps. The first step involves the accumulation of damages in the form of multiple main cracks coinciding with the direction of the maximum stress. During the second step, multiple daughter cracks are formed, which promotes the failure of the sample. In the case of dynamic compression, complete fragmentation of the sample occurred when the energy of the loading pulse was sufficient, and this was accompanied by the separation of the formed fragments. The results of this study are promising for the development of numerical fracture models intended to investigate the kinetics of defect nucleation and growth in rocks. These models can also be used to optimize the drilling processes.
This work was financially supported by the Russian Foundation for Basic Research and the Perm Region, project N 20-41-596013 and within the framework of the state assignment of PFIC UB RAS (grant N 124020200116-1).
Introduction
Rocks play a pivotal role in geological processes and are crucial for understanding the evolution of the Earth's crust. Studying their mechanical properties and the stages at which they transition to destruction [1] under the influence of various loads is an urgent task for modern geology and materials science. Quasi-static compression enables the study of slow, gradual processes in rocks, while dynamic compression models rapid, intense loads characteristic of natural disasters [2, 3] and geological processes [4-6], as well as mining processes, including explosive methods [7, 8].
Experimental and theoretical works [9] have studied mechanisms leading to deformation and destruction of condensed media, such as stony rocks [10-12], sandstones (clays) [13-15], glasses [16], liquids (as integral binders in rock) [17, 18], glass ceramics [19], ceramics (composites) [20, 21] and others [22, 23] in a wide range of loading speeds of 10–4-109 s–1. Such works are relevant to many areas of human activity, including motor engineering, machine engineering, aircraft engineering, shipbuilding, architecture, construction [24-26], mining, the oil and gas industry, [27-29] and space engineering [30]. Experimental [31, 32] and theoretical [33, 34] studies provide interpretations of forecasts and descriptions of the dynamics of the destruction process of rock samples.
In this research, in addition to the authors' fundamental study [35], a comprehensive study has been carried out on the most prevalent rocks encountered during drilling in the mining industry and during the construction of roads and railways: sandstone and andesite. Due to the diversity of these rocks, samples from different deposit sites may have significantly different strength properties. The dynamic destruction of sandstone and andesite is poorly documented. In order to establish the stages and mechanisms of the destruction of these rocks, an experimental study of materials under quasi-static and dynamic loads was conducted, with the simultaneous recording of acoustic emission signals (AE) [16] and deformation fields using digital image correlation method (DIC) [36, 37]. AE and DIC are currently becoming increasingly popular as methods for studying rock fracture. AE provides high sensitivity to changes in rock structure and enables the dynamics of fracture to be observed in real time, while image correlation analysis accurately determines the geometric parameters of cracks and their distribution. Together, these methods help evaluate the mechanical properties of rocks, predict their behaviour under stress and assess the stages of transition from damage to destruction.
Methods
Specimens
Research has been focused on two distinctive rocks that are frequently encountered during drilling, quarrying and road construction. The sandstone was provided by STC Gazpromneft (Botuobinsky horizon, intake depth 2920-2950 m, outside the exploration well field). Andesite is collected in the installation area of chairlift supports. This is on Elbrus, at an altitude of 2350 m above sea level. Elbrus is in the Kabardino-Balkarian Republic (Russia), in a village Terskol. Both types of material contain suspected quartzite elements. Cylindrical samples were cut out for testing. The maximum sample size was limited by the size of the diagnostic testing facility. To achieve the same initial conditions, the quasi-static compression samples were shaped identically. The scale factor was not investigated in this study. However, based on tomography data of sandstone and andesite samples, the characteristic scales of structural heterogeneity are smaller than the sample size. Therefore, it can be assumed that a sandstone sample of this size represents the formation from which it was taken; consequently, the scale factor has no influence on such samples. The sample parameters and loading conditions are presented in Table 1. The difference between the andesite and sandstone samples was that the density of the sandstone sample varied over a wider range – 2057-2600 kg/m3.
Table 1
Parameters and conditions of loaded samples
|
Material |
Sample number |
Loading method |
Average diameter d, mm |
Averageheight h, mm |
Density ρ, kg/m3 |
Initial mass m, g |
|
|
Sandstone |
San1, San2, San3, San4 |
DL |
10.80±0.01 |
10.20±0.01 |
2057-2600 |
1.82-2.58±0.0001 |
|
|
San5, San6 |
QSL |
1.9777±0.00012.0448±0.0001 |
|||||
|
Andesite |
Mou1 |
QSL |
11.06±0.01 |
11.79±0.01 |
2534 |
2545±48 |
2.8712±0.0001 |
|
Mou2 |
11.04±0.01 |
10.23±0.01 |
2528 |
2.4763±0.0001 |
|||
|
Mou3 |
DL |
11.05±0.01 |
11.24±0.01 |
2553 |
2.7522±0.0001 |
||
|
Mou4 |
11.06±0.01 |
11.48±0.01 |
2563 |
2.8278±0.0001 |
|||
Note. DL – dynamic loading; QSL – quasi-static loading.
Examination of the material composition by scanning electron microscopy and X-ray analysis methods
The elemental composition was studied using an X-ray K-series with the energy dispersion analysis system of the Oxford Instruments INCA X-ACT Spectrometer for a Hitachi S-3400 electron microscope. Knowing the chemical composition is necessary for identifying samples, as rocks from different deposits can vary. The chemical composition of the materials under study was examined using a Hitachi S-3400N scanning electron microscope with an INCA X-ACT spectrometer (under the supervision of V.P.Bachurikhin at the Laboratory of Electron Microscopy at Perm State National Research University). The composition of the San6 sandstone sample is presented in Table 2. The following elements predominate in this material: O (53.2-53.91 %), Si (23.26-25.28 %), i.e., quartzite that contains inclusions of Al (8.63-8.86 %), Fe (4.00-4.37 %), Na (2.08-2.79 %), K (2.37-2.62 %), and small amounts of Cl, Mg, Ca, Ti, S.
Table 2
Sandstone composition
|
Element |
Test 1 |
Test 2 |
||
|
Quantity, wt.% |
Volume, at.% |
Quantity, wt.% |
Volume, at.% |
|
|
O K |
53.20 |
67.85 |
53.91 |
68.36 |
|
Na K |
2.79 |
2.48 |
2.08 |
1.83 |
|
Mg K |
1.43 |
1.20 |
1.32 |
1.10 |
|
Al K |
8.86 |
6.70 |
8.63 |
6.49 |
|
Si K |
23.26 |
16.90 |
25.28 |
18.26 |
|
S K |
0.24 |
0.15 |
– |
– |
|
Cl K |
2.19 |
1.26 |
1.27 |
0.73 |
|
K K |
2.62 |
1.37 |
2.37 |
1.23 |
|
Ca K |
0.59 |
0.30 |
0.68 |
0.34 |
|
Ti K |
0.44 |
0.19 |
0.46 |
0.20 |
|
Fe K |
4.37 |
1.60 |
4.00 |
1.45 |
|
Total |
100 |
|
100 |
|
The composition of andesite (a fragment of the massif from which the samples were cut was analyzed) is presented in Table 3. The following elements predominate in the material under study: O (61.08-63.26 %), Si (23.79-24.63 %), Al (5.94-6.28 %), Na (2.86-3.58 %), K (1.46-1.50 %), the presence of Ca (0.770-0.95 %), Fe (0.37-0.89 %) is not excluded.
Andesite had white inclusions, which were analyzed with a microscope additionally (Table 4). The most abundant inclusions were quartzite SiO2 (O: 57.9-58.53 %, Si: 23.73-23.99 %) with a small admixture of Al, Na, Ca, Mg, K, and Fe.
For the purposes of comparative analysis, an additional study was carried out using electron scanning microscopy on quartzite obtained from the Central Plateau of Uganda (Africa) (Table 5): The SiO2 elemental content was found to be O 61.12-63.06 %, Si 36.94-38.88 %, with a small admixture of inclusions containing the following elements: O (53.3 %), Si (21.73 %), Al (13.53 %), K (6.76 %), Fe (2.83 %), Mg (1.16 %) and Na (0.68 %).
Table 3
Andesite composition
|
Element |
Test 1 |
Test 2 |
||
|
Quantity, wt.% |
Volume, at.% |
Quantity, wt.% |
Volume, at.% |
|
|
O K |
61.08 |
73.33 |
63.26 |
74.99 |
|
Na K |
2.86 |
2.39 |
3.58 |
2.95 |
|
Mg K |
2.15 |
1.70 |
0.49 |
0.38 |
|
Al K |
5.94 |
4.23 |
6.28 |
4.41 |
|
Si K |
24.63 |
16.84 |
23.79 |
16.06 |
|
K K |
1.50 |
0.74 |
1.46 |
0.71 |
|
Ca K |
0.95 |
0.46 |
0.77 |
0.36 |
|
Fe K |
0.89 |
0.31 |
0.37 |
0.13 |
|
Total |
100 |
|
100 |
|
Table 4
Composition of the white inclusions of andesite
|
Element |
Test 1 |
Test 2 |
||
|
Quantity, wt.% |
Volume, at.% |
Quantity, wt.% |
Volume, at.% |
|
|
O K |
57.90 |
70.88 |
58.53 |
71.45 |
|
Na K |
3.47 |
2.96 |
3.67 |
3.12 |
|
Al K |
9.76 |
7.09 |
8.83 |
6.39 |
|
Si K |
23.73 |
16.55 |
23.99 |
16.68 |
|
K K |
1.17 |
0.59 |
1.35 |
0.67 |
|
Ca K |
3.96 |
1.94 |
3.00 |
1.46 |
|
Fe K |
– |
– |
0.62 |
0.22 |
|
Total |
100 |
|
100 |
|
Table 5
Composition of quartzite and its inclusions
|
Element |
Test 1 |
Test 2 |
Composition of inclusions |
|||
|
Quantity, wt.% |
Volume, at.% |
Quantity, wt.% |
Volume, at.% |
Quantity, wt.% |
Volume, at.% |
|
|
O K |
61.12 |
73.40 |
63.06 |
74.98 |
53.30 |
67.88 |
|
Na K |
– |
– |
– |
– |
0.68 |
0.61 |
|
Mg K |
– |
– |
– |
– |
1.16 |
0.98 |
|
Al K |
– |
– |
– |
– |
13.53 |
10.22 |
|
Si K |
38.88 |
26.60 |
36.94 |
2.02 |
21.73 |
15.76 |
|
K K |
– |
– |
– |
– |
6.76 |
3.52 |
|
Fe K |
– |
– |
– |
– |
2.83 |
1.03 |
|
Total |
100 |
|
100 |
|
100 |
|
The phase composition of the presented rocks (quartzite, andesite and sandstone) was determined using X-ray diffraction analysis. The studies were carried out using the powder method, and an URS-60 X-ray machine with an RCU camera (d = 114.6 mm) was used to take photographs on photographic film, the anode emits Co radiation. The X-ray images obtained are shown in Fig.1. All of the rocks presented have a crystalline structure. There is no halo corresponding to the amorphous phase. Based on the elemental composition data, it can be assumed that the quartzite material is pure SiO2 (Fig.1, a). Interplanar distances were estimated from the X-ray image in Fig.1, a, and compared with tabular values which made it possible to suggest that α-quartz dominates in quartz. The lines on the X-ray images in Fig.1, а coincide with those in Fig.1, b, c, therefore, materials from andesite and sandstone also contain large quantities of α-quartz, which is consistent with the elemental composition results. However, andesite and sandstone contain additional phases. The elemental composition shows that natural materials contain a small amount of dolomite (CaCO3·MgCO3). The radiograph (Fig.1, b) shows the three most intense lines of interplanar distances d/n = 2.89; 2.19; 1.80, which correspond to dolomite; in Fig.1, c there is one most intense line with an interplanar distance d/n = 2.89, which also corresponds to dolomite (marked with an arrow).
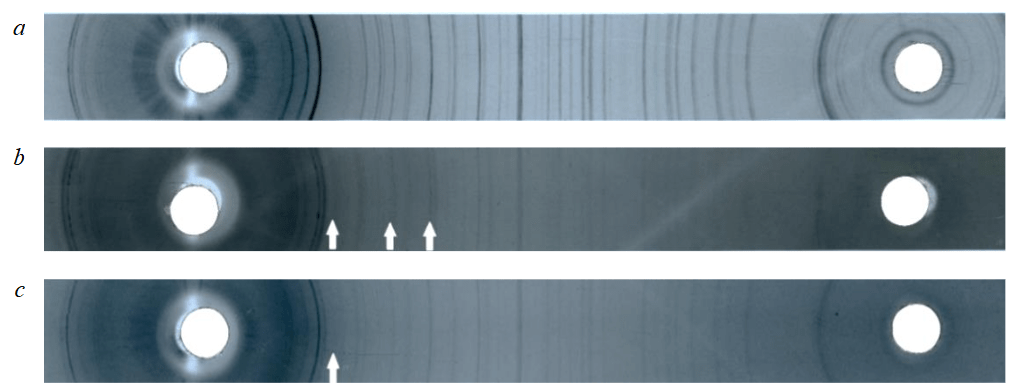
Fig.1. X-ray radiograms of the studied rocks: quartzite (a); andesite (b); sandstone (c)
Although the determination of the phase composition of rocks via X-ray diffraction analysis can be a cumbersome process, the use of this method in combination with the method of identifying the elemental composition and comparing the diffraction patterns of known substances can ensure the rapid determination of the phase composition of rocks and the presence of amorphous or crystalline phases.
Quasi-static loading of rocks
The quasi-static uniaxial compression tests of the samples made of sandstone and andesite were carried out on an electromechanical universal compression testing machine, Shimadzu AG-X plus, in conjunction with the TRAPEZIUM X application. The deformation fields were measured in situ by digital image correlation methods. The AE detection sensors were attached to the upper and lower rails of the Shimadzu AG-X plus loading machine. The LaVision Imager pro X camera was installed in front of the sample in order to record the deformation fields. The fragments were preserved due to the application of a cylindrical, transparent PMMA screen mounted on the lower traverse. The loading rate for all samples (San5, San6, Mou1 and Mou2) was the same: 0.5 mm/min (8.3·10–6 m/s) and the deformation rate was ~10–3 s–1. The dependence of the load force on the upper traverse stroke is shown in Fig.2, a, b. The curves plotted for the andesite samples (Mou1 and Mou2) show jumps associated with the formation of cracks that do not result in the sample losing all of its bearing capacity. After reaching the peak load (~9 and 13.2 kN, respectively), the samples were destroyed. In contrast to sandstone, the behavior of the andesite samples was similar to that of composite ceramics [20]. When the sandstone samples were destroyed, the maximum load forces (before destruction) were ~2.75 kN (San6) and ~2.85 kN (San5), but then the samples are probably compacted (Fig.2, c); in Fig.2, b the exit to the plateau is observed at the same F value of ~0.8-1.2 kN (~8-12 MPa). Consequently, sandstone behaves like plastic materials with a pronounced yield strength, meaning that the destruction of the material occurs as a result of sliding (shifting) of its layers along certain planes in a manner similar to that observed for plastic materials. Sandstone retains its bearing capacity and shape after reaching its ultimate strength.
The average strain value was estimated for the following andesite samples: Mou1 ~3 %, Mou – 2 5 %, sandstone 2.5 %. The strain modulus values are estimated at ~3.1-2.8 GPa for andesite and 1.2 GPa for sandstone. The data obtained under quasi-static loading was then used to determine the length and speed of the impactor for the dynamic loading of the samples. Fig.2, c-e shows the appearance of some sandstone and andesite samples immediately after loading. These samples are characterized by the presence of multiple main cracks along their height and the formation of a large number of fragments of a similar height. Fig.3. presents the results of signal processing by the AE registration system for andesite and sandstone samples subjected to quasi-static loading. At the first stage, single pulses (in the first 50-70 s) associated with the nucleation of main cracks are recorded, the occurrence of multiple pulses (from 70-80 s onwards) is characteristic of the stage of consolidation of cracks, which leads to the complete destruction of the sample. Fig.3, e, f, demonstrates the probability of pulse energy distribution being greater than a certain set value. Kinks are associated with the transient mechanisms occurred during the process of sample destruction. The extended step in the cumulative pulse energy distribution for sandstone (Fig.3, f) can be related to the mechanism responsible for the pseudoplastic destruction of these samples.
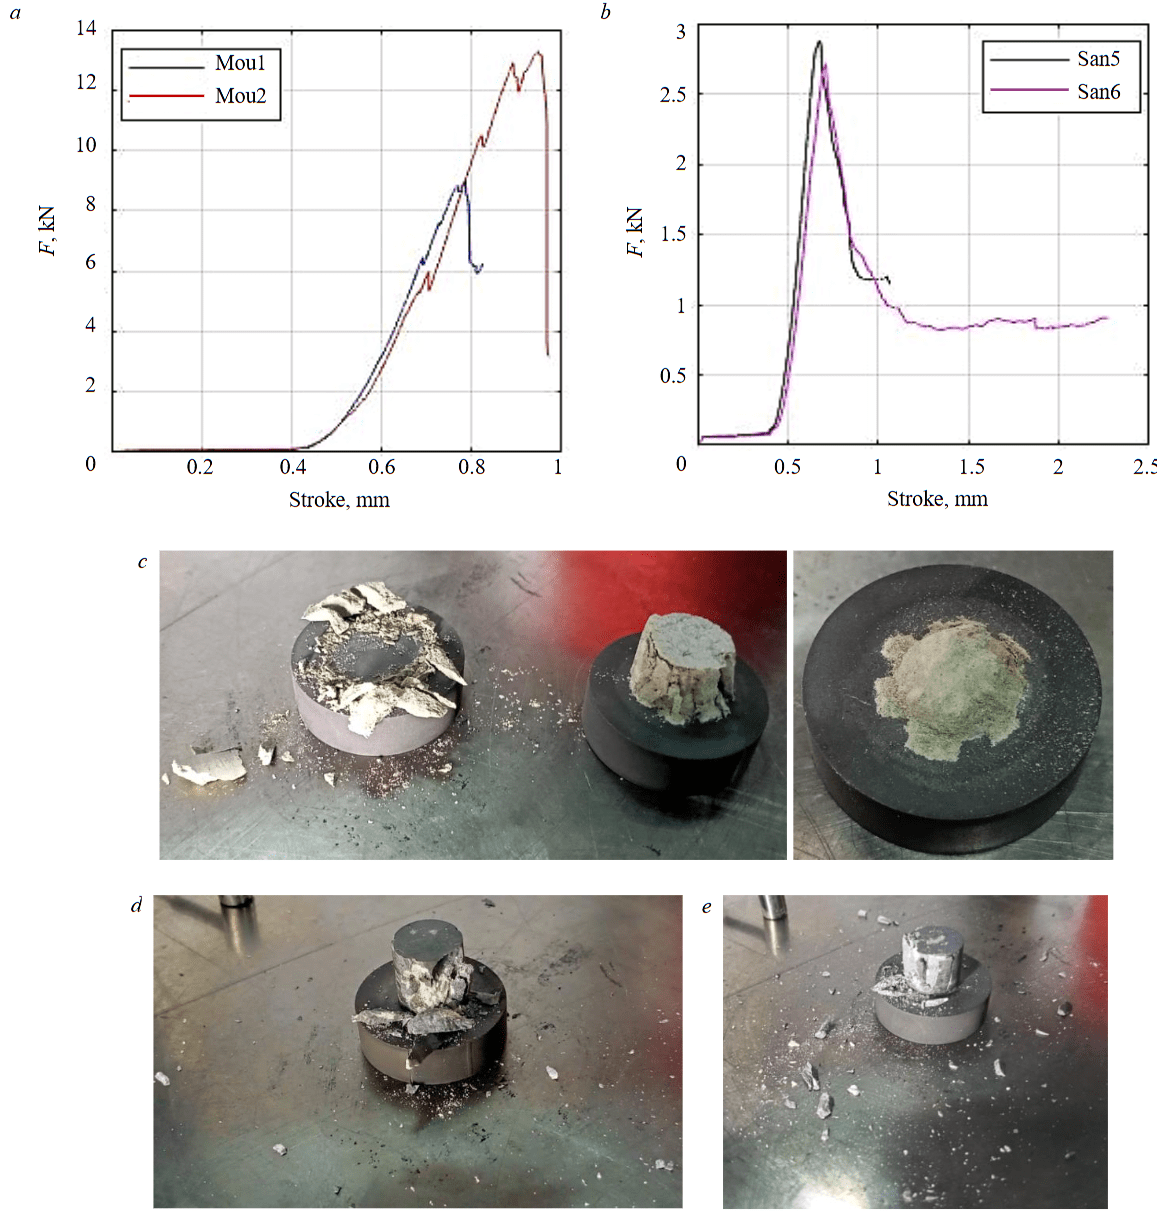
Fig.2. Dependences of the applied force on the stroke of the upper crosshead of the Shimadzu AG-X plus testing machine for andesite (a) and sandstone (b), and the appearance of sandstone San6 (c) and andesite Mou1 (d), Mou2 (e) specimens after QSL
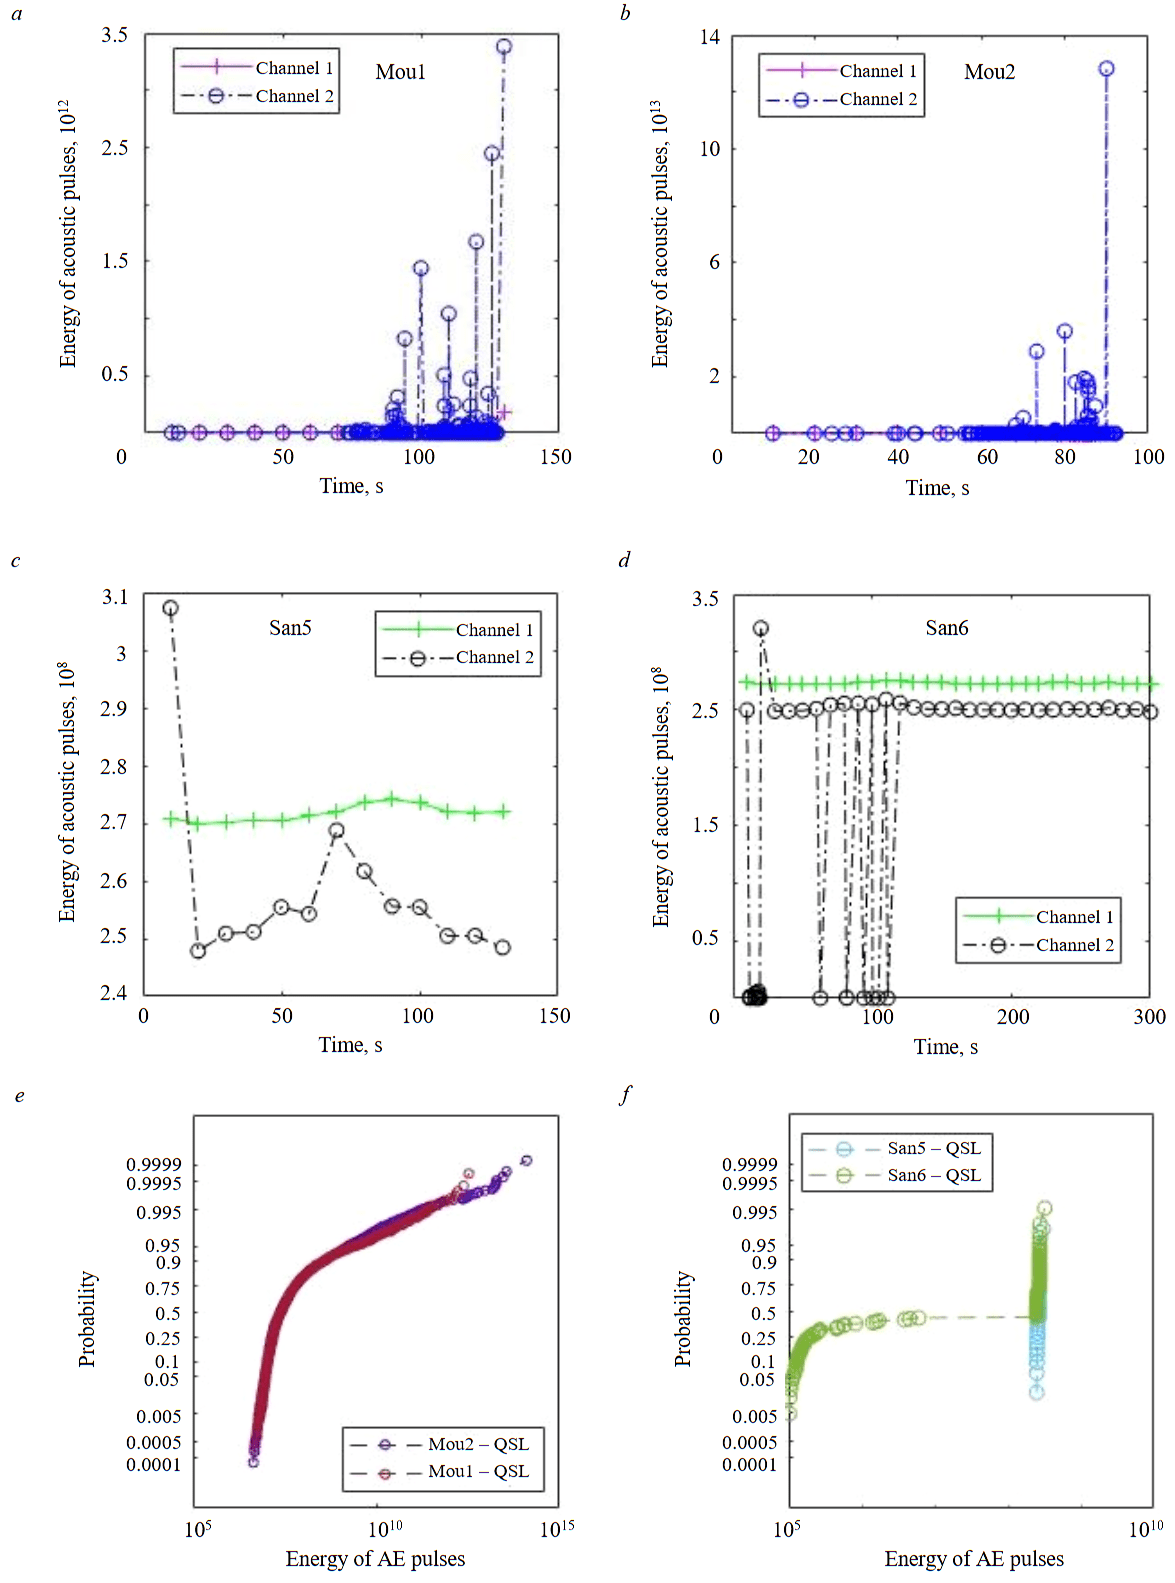
Fig.3. Acoustic pulses energy signals over time for andesite (a, b) and sandstone (c, d) samples, and the probability distribution of the pulse energy at fracture in andesite (e) and sandstone (f) samples
The strain field data obtained by the DIC method during the quasi-static compression tests of andesite (Fig.4, а) and sandstone (Fig.4, b) samples are presented. Cracking of the material and formation of a mesh structure along quartzite grain boundaries are observed in the Mou1 and Mou2 samples during loading (Fig.4, а). At a critical moment, the sample breaks into a large number of medium-sized, three-dimensional fragments and collapses. In the sandstone samples (Fig.4, b), a vertical trunk crack is clearly visible, and many daughter cracks appear throughout the volume at a critical stage of the experiment. The sample breaks down into large fragments and individual grains of sand. As the X-ray tomography data showed, cracks in natural material samples cannot be ruled out prior to testing.
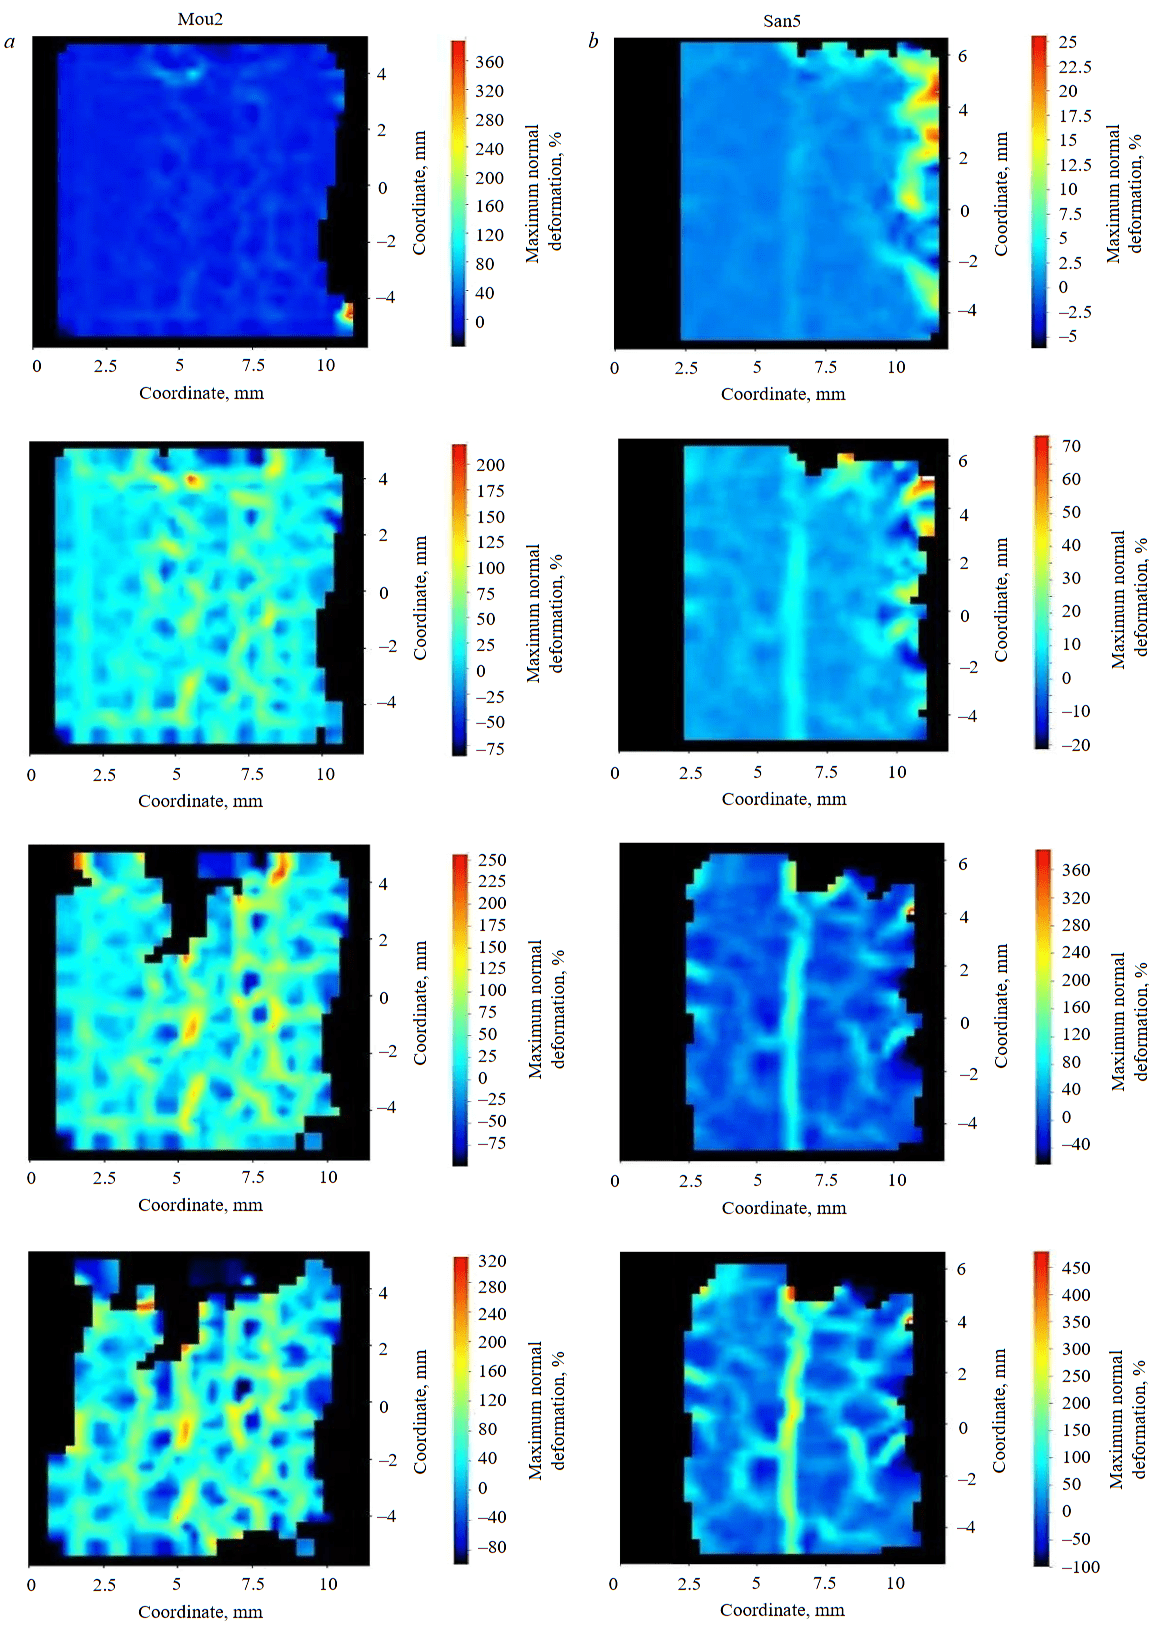
Fig.4. Strain field data obtained by the DIC method for the andesite sample Mou2 (a) and the sandstone sample San5 (b) under quasi-static compression conditions
The dynamic loading of the samples (sandstone and andesite) was carried out under fragment preservation conditions on a modified Hopkinson split bar (RSG-25) in the Laboratory of Physical Foundations of Strength at the ICMM UB RAS in Perm. The experimental parameters (the length and speed of the impactor) were chosen so that the maximum possible pressure and deformation on the sample would be sufficient to destroy it. The quasi-static loading data were used to estimate these values. The dynamic loading of the andesite samples (Mou3 and Mou4) was carried out at impactor velocities of 9.8 and 20.8 m/s. When the maximum stress values were obtained for (loading stress σ = 143 MPa, strain ε = 7.5·10–3) the strain rate ε· was 430 s–1, for Mou4 (σ = 428 MPa, ε = 15.3·10–3) it was 1353 s–1 (Fig.5, а). The fracture energy value was determined as the area under the deformation curve up to σmax for the Mou3 sample (0.84 out of a possible 1.7 J) and for the Mou4 sample (5.2 out of a possible 9.8 J). As the Mou3 sample was subjected to a lower impactor velocity, it was not completely destroyed; however, X-ray tomography analysis revealed that it was riddled with cracks throughout the volume. The other sample was completely fragmented, and its fragmentation statistics was analyzed. Despite the bulk content of quartzite in the material, the fractoluminescence of these samples could not be properly detected; the signals were weak.
The dynamic loading of the cylindrical sandstone samples was carried out at strain rates ranging from 863 to 1447 s–1 and stresses ranging from 603.8 to 44.8 MPa. The results of the data processed from the RSG-25 recording equipment are shown in Fig.5, b. The loading energy of the samples was estimated as the area under the stress – strain curve: San1 – 2.3; San2 – 1.75; San3 – 8.3; San4 – 6.38 J. All samples were destroyed in fragment preservation mode (at least 98 % of the initial mass of the sample was retained).
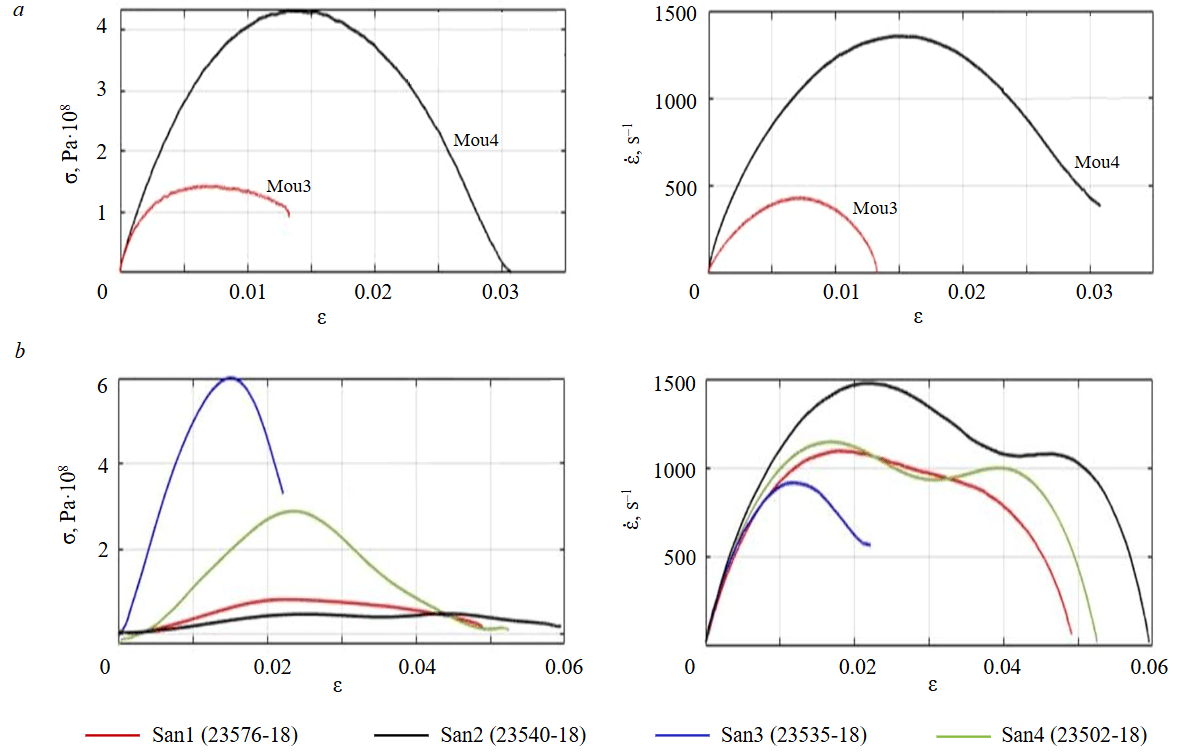
Fig.5. Dependence of loading stress and strain rate on the strain value of andesite (a) and sandstone samples (b)
X-ray tomography examination of samples
To determine the spread of cracks and the formation of the fracture surface, samples were examined on a Bruker X-ray tomograph (ICMM, UB RAS, Perm) before and after testing. The final destruction of the material is influenced by both the loading conditions and the material's properties and any defects (e.g. pores or cracks) present prior to testing. This report presents an analysis of X-ray tomography of sandstone (San7 is a sample from the same batch as San5 and San6), and andesite (Mou3 and Mou4) samples. Before testing, the andesite and sandstone samples were found to be heterogeneous, containing inclusions of other materials, as confirmed by Hitachi S-3400N electron scanning microscopy and X-ray diffraction analysis. Cracks were observed in the sandstone samples (Fig.6, a-c), unlike the andesite samples (Fig.6, d-f). The samples contain inhomogeneities of the same density, which are highlighted in one color in the below images. After the tests, samples that had not fragmented completely were examined.
Despite the presence or absence of small cracks in the sandstone samples, destruction by quasi-static compression proceeded according to a single scenario: damage accumulation throughout the sample's volume, followed by the formation of main cracks along its height and subsequent destruction (see Fig.4, b). Some photographs showing the cross sections of the San5 sample after quasi-static compression are presented in Fig.7, а. While the large fragment has not collapsed, cracks are visible inside it along the entire height of the sample. The main fracture surface of the large fragment is hourglass-shaped.
Following dynamic loading at an impactor velocity of 9.8 m/s, cracks were recorded throughout the entire volume of the deformed andesite Mou3 sample (Fig.7, b) using an X-ray tomograph. Despite the presence of white and grey inclusions in the material, the cracks spread through them rather than along their boundaries, indicating that these inclusions have little influence on the nature of crack propagation.
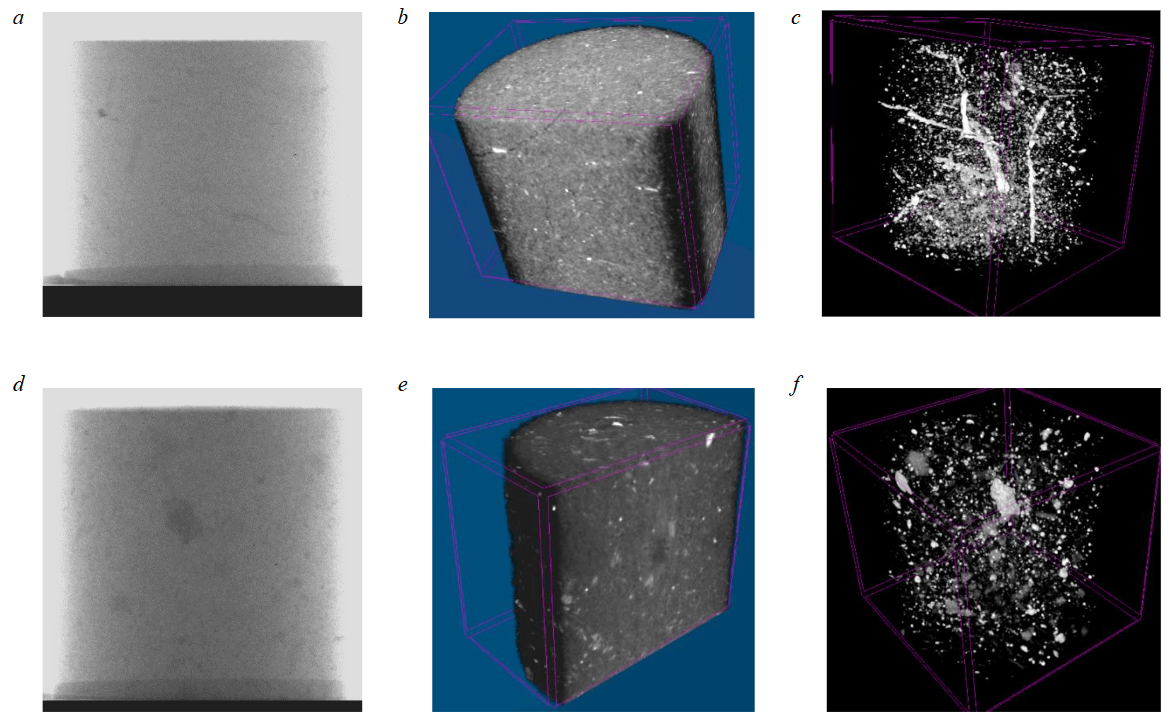
Fig.6. X-ray tomography results before loading: appearance of sandstone samples (San7) and andesite (Mou4) (a, d); image of their cross sections (b, e) and 3D images of specks in the samples – gray and white areas (c, f)
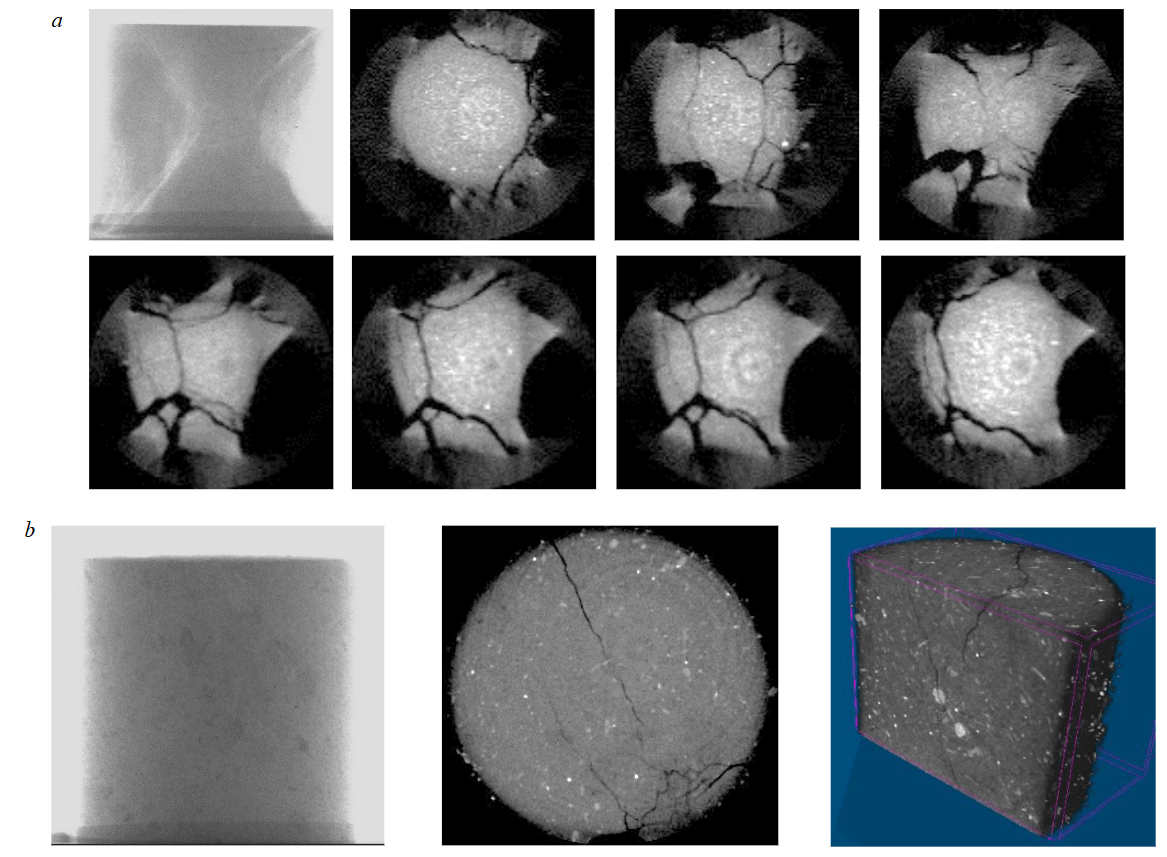
Fig.7. Results of Bruker X-ray tomograph data processing: а – photos of the sandstone sample (San5) and its height cross sections at 1.5-2 mm intervals after quasi-static compression; b – image of the andesite sample (Mou3) after dynamic compression (from left to right): lateral view, height section near the upper base, lateral section
Discussion
Experiments and data analysis have shown that andesite consists of hard and soft phases. The sizes of the fragments correspond to the hard phase and destruction occurs in the soft phase. Such a material undergoes quasi-brittle destruction. Sandstone is a homogeneous material consisting of strong, loosely interconnected grains of sand. Therefore, despite vertical cracks forming throughout the sample's entire volume, there is no sharp drop in bearing capacity as the grains of sand continue to be held together by friction forces under compression conditions. Once the load is removed, the sample disintegrates into fragments.
The assumption was made that the phase composition could have an impact on the formation of cracks when the samples were subjected to quasi-static and especially dynamic loading. To test these theories, X-ray tomography of the samples was carried out before and after fracture, and the DIC method was used during the experiment. Analysis of andesite using the DIC method revealed that fractures occur along the boundaries of inclusions of different phases. In contrast, in sandstone with a more homogeneous phase composition, one main crack and one or more daughter cracks form at the final critical stage of deformation (see Fig.4). X-ray tomography enabled us to observe how the main cracks pass through samples with an inhomogeneous phase composition and to identify areas of damage. Only by comparing DIC and tomography data can a complete picture of rock destruction during loading be created. However, DIC data alone are insufficient to draw unambiguous conclusions about the process of rock destruction and the development of damage throughout the entire sample. This is because the locations of the cracks on the sample surface (see Fig.4) do not provide a comprehensive overview of the experiment and the destruction is of a completely different nature (Fig.7).
Conclusion
Rock samples (sandstone and andesite) were tested under quasi-static and dynamic loads at various deformation rates (10–3-103 s–1) with preservation of the fragments. Some of the experiments were performed with in situ registration of acoustic emission, fractoluminescence, and DIC. Analysis of the resulting data has shown that the destruction of natural materials is influenced by both loading conditions and the characteristics of the material under study, such as density, defective structure (pores and cracks), and elemental composition. The destruction of the samples under quasi-static loading occurred in two stages. The first stage was the accumulation of damage. This was the appearance of many minor cracks. The second stage was subsequent complete destruction [35]. In the case of dynamic compression, complete fragmentation of the sample occurred when the energy of the loading pulse was sufficient, and this process was accompanied by the separation of the formed fragments.
To obtain a complete picture, it is necessary to compare the acoustic emission (AE) and digital image correlation (DIC) data with the results of the analysis of rock fragmentation statistics and the morphology of the fracture surface. The study of acoustic emission during loading was carried out to analyze the stages of the transition process from damage accumulation to macroscopic material loading. For andesite samples (see Fig.3, a, b), two stages were distinguished based on the pulse energy. At the initial stage, the pulse energy almost does not exceed the threshold value; as the critical stage is approached, high-energy pulses appear. For sandstone samples (see Fig.3, c, d) the energy of the acoustic emission signals remains at the same level, except for some bursts during the formation of sliding cracks. Analysis of the graphs for the probability distribution of the pulse energy plotted for tested andesite and sandstone (see Fig.3, e, f) makes it possible to reveal an inflection point that corresponds to the transition of AE pulse energy from the stage of damage accumulation to the critical stage of destruction. The separation of destruction stages shows that the validity of the methodology of controlled fragmentation can be effectively tested in laboratory conditions.
These results are used to create numerical models of rock fracture. These models consider the multiscale kinetics of defect nucleation and growth as a critical phenomenon (structural scaling transitions). Currently, the number of samples tested is insufficient to draw conclusions about the reliability of the results, but it is planned to use these data to optimize the actual drilling processes in the future (with a larger sample size).
Determination of the model parameters based on the laboratory experiments on the fragmentation of rock samples in the required range of loading intensities is an issue of great interest. Statistical and kinetic fragmentation patterns are recorded using independent methods, such as size (mass) distribution of fragments, fractoluminescence signal kinetics and acoustic emission. Processing of the statistical distributions of fragments in terms of the size and fracture kinetics permits the assessment of criticality patterns. The optimal modes for implementing drilling processes correspond to the multiple self-sustaining fragmentation and are determined by the dynamics of load application. Fluctuations in acoustic emission signals can be associated with rock fragmentation and the formation of structures during drilling.
References
- Makarov P.V., Smolin I.Yu., Peryshkin A.Yu. et al. Experimental and Numerical Investigation of the Catastrophic Stage of Failure on Different Scales from Rock Sample to Coal Mine. Physical Mesomechanics. 2021. Vol. 24. N 2, p. 155-165. DOI: 10.1134/S1029959921020053
- Victorov S.D., Kochanov A.N., Odintsev V.N. Fragmentation of Coal Samples upon Intense Dynamic Impact. Bulletin of the Russian Academy of Sciences: Physics. 2019. Vol. 83. N 6, p. 673-676. DOI: 10.3103/S1062873819060376
- Martemyanov A.N., Petrov Yu.V. Comprehensive Study of Sandstone Dynamic Strength Based on the Incubation Time Criterion. Journal of Applied Mechanics and Technical Physics. 2019. Vol. 60, N 3, p. 539-547. DOI: 10.1134/S0021894419030179
- Xibing Li, Fengqiang Gong, Ming Tao et al. Failure mechanism and coupled static-dynamic loading theory in deep hard rock mining: A review. Journal of Rock Mechanics and Geotechnical Engineering. 2017. Vol. 9. Iss. 4, p. 767-782. DOI: 10.1016/j.jrmge.2017.04.004
- Hong-bo Du, Feng Dai, Yi Liu et al. Dynamic response and failure mechanism of hydrostatically pressurized rocks subjected to high loading rate impacting. Soil Dynamics and Earthquake Engineering. 2020. Vol. 129. N 105927. DOI: 10.1016/j.soildyn.2019.105927
- Yuan Xu, Feng Dai, Hongbo Du. Experimental and numerical studies on compression-shear behaviors of brittle rocks subjected to combined static-dynamic loading. International Journal of Mechanical Sciences. 2020. Vol. 175. N 105520. DOI: 10.1016/j.ijmecsci.2020.105520
- Nurxonov X., Latipov Z., Saidov K., Islomov M. Influence of stress-strain state of rocks on blasting parameters during underground mining workings. Universum: tekhnicheskie nauki. 2024. N 5-4 (122), p. 35-38 (in Russian).
- Zairov Sh., Karimov Y., Latipov Z. et al. Development of a method for blasting rocks while preserving the geological structure of ore bodies. Universum: tekhnicheskie nauki. 2023. N 12-4 (117), p. 17-21 (in Russian).
- Yang Ye, Thoeni K., Yawu Zeng et al. Numerical Investigation of the Fragmentation Process in Marble Spheres Upon Dynamic Impact. Rock Mechanics and Rock Engineering. 2020. Vol. 53. Iss. 3, p. 1287-1304. DOI: 10.1007/s00603-019-01972-9
- Karasev M.A., Petrushin V.V., Rysin A.I. The hybrid finite/discrete element method in description of macrostructural behavior of salt rocks. Mining Informational and Analytical Bulletin. 2023. N 4, p. 48-66 (in Russian). DOI: 10.25018/0236_1493_2023_4_0_48
- Vinogradov Yu.I., Khokhlov S.V., Zigangirov R.R. et al. Optimization of specific energy consumption for rock crushing by explosion at deposits with complex geological structure. Journal of Mining Institute. 2024. Vol. 266, p. 231-245.
- Shcherbakov I.P., Chmel A.E. Random and cooperative accumulation of intra- and intergranular defects in granite subject to high-temperature impact fracture. Russian Geology and Geophysics. 2016. Vol. 57. N 11, p. 1646-1652. DOI: 10.1016/j.rgg.2016.10.010
- Yan Cheng, Lockner D., Duda M. et al. Interlaboratory comparison of testing hydraulic, elastic, and failure properties in compression: lessons learned. Environmental Earth Sciences. 2023. Vol. 82. Iss. 21. N 509. DOI: 10.1007/s12665-023-11173-x
- Eremeyev V.A., Balandin Vl.Vas., Balandin Vl.Vl. et al. Experimental study and numerical simulation of the dynamic penetration into dry clay. Continuum Mechanics and Thermodynamics. 2023. Vol. 35. Iss. 2, p. 457-469. DOI: 10.1007/s00161-023-01189-w
- Vinciguerra S.C., Greco A., Pluchino A. et al. Acoustic Emissions in Rock Deformation and Failure: New Insights from Q-Statistical Analysis. Entropy. 2023. Vol. 25. Iss. 4. N 701. DOI: 10.3390/e25040701
- Kuksenko V.S., Makhmudov Kh.F. Fracture in heterogeneous materials: experimental and theoretical studies. Russian Geology and Geophysics. 2017. Vol. 58. N 6, p. 738-743. DOI: 10.1016/j.rgg.2016.09.030
- Desyatnikova M.A., Ignatova O.N., Raevskii V.A. et al. Dynamic model of the growth and collapse of pores in liquids and solids. Combustion, Explosion, and Shock Waves. 2017. Vol. 53. N 1, p. 103-109. DOI: 10.1134/S0010508217010142
- Radzyuk A.Yu., Istyagina E.B., Kulagin V.A. et al. Methods and Means of Determination Dynamic Strength of Water. Journal of Siberian Federal University. Engineering & Technologies. 2023. Vol. 16 (3), p. 258-271.
- Okuma G., Maeda K., Yoshida S. et al. Morphology of subsurface cracks in glass-ceramics induced by Vickers indentation observed by synchrotron X-ray multiscale tomography. Scientific Reports. 2022. Vol. 12. N 6994. DOI: 10.1038/s41598-022-11084-0
- Davydova M.M., Uvarov S.V., Naimark O.B. Space-time Scale Invariance in Dynamically Fragmented Quasi-Brittle Materials. Physical Mesomechanics. 2016. Vol. 19. N 1, p. 86-92. DOI: 10.1134/S1029959916010094
- Grady D.E. Hugoniot equation of state and dynamic strength of boron carbide. Journal of Applied Physics. 2015. Vol. 117. Iss. 16. N 165904. DOI: 10.1063/1.4918604
- Roters F., Diehl M., Shanthraj P. et al. DAMASK – The Düsseldorf Advanced Material Simulation Kit for modeling multi-physics crystal plasticity, thermal, and damage phenomena from the single crystal up to the component scale. Computational Materials Science. 2019. Vol. 158, p. 420-478. DOI: 10.1016/j.commatsci.2018.04.030
- Fengbo Han, Roters F., Raabe D. Microstructure-based multiscale modeling of large strain plastic deformation by coupling a full-field crystal plasticity-spectral solver with an implicit finite element solver. International Journal of Plasticity. 2020. Vol. 125, p. 97-117. DOI: 10.1016/j.ijplas.2019.09.004
- Makeev A.I. Formation of the route of the main crack of destruction in the multi-level structure of conglomerate building composites. Building and Reconstruction. 2023. N 5, p. 119-131 (in Russian). DOI: 10.33979/2073-7416-2023-109-5-119-131
- Valavi M., Casar Z., Mohamed A.K. et al. Molecular dynamic simulations of cementitious systems using a newly developed force field suite ERICA FF. Cement and Concrete Research. 2022. Vol. 154. N 106712. DOI: 10.1016/j.cemconres.2022.106712
- Sokolova Yu.A., Kondrashchenko V.I., Kesariiskyi O.G. Calculated and experimental studies of internal stresses in construction materials. Expert: Theory and Practice. 2020. N 4 (7), p. 60-65 (in Russian). DOI: 10.24411/2686-7818-2020-10037
- Protosenya A.G., Iovlev G.А. Prediction of spatial stress–strain behavior of physically nonlinear soil mass in tunnel face area. Mining Informational and Analytical Bulletin. 2020. N 5, p. 128-139 (in Russian). DOI: 10.25018/0236-1493-2020-5-0-128-139
- Korshunov V.A., Pavlovich A.A., Bazhukov A.A. Evaluation of the shear strength of rocks by cracks based on the results of testing samples with spherical indentors. Journal of Mining Institute. 2023. Vol. 262, p. 606-618. DOI: 10.31897/PMI.2023.16
- Sakuma H., Lockner D.A., Solum J., Davatzes N.C. Friction in clay-bearing faults increases with the ionic radius of interlayer cations. Communications Earth & Environment. 2022. Vol. 3. N 116. DOI: 10.1038/s43247-022-00444-3
- Katsuragi H. Physics of Soft Impact and Cratering. Springer, 2016. 307 p. DOI: 10.1007/978-4-431-55648-0
- Shkuratnik V.L., Kravchenko O.S., Filimonov Yu.L. Acoustic Emission of Rock Salt at Different Uniaxial Strain Rates and Under Temperature. Journal of Applied Mechanics and Technical Physics. 2020. Vol. 61. N 3, p. 479-485. DOI: 10.1134/S0021894420030207
- Potokin A.S., Pak A.K. Study of acoustic and electromagnetic emissions under uniaxial compression of hard rock samples. Naukosfera. 2020. N 11 (2), p. 86-91 (in Russian). DOI: 10.5281/zenodo.4309468
- Kulkov D.S., Imashev S.A. Analysis of acoustic emission signals in geomaterial specimens during uniaxial compression. Proceedings of the Kyrgyz State Technical University named after I.Razzakov. 2019. N 2-1 (50), p. 274-280 (in Russian).
- Panteleev I.A., Mubassarova V.A., Zaitsev A.V. et al. Features of Kaiser effect manifestation under triaxial disproportional compression of sandstone with reorientation of applied stresses. Fundamentalnye i prikladnye voprosy gornykh nauk. 2023. Vol. 10. N 1, p. 69-76 (in Russian). DOI: 10.15372/FPVGN2023100110
- Bannikova I.A., Uvarov S.V., Chudinov V.V., Naimark O.B. Scaling laws in fragmentation dynamics of ceramics and natural materials. Procedia Structural Integrity. 2023. Vol. 47, p. 602-607. DOI: 10.1016/j.prostr.2023.07.063
- Panteleev I.A., Plekhov O.A., Naimark O.B. et al. Features of strain localization in sylvinite under tension. PNRPU Mechanics Bulletin. 2015. N 2, p. 127-138 (in Russian). DOI: 10.15593/perm.mech/2015.2.08
- Udartsev А.А. Analiysis of deformation fields by digital images correlation of rock samples with defect in uniaxial compression. Analiz poley deformacii metodom korrelyacii cifrovyh izobrageniy obrazcov gornyh porod s defectom pri odnoosnom szgatii. (In Russian), Gornoe ekho. 2019. N 3 (76), p. 34-37. DOI: 10.7242/echo.2019.3.9