
Crustal movement model in the ITRF2020 – a case study in Northern Vietnam
- 1 — Ph.D. Dean Hanoi University of Natural Resources and Environment ▪ Orcid
- 2 — Dean Hanoi University of Natural Resources and Environment ▪ Orcid
Abstract
In the North area of Vietnam, the crustal movement velocity of 38 GNSS points belonging to different international Earth reference frames (ITRF2000, ITRF2005, ITRF2008) is adjusted to the international Earth reference frame ITRF2020. This is the latest frame up to now. Since then, the picture of crustal movement in the North area of Vietnam has been unified in a dynamic coordinate system. In the study area, the rate of crustal movement is about 35 mm/year, and the direction of displacement is from northwest to southeast. To build a model of the crustal movement of the Earth in the northern area of Vietnam, the movement velocity data of 38 stations in ITRF2020 is evaluated with high accuracy. All points are also satisfactory. And then, the crustal movement velocity model is built by using the collocation method in the form of the 3-order Markov function. Within 38 stations, 34 stations are used to build the model and 4 remaining stations are used as checked stations. The obtained results show that the Earth's crust movement velocity model has an accuracy of about 2 mm/year for movement velocity and 2 deg for movement direction. This is the first model of Earth's crust movement in the North of Vietnam that has been built in the latest dynamic coordinate system ITRF2020. These results have important significance in the research and practical application of the movement of the Earth's crust. The steps of building the movement velocity model in this study can be applied to other experimental areas in the territory of Vietnam.
None
Introduction
The Global Navigation Satellite System (GNSS) is being widely used in the world to monitor the deformation of the Earth’s crust [1-3] and has supported forecasting and warning earthquakes [4-6] tectonic movement [7-9]. During the processing of GNSS station location time series, the time series of GNSS coordinates is used to model the movement of the Earth's crust [10-12]. The use of time series in determining the Earth's crust movement through continuous GNSS measurements was conducted [13-15]. Similarly, the determination of horizontal movement in the Northwest area of Vietnam's Earth's crust is also accomplished through periodic GPS measurements [16, 17].
From the 1990s to the present, GNSS technology has been used in Vietnam to study the movement of the Earth’s crust. The movement velocity values at the stations defined in the dynamic coordinate systems (ITRF94, ITRF2000, ITRF2005, ITRF2008, ITRF2014) are different and inconsistent, making it difficult to build a movement velocity model. To build the movement model of the Earth’s crust, we transfer the movement velocities of the GNSS stations to the same coordinate system and model them. There are two methods for transforming: collect and reprocess all data in a single ITRF; collect velocities of the stations, along with corrections. The first way, the collecting, and processing of data are very complicated and time-consuming [18-20]; the second way, the data processing is fast and more accurate [21-23]. In this paper, we use the second one to correct the movement velocities of the GNSS stations into one dynamic coordinate system ITRF2020 – the latest version of ITRF, which is more accurate than the previous versions [24-26]. The ITRF2020 released in 2021. Transformation parameters between ITRF2020 and other ITRFs can be found on the website. And the least-squares collocation method is used to model the movement velocity of the Earth’s crust [27-29]. This is a mathematical function with high accuracy and reliability.
The GNSS stations of various ITRFs in the North area of Vietnam are chosen in this case:
- the movement velocity in ITRF2000 of GNSS stations which supports studying the Red River fault systems, Dien Bien Phu fault, Song Da River fault [30];
- the movement velocity in ITRF2005 of GNSS stations in Vietnam that participated in the Asia-Pacific network (PCGIAP) [31];
- the movement velocity in ITRF2005 of the DGNSS/CORS station that belongs to the military coordinate network [32];
- the movement velocity in ITRF2008 of GNSS stations belong to the geodynamic network on the fault zones in the northwestern area of Vietnam, which supported for forecasting of natural hazards.
Methodology
The methodology for presenting the construction of the Earth’s crustal velocity model within a single international Earth reference frame is outlined as follows: the crustal velocity in various Earth reference frames is standardized to a single reference frame; they are examined and, these crustal velocity values are mathematically modelled using a mathematical function.
Velocity transfer between Earth’s frame of reference. The formula to transfer the coordinate in the reference system (I) to the reference system (II) at time t has a form as follows [23, 24]:
where X(II) is the coordinate vector of the site in the frame of reference, X(II)=[X, Y, Z]T(II); X(I) is the corresponding coordinate vector of that station in the old frame of reference, X(I)=[X, Y, Z]T(I); T is the translation or displacement vector among frames, T = [T1; T2; T3]T; D is a different scale; RT is the coordinate axis rotation matrix between the two frames of reference; R1, R2, and R3 – are the small rotation angles.
From the dynamic point of view, T1, T2, T3, R1, R2, R3, and D are considered as functions of time and expressed in the linear form. The common symbol of the parameters from i = 1 to 7 first-order derivative of βi under time
where βi(t0) is the value of βi at time t0.
The formula to calculate the transformation velocity between frames of reference is:
where V(t) is the coordinate movement velocity vector.
The matrix of movement velocity converts from VX, VY, VZ into VE, VN, VU [33]
where VE, VN, VU are velocities to the east, north and vertical, respectively; φ, λ – are the longitude and latitude, respectively.
The horizontal movement velocity of a point and arimut angle is calculated by the formulas:
Evaluation of the range of measurement values. A set of n observed data values V1, V2, …, Vn. The average of the observed data is calculated by the formula
the correction number of the observed i value is calculated by the following formula
the variance is calculated following formula
Standard deviation σ is the square root of the variance. The standard deviation is used to evaluate the quality of the observed data. The value is frequently chosen to evaluate the quality of the data series to be 3σ, which corresponds to the probability of occurrence of the measured series of ~99.73 %.
Model of movement velocity. Assume that there are two sets of random variables:
- the set of measurement values l1, l2, ..., lq is represented by a q-dimensional vector
- the set of signals that needs to determine to be S1, S2, …, Sm, represented by the m-dimensional vector
The best linear estimator of the vector S:
The equation (4) is called least squares interpolation or least-squares collocation interpolation. To calculate according to this equation, it is necessary to determine the covariance matrices Cll and CSl. To determine the parameters of the theoretical covariance function, firstly must calculate the experimental covariance values. Call li is the value of point i.
The experimental covariance follows the distance of k pairs of points P, Q is calculated by the equation:
The theoretical covariance function must be chosen from the law of variation of the experimental covariance values and the parameters of the theoretical covariance function must be determined using the function approximation method.
In this study, the 3rd-order Markov function is used to establish the movement velocity model in the experimental part and it’s direction [34, 35]
where C0 is the parameter of the theoretical covariance function; L is is the relation distance.
The standard deviation between the theoretical covariance function and experimental covariance is calculated in formula
where εi is the deviation between theoretical covariance function and experimental covariance of the i-th point; k is the number of experimental covariance values following distance.
The root mean square error of the covariance function at the checked points is calculated according to the formula
where di is the deviation of the measured value and interpolated value for i-th checked point; m is the number of checked points.
The data in this paper is a dataset of Earth’s crustal movement velocity vectors of 38 GNSS stations in the North area of Vietnam which is chosen from the following statistics:
- the movement velocity in ITRF2000 of 22 GNSS stations which support studying the Red River fault systems, Dien Bien Phu fault, Song Da River fault;
- the movement velocity in ITRF2005 of four GNSS stations in Vietnam which were a part of the Asia-Pacific network (PCGIAP);
- the movement velocity in ITRF2005 of 1 DGNSS/CORS station belongs to the military coordinate network;
- the movement velocity in ITRF2008 of 11 GNSS stations that are part of the Ministry of Natural Resources and Environment's project in Vietnam, which aims to establish a seismic geodetic network in the faulted areas of Northern Vietnam to support natural disaster prediction.
Results
The building of the absolute movement velocity model of the earth’s crust is implemented according to the steps follows.
Step 1 – unify the movement velocity of the Earth’s crust in the North area of Vietnam in ITRF2020. To build a model of the movement velocity of the GNSS stations in different ITRFs in Table 1, the velocities must be unified into one ITRF and are calculated in Table 2.
Table 1
Coordinates and movement velocity of GNSS stations in the North area of Vietnam
|
Station |
φ, deg |
λ, deg |
VE, mm/year |
VN, mm/year |
VU, mm/year |
ITRF |
|
CAM1 |
20.999 |
107.313 |
34.60 |
–13.41 |
32.95 |
ITRF2000 |
|
SOC1 |
21.308 |
105.826 |
32.88 |
–11.94 |
–1.84 |
ITRF2000 |
|
XUY0 |
21.849 |
105.738 |
34.95 |
–12.46 |
0.53 |
ITRF2000 |
|
TAM2 |
21.455 |
105.638 |
32.42 |
–12.24 |
–0.60 |
ITRF2000 |
|
BAV1 |
21.097 |
105.373 |
32.14 |
–11.08 |
–1.28 |
ITRF2000 |
|
OAN0 |
21.853 |
105.336 |
33.49 |
–11.85 |
–14.02 |
ITRF2000 |
|
HUN1 |
21.361 |
105.330 |
33.14 |
–11.69 |
–5.24 |
ITRF2000 |
|
DOI0 |
21.677 |
105.202 |
33.66 |
–11.83 |
–10.47 |
ITRF2000 |
|
NTH0 |
21.475 |
105.186 |
33.27 |
–12.23 |
–10.70 |
ITRF2000 |
|
SON1 |
21.191 |
105.181 |
32.80 |
–12.13 |
–3.73 |
ITRF2000 |
|
HOA1 |
20.864 |
105.178 |
33.90 |
–11.34 |
–2.75 |
ITRF2000 |
|
LAP1 |
21.384 |
105.033 |
32.92 |
–12.47 |
–4.99 |
ITRF2000 |
|
NAM0 |
21.691 |
104.458 |
35.09 |
–12.04 |
3.23 |
ITRF2000 |
|
MON1 |
21.189 |
104.245 |
32.43 |
–13.44 |
–1.05 |
ITRF2000 |
|
NOI1 |
21.131 |
104.172 |
33.03 |
–12.08 |
–4.40 |
ITRF2000 |
|
NAD2 |
20.984 |
104.167 |
32.36 |
–12.13 |
–10.19 |
ITRF2000 |
|
LOT1 |
21.203 |
104.064 |
33.45 |
–13.56 |
–6.17 |
ITRF2000 |
|
QTA2 |
21.306 |
103.943 |
33.91 |
–12.52 |
–9.63 |
ITRF2000 |
|
NGA1 |
22.268 |
103.242 |
39.12 |
–9.74 |
12.09 |
ITRF2000 |
|
HAM1 |
21.931 |
103.236 |
32.87 |
–10.47 |
15.33 |
ITRF2000 |
|
DON1 |
22.131 |
103.051 |
35.17 |
–12.10 |
15.17 |
ITRF2000 |
|
LEM1 |
21.792 |
103.029 |
34.83 |
–11.12 |
11.92 |
ITRF2000 |
|
DIEB |
21.428 |
103.005 |
26.98 |
–9.60 |
3.92 |
ITRF2005 |
|
DOSN |
20.694 |
106.795 |
27.35 |
–7.99 |
16.64 |
ITRF2005 |
|
NT01 |
20.668 |
106.814 |
36.00 |
–11.72 |
7.54 |
ITRF2005 |
|
QT01 |
21.403 |
103.029 |
29.92 |
–10.32 |
–19.98 |
ITRF2005 |
|
MCRS |
21.526 |
107.968 |
30.80 |
–7.80 |
–1.80 |
ITRF2005 |
|
C004 |
21.926 |
103.238 |
37.58 |
–12.34 |
–14.60 |
ITRF2008 |
|
C014 |
20.147 |
105.136 |
35.94 |
–11.75 |
–9.85 |
ITRF2008 |
|
C022 |
21.029 |
104.312 |
30.04 |
–10.72 |
–7.04 |
ITRF2008 |
|
C033 |
21.549 |
104.036 |
34.70 |
–10.05 |
–15.56 |
ITRF2008 |
|
C045 |
21.119 |
104.982 |
31.79 |
–9.92 |
–29.24 |
ITRF2008 |
|
C049 |
22.225 |
104.445 |
39.34 |
–12.15 |
–26.71 |
ITRF2008 |
|
C052 |
21.636 |
104.787 |
34.08 |
–13.86 |
–30.45 |
ITRF2008 |
|
C056 |
20.880 |
105.497 |
31.55 |
–11.38 |
15.31 |
ITRF2008 |
|
C065 |
21.810 |
105.438 |
36.46 |
–13.50 |
–18.32 |
ITRF2008 |
|
C070 |
21.930 |
106.794 |
31.40 |
–12.91 |
8.97 |
ITRF2008 |
|
C075 |
20.988 |
106.816 |
34.68 |
–13.68 |
7.82 |
ITRF2008 |
Table 2
Movement velocity of GNSS stations in ITRF2020
|
Station |
VE, mm/year |
VN, mm/year |
VU, mm/year |
V, mm/year |
Az, deg |
|
CAM1 |
34.70 |
–11.83 |
32.89 |
36.66 |
108.8 |
|
SOC1 |
32.98 |
–10.36 |
–1.90 |
34.57 |
107.4 |
|
XUY0 |
35.05 |
–10.89 |
0.49 |
36.70 |
107.3 |
|
TAM2 |
32.52 |
–10.67 |
–0.65 |
34.22 |
108.2 |
|
BAV1 |
32.24 |
–9.50 |
–1.34 |
33.61 |
106.4 |
|
OAN0 |
33.59 |
–10.28 |
–14.06 |
35.12 |
107.0 |
|
HUN1 |
33.24 |
–10.11 |
–5.30 |
34.74 |
106.9 |
|
DOI0 |
33.76 |
–10.26 |
–10.52 |
35.28 |
106.9 |
|
NTH0 |
33.37 |
–10.66 |
–10.75 |
35.03 |
107.7 |
|
SON1 |
32.90 |
–10.55 |
–3.79 |
34.55 |
107.8 |
|
HOA1 |
34.00 |
–9.72 |
–2.99 |
35.36 |
106.0 |
|
LAP1 |
33.02 |
–10.89 |
–5.05 |
34.77 |
108.3 |
|
NAM0 |
35.19 |
–10.47 |
3.18 |
36.71 |
106.6 |
|
MON1 |
32.53 |
–11.86 |
–1.11 |
34.62 |
110.0 |
|
NOI1 |
33.13 |
–10.50 |
–4.47 |
34.75 |
107.6 |
|
NAD2 |
32.46 |
–10.55 |
–10.26 |
34.13 |
108.0 |
|
LOT1 |
33.55 |
–11.98 |
–6.23 |
35.62 |
109.7 |
|
QTA2 |
34.01 |
–10.94 |
–9.69 |
35.72 |
107.8 |
|
NGA1 |
39.22 |
–8.17 |
12.05 |
40.06 |
101.8 |
|
HAM1 |
32.97 |
–8.90 |
15.28 |
34.15 |
105.1 |
|
DON1 |
35.27 |
–10.53 |
15.13 |
36.81 |
106.6 |
|
LEM1 |
34.93 |
–9.55 |
11.87 |
36.21 |
105.3 |
|
DIEB |
27.25 |
–9.75 |
3.85 |
28.94 |
109.7 |
|
DOSN |
27.61 |
–8.15 |
16.58 |
28.79 |
106.4 |
|
NT01 |
36.26 |
–11.87 |
7.49 |
38.15 |
108.1 |
|
QT01 |
30.18 |
–10.47 |
–20.06 |
31.95 |
109.1 |
|
MCRS |
31.00 |
–7.93 |
–1.89 |
32.00 |
104.3 |
|
C004 |
37.55 |
–12.47 |
–14.74 |
39.57 |
108.4 |
|
C014 |
35.92 |
–11.88 |
–9.98 |
37.83 |
108.3 |
|
C022 |
30.01 |
–10.84 |
–7.18 |
31.91 |
109.9 |
|
C033 |
34.68 |
–10.18 |
–15.69 |
36.14 |
106.4 |
|
C045 |
31.76 |
–10.05 |
–29.37 |
33.31 |
107.6 |
|
C049 |
39.31 |
–12.28 |
–26.85 |
41.18 |
107.3 |
|
C052 |
34.05 |
–13.99 |
–30.58 |
36.81 |
112.,3 |
|
C056 |
31.53 |
–11.51 |
15.17 |
33.56 |
110.1 |
|
C065 |
36.43 |
–13.63 |
–18.46 |
38.90 |
110.5 |
|
C070 |
31.37 |
–13.04 |
8.83 |
33.98 |
112.6 |
|
C075 |
34.65 |
–13.81 |
7.69 |
37.30 |
111.7 |
The calculated results in Table 2 show that the magnitude values and azimuth of the horizontal movement velocity vectors of the GNSS stations are quite uniform. These vectors tend to move in the northwest – southeast direction (Fig.1). This is a necessary condition to calculate the experimental covariance at different distances for applying the least-squares collocation method.
Step 2 – evaluate V and Az. The data in Table 2 shows that some stations which have different movement velocities from the general trend of stations in the experimental area need to be evaluated before using them to build a velocity model of the absolute movement of the Earth’s crust.
The average velocity and of the GNSS stations from formula (1) is:
Call vi, vaz to be the correction for the i-th velocity and azimuth. These values are calculated according to formula (2) and presented in Table 3.
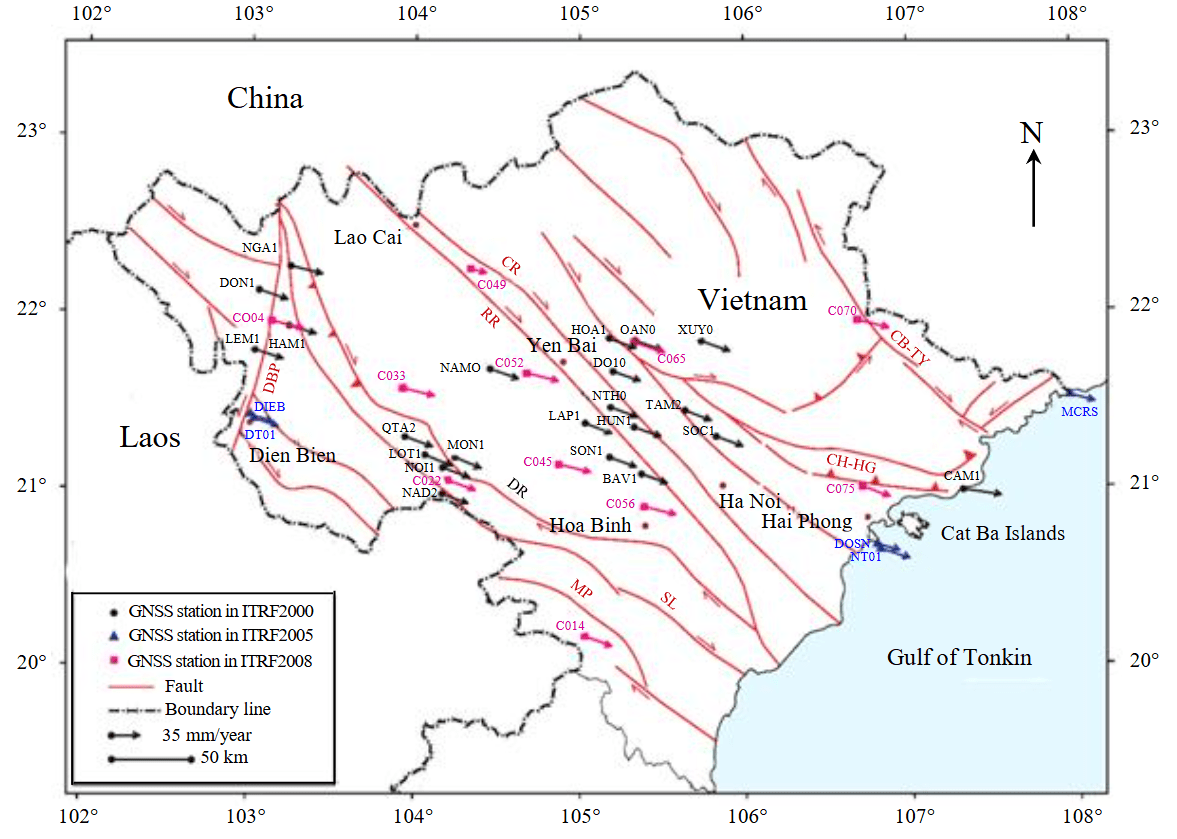
Fig.1. Map of Earth’s crustal movement velocity of GNSS stations in northern area of Vietnam in ITRF2020 (the GNSS stations is located at the positions belong to stable geological block along the fault zone)
Table 3
Deviation of velocity and azimuth at stations with their corresponding average values
|
Station |
vi, mm/year |
vaz, deg |
Station |
vi, mm/year |
vaz, deg |
|
CAM1 |
–1.40 |
–0.9 |
HAM1 |
1.11 |
2.8 |
|
SOC1 |
0.69 |
0.5 |
DON1 |
–1.55 |
1.3 |
|
XUY0 |
–1.44 |
0.6 |
LEM1 |
–0.95 |
2.6 |
|
TAM2 |
1.04 |
–0.3 |
DIEB |
6.32 |
–1.8 |
|
BAV1 |
1.65 |
1.5 |
DOSN |
6.47 |
1.5 |
|
OAN0 |
0.14 |
0.9 |
NT01 |
–2.89 |
–0.2 |
|
HUN1 |
0.52 |
1.0 |
QT01 |
3.31 |
–1.2 |
|
DOI0 |
–0.02 |
1.0 |
MCRS |
3.26 |
3.6 |
|
NTH0 |
0.23 |
0.2 |
C004 |
–4.31 |
–0.5 |
|
SON1 |
0.71 |
0.1 |
C014 |
–2.57 |
–0.4 |
|
HOA1 |
–0.10 |
1.9 |
C022 |
3.35 |
–2.0 |
|
LAP1 |
0.49 |
–0.4 |
C033 |
–0.88 |
1.5 |
|
NAM0 |
–1.45 |
1.3 |
C045 |
1.95 |
0.3 |
|
MON1 |
0.64 |
–2.1 |
C049 |
–5.92 |
0.6 |
|
NOI1 |
0.51 |
0.3 |
C052 |
–1.55 |
–4.4 |
|
NAD2 |
1.13 |
–0.1 |
C056 |
1.70 |
–2.2 |
|
LOT1 |
–0.36 |
–1.8 |
C065 |
–3.64 |
–2.6 |
|
QTA2 |
–0.46 |
0.1 |
C070 |
1.28 |
–4.7 |
|
NGA1 |
–4.80 |
6.1 |
C075 |
–2.04 |
–3.8 |
The standard deviation of the observed data series is calculated from the formula (3):
Thus, the probability of occurrence of movement velocity value of GNSS stations in the range of (35.26 – 3σ) and (35.26 + 3σ), respectively from 27.40 mm/year to 43.12 mm/year, and their movement directions at GNSS stations are in the range of (107.9 – 3σ) and (107.9 + 3σ), respectively from 101.6 deg to 114.2 deg is 99.73 %. When processing data in the next steps, the GNSS station’s movement velocity will be eliminated if it is outside the range of values mentioned above.
The analytical results show that all stations are in the range of values mentioned above, so it is used in the next steps.
Step 3 – build an absolute movement velocity model. In the study area, the 38 GNSS stations are used for experimental calculations. Among these stations, 04 stations OAN0, LOT1, C075, and QT01 are used to test the accuracy of the model but they are not used to build the model. The modeling of movement velocity of GNSS stations is implemented by the least-squares collocation method of the 3rd-order Markov function. During the data processing, the characteristic parameters of the function are determined. The model of movement velocity of the northern area of Vietnam is expressed under a 3rd-order Markov function:
The standard deviation between the theoretical covariance function and the experimental covariance of the movement velocity value and their movement direction calculated according to formula (5) is ±0.44 mm2 and ±0.9 deg2, respectively. The graphs of Fig.2 show that the value and direction of the movement velocity calculated by the theoretical covariance function match the experimental covariance function.
The value of movement velocity of the tested stations in the study area is interpolated. The comparison of these values with their respective values in Table 2 will be obtained from the deviations in Table 4.
The information in Table 4 provides details about the values of velocity deviation for the checked GNSS stations. The highest deviation is 1.94 mm per year, the lowest is 0.17 mm per year. These deviation values are quite small when compared to the average movement velocity of about 35 mm per year in the studied region.
In Table 4, the results show that the deviation of the azimuth of measured values and interpolated values at checked GNSS stations is not large.
Table 4
The determined value of movement velocity and value of azimuth of tested GNSS stations
|
Station |
Value of movement velocity, mm/year |
Value of azimuth, deg |
||||
|
V |
Vm* |
Deviation |
Az |
Azm* |
Deviation |
|
|
OAN0 |
35.12 |
35.29 |
–0.17 |
107.0 |
107.5 |
–0.5 |
|
LOT1 |
35.62 |
35.41 |
0.21 |
109.7 |
108.7 |
1.0 |
|
C075 |
37.30 |
35.36 |
1.94 |
111.7 |
109.8 |
1.9 |
|
QT01 |
31.95 |
31.20 |
0.75 |
109.1 |
108.5 |
0.6 |
* Movement velocity calculated from the model.
From Table 4, the mean square error of velocity and their movement direction at the checked stations are ±1.05 mm/year and ±1.1 deg, respectively. This comparison indicates that the movement velocity model and their direction are established for the northern area of Vietnam, using the 3rd-order Markov function as described in formulas (6) and (7).
Discussions
The northern part of Vietnam has a complex tectonic setting, dominated by active faults such as the Red River fault, Chay River fault, Lo River fault – all of them belong to the Red River fault system, Dien Bien Phu fault, Da River fault, and Son La fault. The Red River fault plays the most important role in this area, as it divides the study area into two tectonic structures: the Northwestern and Northeastern. Up to now, the Earth’s crustal movement in the northern part of Vietnam has been measured using GPS technology along active fault zones [16, 36].
The results of monitoring using GPS stations on the territory of Vietnam and adjacent areas have shown the movement of these stations in the northwest – southeast direction [16, 31]. The decrease in movement velocity from west to east of the northern GPS stations (Lang, Bach Long Vi, and Hai Nam) has indicated that the gulf of Tonkin area is currently compressed in the sub-latitude direction or East-Southeast direction. This stress field is unfavourable for the active extension fault system in the sub-meridian, as well as the strike-slip fault in the northwest – southeast.
In 2013, the movement velocity of the Red River fault was determined to be 34.5 ± 1 mm/year to the east and 12 ± 1 mm/year to the south through the analysis of GPS data. This data was obtained from 27 stations in the northern region of Vietnam between 1994 and 2007 using the GAMIT/GLOBK software [30]. At the same time, the horizontal movement velocity of 22 GPS stations in the northwest area of Vietnam, in the ITRF2008 coordinate system, from 2001 to 2012 was determined using Bernese version 5.0 software, and it was found to be 34.3 ± 0.7 mm/year [16].
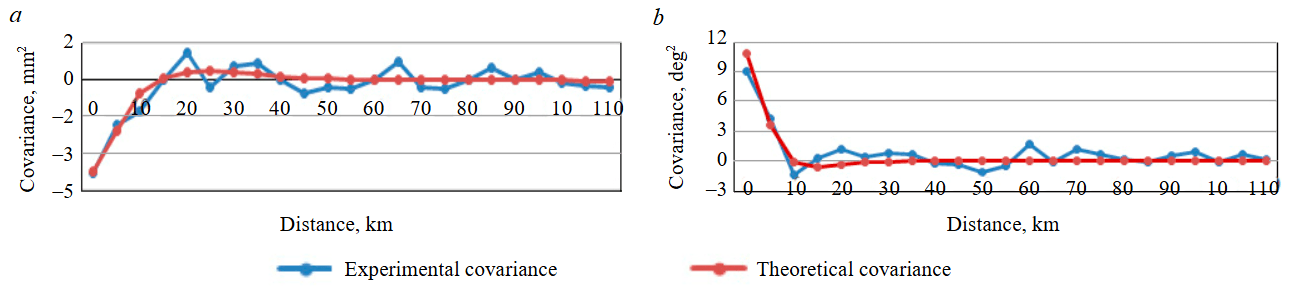
Fig.2. Graph of 3rd-order Markov function of the movement velocity (a) and movement direction (b)
In 2016, the absolute movement in the southern area of the Red River fault zone (Viet Tri – Hanoi) was calculated using data from Thac Ba stations, Tam Dao – Ba Vi, as well as measurements taken in the years 2013 and 2015. This analysis was conducted using Bernese 5.0 software, and the average value was approximately 34 mm/year [17].
In 2020, the velocity of Earth's crust movement at 06 stations (MTEV, MLAY, DBIV, TGIV, SMAV, SLAV) in the northwest area of Vietnam, as well as at 01 PHUT station (Hanoi), was calculated using GAMIT/GLOBK [36]. The determined Earth's crust movement velocities for these stations are as follows: 34.10 ± 0.71 mm/year (DBIV), 34.31 ± 0.65 mm/year (PHUT), 34.51 ± 0.75 mm/year (SMAV), 34.55 ± 0.80 mm/year (MLAY), 34.80 ± 0.72 mm/year (TGIV), 34.93 ± 0.99 mm/year (SLAV), and 35.59 ± 0.73 mm/year (MTEV). These results are consistent with the current tectonic setting in Southeast Asia, which is moving southeastward due to the collision of the Indian subcontinent into the Eurasian plate.
In 2022, the stations within the VNGEONET network have been determined for their absolute velocity of displacement on the Earth's crust using the GAMIT/GLOBK software. In general, these stations all tend to move in the southeast direction, with respective absolute displacement velocities: MCAI = 34.42 mm/year, SDON = 36.09 mm/year, HYEN = 32.87 mm/year, CPHU = 32.98 mm/year, TQUA = 33.95 mm/year, and MGTE = 34.46 mm/year [37].
The Earth's crustal movements of GNSS stations in the North area of Vietnam are corrected using the least-squares collocation method with a 3rd order Markov function, achieving an accuracy of about 2 mm/year in ITRF2020 for movement velocity and about 2 deg for movement direction. The determination of data in one dynamic coordinate system has formed a comprehensive picture of the Earth's crustal movement in the North area of Vietnam within a uniform framework. The movement velocity of the Earth's crust is ~35 mm/year in the northwest-southeast direction, which coincides with previous research results in the northern area of Vietnam, confirming the accuracy of the data correction from ITRF2000, ITRF2005, and ITRF2008 to ITRF2020.
Conclusions
The study involved the transformation of movement velocity data from 38 GNSS stations across various dynamic coordinate systems, namely ITRF2000, ITRF2005, and ITRF2008, into a single unified coordinate system known as ITRF2020. This transformation was achieved using parameters provided by the ITRF.
The analysis revealed that the movement velocity of these stations exhibited a change of ~35 mm/year, primarily in a direction from the northwest to the southeast. Among these stations, 34 were utilized to construct models for the movement of the Earth's crust, while the remaining four stations – OAN0, LOT1, C075, and QT01 – were reserved for testing and evaluating the accuracy of the models.
The research employed the least-squares collocation method to establish a model for the movement of the Earth’s crust in the northern region of Vietnam. This model exhibited a high accuracy level, with a precision of about 2 mm/year.
This study marked the first time that a highly accurate Earth’s crust movement velocity model was developed in Northern Vietnam using the latest dynamic coordinate system. The methodology employed in creating this precise crustal movement model holds potential applicability to other research domains with similar data sets. This achievement bears great importance in advancing the understanding and practical applications of modern Earth's crust movement. The outcomes of this research serve as a crucial data source that contributes to the establishment and utilization of the dynamic coordinate system within Vietnam.
References
- Altamimi Z., Rebischung P., Métivier L., Collilieux X. ITRF2014: A new release of the International Terrestrial Reference Frame modeling nonlinear station motions. Journal of Geophysical Research: Solid Earth. 2016. Vol. 121. Iss. 8, p. 6109-6131. DOI: 10.1002/2016JB013098
- Amagua C.G.P., Euriques J.F., Alves S. da C., Krueger C.P. Analysis of local surface displacement using repeated GPS measurements: a case study of the Guabirotuba area, Curitiba, Brazil. Bulletin of Geodetic Sciences. 2022. Vol. 28. Iss. 1. N e2022005. DOI: 10.1590/s1982-21702022000100005
- Araszkiewicz A. Integration of Distributed Dense Polish GNSS Data for Monitoring the Low Deformation Rates of Earth’s Crust. Remote Sensing. 2023. Vol. 15. Iss. 6. N 1504. DOI: 10.3390/rs15061504
- Bevis M., Bedford J., Caccamise II D.J. The Art and Science of Trajectory Modelling / Geodetic Time Series Analysis in Earth Sciences. Springer. 2020, p. 1-27. DOI: 10.1007/978-3-030-21718-1_1
- Bilgen B., Inal C. An open-source software for geodetic deformation analysis in GNSS networks. Earth Science Informatics. 2022. Vol. 15. Iss. 3. P. 2051-2062. DOI: 10.1007/s12145-022-00844-1
- Bui T.H.T. Transformation coordinates between international terrestrial reference frames. Journal of Mining and Earth Sciences. 2013. Vol. 41. N 1, p. 53-57 (in Vietnamese).
- Bui T.H.T. Research on the theoretic basis for the modernization of the national geodetic control network in Vietnam by global navigation satellite system GNSS: Specialty Geodesy and Mapping Ph.D. thesis, Hanoi University of Mining and Geology, Hanoi, Vietnam (2014), p. 142.
- Bui T.H.T. Determination of absolute crustal movements of Việt Nam territory from data of Differential Global Navigation Satellite System (DGNSS). Journal of Geology. Series A. 2014. Vol. 340 (1-2), p. 46-52.
- Butwong K., Thongtan T., Boonterm K. Precision coordinate transformations for Thai national geodetic infrastructure. 20th International Conference on Electrical Engineering/Electronics, Computer, Telecommunications and Information Technology (ECTI-CON), 9-12 May 2023, Nakhon Phanom, Thailand. IEEE, 2023, p. 4. DOI: 10.1109/ECTI-CON58255.2023.10153290
- Gang Chen, Anmin Zeng, Feng Ming, Yifan Jing. Multi-quadric collocation model of horizontal crustal movement. Solid Earth. 2015. Vol. 7. Iss. 3, p. 817-825. DOI: 10.5194/se-7-817-2016
- Pengfei Cheng, Yingyan Cheng, Xiaoming Wang, Yantian Xu. Update China geodetic coordinate frame considering plate motion. Satellite Navigation. 2021. Vol. 2. N 2. DOI: 10.1186/s43020-020-00032-w
- Gill J., Shariff N.S., Omar K., Amin Z.M. Tectonic motion of Malaysia: analysis from years 2001 to 2013. ISPRS Annals of the Photogrammetry, Remote Sensing and Spatial Information Sciences: Joint International Geoinformation Conference, 28-30 October 2015, Kuala Lumpur, Malaysia. Copernicus Publications, 2015. Vol. II-2/W2, p. 199-206. DOI: 10.5194/isprsannals-II-2-W2-199-2015
- Guohua Gu, Wuxing Wang. Advantages of GNSS in Monitoring Crustal Deformation for Detection of Precursors to Strong Earthquakes. Positioning. 2013. Vol. 4. N 1, p. 11-19. DOI: 10.4236/pos.2013.41003
- Häkli P., Evers K., Jivall L. et al. NKG2020 transformation: An updated transformation between dynamic and static reference frames in the Nordic and Baltic countries. Journal of Geodetic Science. 2023. Vol. 13. Iss. 1. N 20220155. DOI: 10.1515/jogs-2022-0155
- Hodgkinson K.M., Mencin D.J., Feaux K. et al. Evaluation of Earthquake Magnitude Estimation and Event Detection Thresholds for Real‐Time GNSS Networks: Examples from Recent Events Captured by the Network of the Americas. Seismological Research Letters. 2020. Vol. 91. N 3, p. 1628-1645. DOI: 10.1785/0220190269
- Jagoda M., Rutkowska M. An Analysis of the Eurasian Tectonic Plate Motion Parameters Based on GNSS Stations Positions in ITRF2014. Sensors. 2020. Vol. 20. Iss. 21. N 6065. DOI: 10.3390/s20216065
- Maciuk K., Szombara S. Annual crustal deformation based on GNSS observations between 1996 and 2016. Arabian Journal of Geosciences. 2018. Vol. 11. Iss. 21. N 667. DOI: 10.1007/s12517-018-4022-4
- Kuncoro H., Meilano I., Susilo S. Sunda and Sumatra Block Motion in ITRF2008 / International Symposium on Global Navigation Satellite System 2018, 21-23 November 2018, Bali, Indonesia. E3S Web of Conferences. 2019. Vol. 94. N 04006. DOI: 10.1051/e3sconf/20199404006
- Minh L.H., Masson R.., Bourdillon A. et al. Recent crustal motion in Vietnam and in the Southeast Asia region by continuous GPS data. Vietnam Journal of Earth Sciences. 2014. Vol. 36. N 1, p. 1-13 (in Vietnamese). DOI: 10.15625/0866-7187/36/1/4132
- Minh L.H., Hung V.T., Hu J.-C. et al. Contemporary movement of the Earth’s crust in the Northwestern Vietnam by continuous GPS data. Vietnam Journal of Earth Sciences. 2020. Vol. 42. N 4, p. 334-350. DOI: 10.15625/0866-7187/42/4/15282
- Azhari M., Altamimi Z., Azman G. et al. Semi-kinematic geodetic reference frame based on the ITRF2014 for Malaysia. Journal of Geodetic Science. 2020. Vol. 10. Iss. 1, p. 91-109. DOI: 10.1515/jogs-2020-0108
- Mattioli G., Mencin D., Hodgkinson K. et al. The EarthScope Plate Boundary Observatory and allied networks, the makings of nascent Earthquake and Tsunami Early Warning System in Western North America. European Geosciences Union General Assembly, 23-28 April 2017, Vienna, Austria. Geophysical Research Abstracts. 2016. Vol. 18. N EGU2016-10953.
- Duong N., Sagiya T., Kimata F. et al. Contemporary horizontal crustal movement estimation for northwestern Vietnam inferred from repeated GPS measurements. Earth, Planets and Space. 2013. Vol. 65. Iss. 12, p. 1399-1410. DOI: 10.5047/eps.2013.09.010
- Trọng N.G., Nghĩa N.V., Khải P.C. et al. Determination of tectonic velocities in Vietnam territory based on data of CORS stations of VNGEONET network. Journal of Hydro-Meteorology. 2022. Vol. 739, p. 59-66 (in Vietnamese). DOI: 10.36335/VNJHM.2022(739).59-66
- Ohta Y., Ohzono M. Potential for crustal deformation monitoring using a dense cell phone carrier Global Navigation Satellite System network. Earth, Planets and Space. 2022. Vol. 74. Iss. 1. N 25. DOI: 10.1186/s40623-022-01585-7
- Wei Qu, Hailu Chen, Shichuan Liang et al. Adaptive Least-Squares Collocation Algorithm Considering Distance Scale Factor for GPS Crustal Velocity Field Fitting and Estimation. Remote Sensing. 2019. Vol. 11. Iss. 22. N 2692. DOI: 10.3390/rs11222692
- Rabah M., Shaker A., Farhan M. Towards a Semi-Kinematic Datum for Egypt. Positioning. 2015. Vol. 6. N 3, p. 49-60. DOI: 10.4236/pos.2015.63006
- Rudenko S., Esselborn S., Schöne T., Dettmering D. Impact of terrestrial reference frame realizations on altimetry satellite orbit quality and global and regional sea level trends: a switch from ITRF2008 to ITRF2014. Solid Earth. 2019. Vol. 10. Iss. 1, p. 293-305. DOI: 10.5194/se-10-293-2019
- Steffen R., Legrand J., Ågren J. et al. HV-LSC-ex2: velocity field interpolation using extended least-squares collocation. Journal of Geodesy. 2022. Vol. 96. Iss. 3. N 15. DOI: 10.1007/s00190-022-01601-4
- Tamay J., Galindo-Zaldivar J., Soto J., Gil A.J. GNSS Constraints to Active Tectonic Deformations of the South American Continental Margin in Ecuador. Sensors. 2021. Vol. 21. Iss. 12. N 4003. DOI: 10.3390/s21124003
- Tran D.T., Nguyen Q.L., Nguyen D.H. General Geometric Model of GNSS Position Time Series for Crustal Deformation Studies – A Case Study of CORS Stations in Vietnam. Journal of the Polish Mineral Engineering Society. 2021. Vol. 1. N 2, p. 183-198. DOI: 10.29227/IM-2021-02-16
- Trần Đ.T., Nguyễn T.Y., Dương C.C. et al. Recent crustal movements of northern Vietnam from GPS data. Journal of Geodynamics. 2013. Vol. 69, p. 5-10. DOI: 10.1016/j.jog.2012.02.009
- Tucikešić S., Milinković A., Božić B. et al. GNSS Time Series as a Tool for Seismic Activity Analysis Related to Infrastructure Utilities. Contributions to International Conferences on Engineering Surveying. Cham: Springer, 2021, p. 246-256. DOI: 10.1007/978-3-030-51953-7_21
- Hai V.Q., Cuong T.Q., Thuan N.V. Crustal movement along the Red River Fault zone from GNSS data. Vietnam Journal of Earth Sciences. 2016. Vol. 38. N 1, p. 14-21 (in Vietnamese). DOI: 10.15625/0866-7187/38/1/7846
- Wang Wei, Dang Ya-Min, Zhang Chuan-Yin et al. Monitoring crustal deformation and gravity change caused by the terrestrial water load in the three gorges area base on CORS network. Chinese Journal of Geophysics. 2017. Vol. 60. Iss. 2, p. 154-163. DOI: 10.1002/cjg2.30035
- Jarmołowski W. A priori noise and regularization in least squares collocation of gravity anomalies. Geodesy and Cartography. 2013. Vol. 62. N 2, p. 199-216. DOI: 10.2478/geocart-2013-0013
- Jarmołowski W., Bakuła M. Two covariance models in Least Squares Collocation (LSC) tested in interpolation of local topography. Contributions to Geophysics and Geodesy. 2013. Vol. 43. N 1, p. 1-19. DOI: 10.2478/congeo-2013-0001