Isotherm and kinetic adsorption of rice husk particles as a model adsorbent for solving issues in the sustainable gold mining environment from mercury leaching
- 1 — Ph.D., Dr.Sci. Professor Universitas Pendidikan Indonesia ▪ Orcid
- 2 — Ph.D., Dr.Sci. Researcher Pusat Riset Lingkungan dan Teknologi Bersih, Badan Riset dan Inovasi Nasional ▪ Orcid
- 3 — Researcher Universitas Pendidikan Indonesia ▪ Orcid
- 4 — Researcher Universitas Pendidikan Indonesia ▪ Orcid
- 5 — Researcher Universitas Pendidikan Indonesia ▪ Orcid
- 6 — Researcher Pusat Riset Lingkungan dan Teknologi Bersih, Badan Riset dan Inovasi Nasional ▪ Orcid
- 7 — Researcher Pusat Riset Lingkungan dan Teknologi Bersih, Badan Riset dan Inovasi Nasional ▪ Orcid
Abstract
One of the techniques used in extracting gold in small-scale gold mining is mercury amalgamation. However, the use of mercury presents significant health and environmental hazards, as well as suboptimal efficiency in gold extraction. This study explores the possibility of the use of rice husk as a prototype adsorbent for mercury removal from its leaching in mining environments. To support the analysis, the rice husk adsorbent was characterized by Fourier-transform infrared spectroscopy, scanning electron microscopy, electron dispersive X-ray spectroscopy, atomic absorption spectrophotometers and Brunauer − Emmett − Teller analysis. To investigate the removal of Hg from aqueous solutions, batch adsorption experiments were conducted, and the efficiency was optimized under various parameters such as contact time, rice husk dosage, and initial concentration of mercury. Kinetic and isotherm investigations were also carried out to gain a better understanding of the adsorption properties. The kinetic adsorption was analyzed using the pseudo-first-order and pseudo-second-order. Furthermore, the isotherm adsorption was analyzed using ten adsorption isotherm models (i.e., Langmuir, Freundlich, Temkin, Dubinin – Radushkevich, Flory – Huggins, Fowler – Guggenheim, Hill – de Boer, Jovanovic, Harkin – Jura, and Halsey). The amount of mercury absorption increased with increasing contact time, adsorbent mass, and initial concentration of mercury. The pseudo-second-order kinetic model is the best model that can be applied to describe the adsorption process. Analysis of the adsorption results obtained shows that the adsorption pattern is explained through the formation of a monolayer without any lateral interaction between the adsorbate and adsorbent. In addition, the formation of multilayers due to inhomogeneous pore distribution also occurs which causes a pore filling mechanism. We found that the isotherm phenomena are near the Jovanovic models with the maximum adsorption capacity) of rice husk found to be 107.299 mg/g. As a result, rice husk could be a promising option for wastewater treatment due to its fast and efficient removal capacity, as well as its affordability and eco-friendliness. The predicted thermodynamic studies using the Flory – Huggins isotherm model show that the adsorption process is endothermic, spontaneous, and physisorption. The impact shows that the utilization of rice husk can be used and fit for the current issues in the sustainable development goals (SDGs).
None
Introduction
Community mining has been conducted throughout Indonesia for hundreds of years and is currently experiencing a surge in activity. Indonesia is one of the world's top ten gold producers (www.ceicdata.com; www.gold.org/goldhub). It is home to many artisanal and small-scale gold mining (ASGM) firms and operational facilities. ASGM is defined by the Ministry of Environment and Forestry (KLHK) as gold mining undertaken by individual miners or small firms with little capital and production. In Indonesia, there are two sorts of ASGM: those that are licensed and those that are not. The majority of ASGM activities in Indonesia continue to operate illegally since they lack government authorization. Illegal ASGM is detrimental to the state since they are unregistered, do not pay royalties, cannot be regulated, and contribute to environmental damage and adverse health effects caused by mercury usage.
The majority of ASGMs in Indonesia extract gold using a traditional method involving amalgamation with mercury [1]. The mercury and gold precipitate form a mercury-gold amalgam, which is then heated at high temperatures. Finally, the gold is extracted via evaporation by only distilling 10-40 % of the contained gold [2]. Miners are often only able to extract a limited amount of gold with high amounts of mercury (more than 1000 ton of mercury are released into the environment every year) using conventional processing techniques [1], causing environmental and health issues not just for the active miners involved in the processing, but also for the non-mining neighboring communities. Hg emissions from the ASGM industry account for 37 % of all anthropogenic Hg released into the environment, making ASGM the second most prominent source of Hg pollution in Indonesia after coal burning [3, 4]. The pollution of groundwater with mercury poses a severe hazard to humans, animals, and the ecosystem on a global scale. According to the Environmental Protection Agency and the World Health Organization, the maximum permitted limits for total mercury and CH3Hg are 5.0 and 1.6 g/kg per week, respectively. Inaddition, Government Regulation of Indonesia N82 of 2001 states that the amount of mercury found in water is 0.001 ppm. This is backed by the Indonesian Ministry of Health no 907/Menkes/SK/VII/2002, specifying that the highest concentration of permissible mercury is 0.001mg/l. Therefore, removing mercury from water that has been contaminated is of utmost significance, and this issue requires further focus and consideration. The United Nations for Minamata Convention on Mercury, signed by 128 nations in 2013, was one of the most significant acts against Hg use. Its primary mission is to restrict and reduce the use of mercury, and finally eliminate it by 2030.
Several chemical and physical processes have been applied for Hg removals from wastewater, such as ion exchange [5], coagulation/coprecipitation [6], adsorption, reverse osmosis, membrane separation, liquid-liquid extraction, precipitation, electrodeposition [7, 8]. However, from an engineering standpoint, the technique's cost and efficiency should be compromised. Nonetheless, adsorption-based technologies can remove heavy metal ions due to their simplicity, reusability of the adsorbent, environmental friendliness, ease of operation, and cost-effectiveness [9, 10].
Rice husk is the protective outer covering of rice grains. It is an abundant agricultural waste of rice milling and has various uses and applications. A summary regarding the recent potential application of rice husk and its modification is summarized in Table 1.
Some researchers have already investigated the potential of rice husk sorbents to remove heavy metals from water [11-14]. However, the studies developed using a complex and expensive method due to modifying the rice husk. Hence, this study used raw rice husk as a sorbent material to determine rice husks' adsorption properties so that ASGM small-scale miners can use this method directly in processing mercury waste from gold mining.
This work studied the ability of raw rice husk to remove Hg2+ under various competing situations such as initial concentration, contact time, and dosage. In addition, to comprehend the interactions between multiple sorbates and the effect of complexing ligands on the dynamics of Hg, the efficacy of raw rice husk in removing Hg2+ from wastewater was investigated using adsorption kinetics and isotherm models. Then, experimental and theoretical research was conducted to elucidate the mercury adsorption mechanism on rice husk and the removal capability of this adsorbent.
Table 1
Recent potential applications and modifications of rice husk
|
Material |
Application |
Modification |
Results |
Source |
|
Rice husk, KOH, HCl, HNO3 |
Heavy metals removal from the aqueous phase |
Pyrolysis;activated with KOH |
Adsorbent |
[11] |
|
Rice husk, bamboo sawdust |
Heavy metals removal from the aqueous phase |
Carbonized at 400°C for 2h; mixed with bamboo sawdust ash (BSD-RHA) |
Adsorbent |
[12] |
|
Rice husk, Na2CO3, NaOH, CH2Cl2, CH3NH2, CH3COOH, K2Cr2O7 |
Heavy metals removal from the aqueous phase |
Na2CO3 modified |
Adsorbent |
[13] |
|
Coal, rice husk, Pb (NO3)2, NaNO3, HNO3, NaOH |
Heavy metals removal from the aqueous phase |
Biofermentation |
Adsorbent |
[14] |
|
Rice husk, sodium hydroxide solid, tartaric acid, distilled water |
Medium of Growth Single Crystal CaC4H4O64H2O |
Pyrolysis;filtrate of sodium silicate was reacted with tartrate acid (C4H6O6) |
Metasilicate gel |
[15] |
|
Rice husk ash, soil, bentonite clay |
The ceramic membrane in microbial fuel cells |
Rice husk ash is mixed with soil |
Ceramic membrane |
[16] |
|
HNO3, H2SO4, and H2O2 |
Hydrogen production |
Ultrasound-assisted inorganic treatment |
Catalyst |
[17] |
|
Rice husk, polyester resin, methyl ethyl ketone peroxide catalyst, palm fronds |
Filler and resin |
Dried in the sun for 3 days;rice husk mixed with palm fronds ratio with: 90/10; 70/30; 50/50; 30/70 |
Composite Based brake pad |
[18] |
|
Rice husk, potassium-di-hydrogen phosphate, and potassium nitrate |
Soil amendment |
Microwave-assisted;pyrolysis |
Adsorbent |
[19] |
|
NaOH, HCl, sodium aluminate, ethanol, LiCl·H2O, LaCl3·7H2O and CeCl3·7H2O |
Carbon capture |
Hydrothermal method;impregnated zeolite |
Porous material adsorbent nax rare earth La or Ce |
[20] |
|
Rice husk, wheat flour, soybean oil, water, and dry yeast |
Thermal insulation |
Carbonization;fermentation |
Carbon foams |
[21] |
|
Rice husk, NaOH – 98, HCl – 37, KBr – 98, Mg – 98, EtOH – 98, hydrofluoric acid – 40, lithium hexafluorophosphate (LiPF6 – 99), ethylene carbonate – 99, diethyl carbonate – 99, ethyl methyl carbonate – 98wt.%; acetylene black, polyacrylic acid, and n-methyl-2-pyrrolidone |
Scavenger agent |
Calcination-KBr |
Silicon nanoparticles |
[22] |
|
Rice husk and KOH |
Carbon-based energy storageфnd conversion devices |
Calcination and chemical activation-KOH |
Graphene |
[23] |
|
Rice husk ash and cetyltrimethylammonium bromide |
Photocatalyst in the degradation of methylene blue |
Sol-gel |
Silica-Tin nanotubes |
[24] |
|
Rice husk ash, HCl, Ethyl methanesulfonate (EMS) |
Cement replacement |
Acid modification;mixed with EMS |
Cement mortar |
[25] |
|
Rice husk ash, NaOH, HCl, ethanol, carbon dioxide, odorless kerosene, Span 80, Tween 80, sodium dodecyl sulfate, and water |
Drug delivery |
Sol-gel |
Silica aerogel microparticles |
[26] |
|
Rice husk |
Biofertilizer production |
Batch anaerobic digestion |
Biogas and digestates |
[27] |
|
Rice husk, amoxicillin trihydrate, Cerium(III) nitrate, hexahydrate, Humic acid, sodium dodecyl sulfate, and Diclofenac sodium |
Antibiotic removal |
Hydrothermal method |
Ceo2@sio adsorbent |
[28] |
|
Rice husk, KOH, and NaOH |
Supercapacitor electrode |
Chemical activation with dual activation agents |
Activated carbons |
[29] |
|
Rice husk, HCl, HNO3, H2SO4, and H3PO4 |
Production of silica |
Acid leaching method |
Mesoporous silica and the magnetic mesoporous silica |
[30] |
Methods
The materials in this study consisted of raw rice husk (obtained from Farm Shop, Bandung, Indonesia), standard stock solution of mercury to prepare the mercury solution (1000±2 mg/l, Merck (Germany)), nitric acid (EMSURE), and ultrapure water (18.2 MОm/cm, Milli-Q system). In this study, all chemicals used were analytical reagent class.
Raw rice husk was prepared by saw-milled, and sieved to get the desired particle sizes (Yayasan Bumi Publikasi Nusantara, Indonesia) with a hole size of 74, 125, 250, 500, 1000, and 2000μm, and then preserved at room temperature. The rice husk is placed into a conventional batch-type blade-milling apparatus. Typically, this milling apparatus includes a milling tube made of SAN material with a diameter of 16.6 and a length of 13.5cm, along with stainless steel blades measuring 6cm. The milling procedure was conducted at room temperature for 10 min.
Nicolet 6700 Fourier-transform infrared (FTIR) spectrometer, manufactured by Thermo Fisher Scientific Co., USA, was used to determine the functional groups on rice husk at wavelength range 400-4000cm–1. Additionally, a field emission scanning electron microscope spectroscopy JSM-6360 was utilized to characterize the surface morphology of the adsorbent. Then, the specific surface area and average pore size of the adsorbent were measured using the Brunauer − Emmett − Teller (BET) method at a temperature of 77K using Quantachrome NOVA 2200E, China. Finally, to utilize the chemical elements in the solution used the atomic absorption Spectrophotometers Agilent 200 Series AA manufactured by Agilent Technologies.
Adsorption Procedure
To conduct the batch adsorption experiments, Hg(II) solutions were prepared by using an analytical grade reagent (Hg(NO3)2) and using ultrapure water as the solvent. The pH of the prepared solutions was adjusted using 0.05M solutions of HNO3 to ensure the presence of metal ions based on the pH-induced chemical speciation.
Various experimental tests were conducted to assess the effectiveness of rice husk in removing Hg from 100 ml aqueous solutions. To determine the most favorable adsorption condition, several factors were investigated, such as contact time (ranging from 30 to 180min), adsorbent dose (0.02 to 0.2g), and initial concentration (5 to 20 mg/l). Subsequently, the optimal values, which yielded the highest percentage of removal, were obtained. Then, using the obtained optimum values, kinetics, and isothermal tests were conducted using different contact times.
The mixture solution was shaken at 200 rpm using a magnetic stirrer-SP88850105 manufactured by Thermo Fisher Scientific. After adsorption, the solution was filtered using a 0.45 µm nylon membrane filter to remove adsorbent that might interfere with mercury determination. The residual concentration of Hg(II) was determined at the end of each experiment using Agilent 200 Series AAatomic absorption spectrophotometers (AAS). Then, the adsorption capacity and Hgremoval were calculated:
where C0 and Ce are the initial and residual concentrations of metal ions, mg/l; Ct denotes the analyte concentration at time t, mg/l; V is the volume of solution used, l; m is the adsorbent mass, g.
Kinetic Procedure
The kinetic parameters are necessary to anticipate the rate at which Hg(II) is removed from aqueous solutions, to comprehend the adsorption mechanism, and to define the step that determines the adsorption [31]. In this work, the data obtained from the effect of contact time on the quantity of Hg(II) adsorbed at the surface of rice husk were used in Lagergren pseudo-first-order [32]
and pseudo-second-order [31, 32] have been used
where Qe is the adsorption capacity at equilibrium, mg Hg/g rice husk; Qt is the adsorption capacity at time t; mg Hg/g rice husk; k1 is the rate constant of the Lagergren first-order kinetic model, min−1; tis the time of the experiment, min; k2 is the rate constant of the pseudo-second-order kinetic model, min−1.
Adsorption kinetics are typically thought to be heavily dependent on the physicochemical qualities of the used substance (adsorbent) [18].
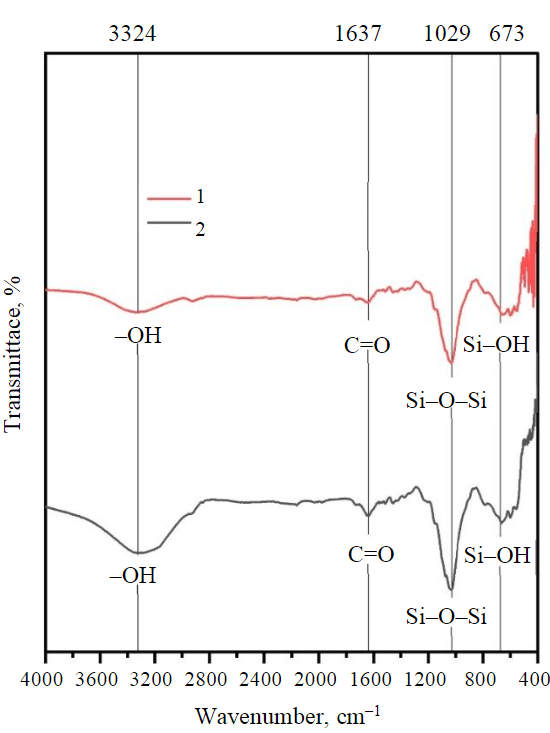
Fig.1. FTIR spectroscopy of rice husk before and after adsorption
1 – after adsorption; 2 – before adsorption
Results and discussion
FTIR analysis of the raw rice husk is conducted after and before adsorption (Fig.1). The band is located at 3282 cm–1 be attributed to (–OH) related to the stretching of cellulose and lignin of rice husk before the adsorption process [33-35]. Other peaks in the spectrum of rice husk before Hg2+ adsorption, which is the band at around 2918cm–1, assigned to C–H in CH and C–H2, the bands at 2160-1978.65cm–1 due to C≡C group, and the band around 1650.69-1514.86cm–1 attributed to the C=O (ester and carboxylic group from hemicellulose) and C=C aromatic ring from lignin, while 1455.11-1330.89cm–1 contributed to –COOH [36]. The sharp vibration peak around 1073.75 and 1032.02cm–1 can be correlated to organic silicone (Si–O–Si), while the peak of transmittance appears in the wave number area 788.75-557.36cm–1 is a typical characteristic of amorphous silica (Si–OH) spectrum [35].
Upon analysis of the FTIR spectra after the adsorption of mercury (Fig.1), a discernible peak at 432.08cm–1 was observed. This peak can be attributed to the vibration of oxygen that is perpendicular to the Si–O–Si planes [35]. In addition, rice husk spectra after the removal of Hg2+ have revealed a noticeable decrease in the wavelength peaks at 2160.82, 2034.84, 1978.65, and 1073.75cm–1 due to the oxygenated functional groups. The outcomes obtained from the adsorbent materials produced from agroindustry waste bear resemblance to those published in the literature [31-37]. Earlier research has indicated that mercury compounds display characteristic FTIR signals at 3500, 1750, and 600cm–1 [38]. In the case of the rice husk material, the band is noticed at 3500cm–1, which corresponds to the –OH and Hg interaction. These results are in line with Guo et al. [36] that phenolic hydroxyl groups on the adsorbent surface undergo complexation reactions with Hg2+.
In addition, the SEM image of the rice husk adsorbent is shown in Fig.2. The SEM analysis of the surface of the adsorbent revealed an irregular layer of silica and natural resins in the rice husk structure. The SEM image of rice husk before adsorption (Fig.2,a,b) reveals the presence of surface pores, which serve as the ideal location for capturing Hg2+ molecules from aqueous solutions [39]. Following the adsorption process, the SEM image of rice husk displays the successful capture of Hg2+ molecules within its surface pores (Fig.2,c,d). This was accomplished through a process of diffusion and migration with Hg2+ molecules moving from the aqueous solution to the rice husk surface and eventually filling the available pores [40]. The physical adsorption of Hg2+ at the surface of rice husk was likely due to mechanical adhesion through electrostatic force, which is consistent with previous research [39-41].
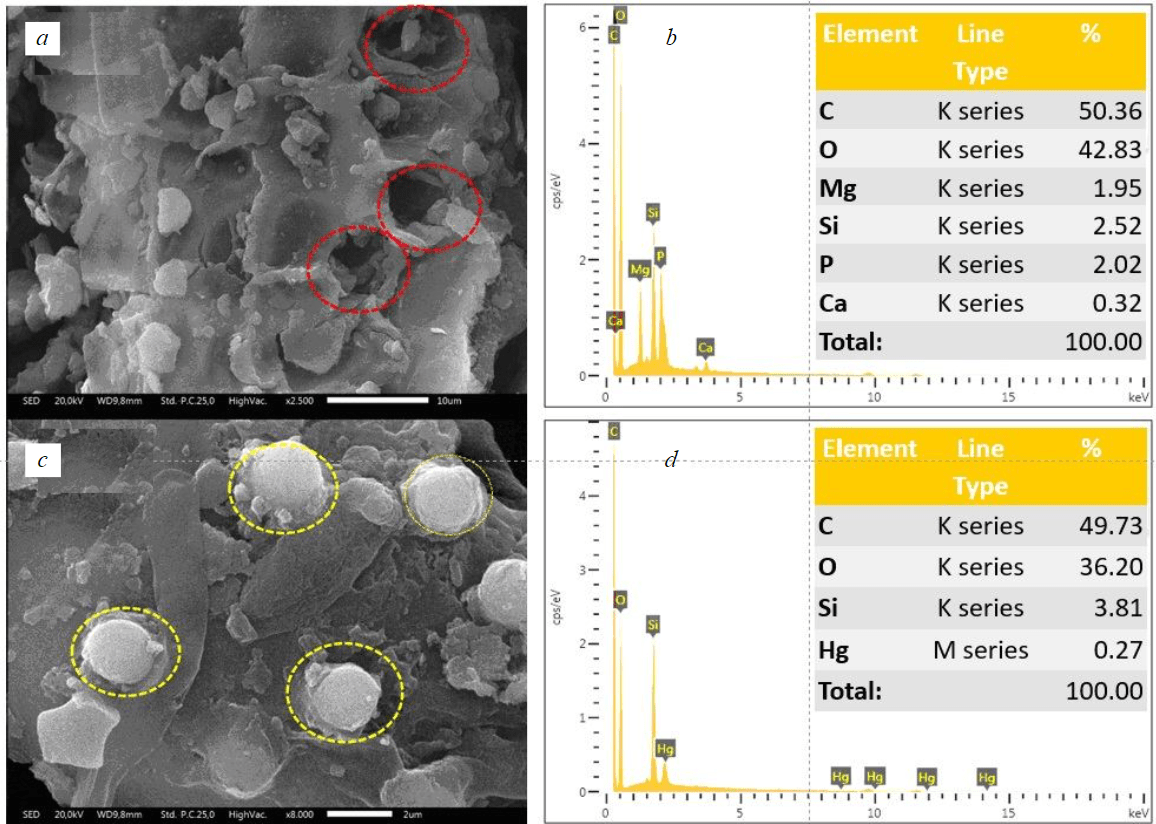
Fig.2. SEM micrograph of rice hush before adsorption (a) and Hg-loaded-rice hush after adsorption (c); EDX spectrum of rice hush before adsorption (b) and Hg-loaded-rice hush after adsorption (d)
Figures 2,b,d display the EDX spectra of the rice husk. Figure 2,c shows that the predominant elements in the prepared rice husk are carbon and oxygen, indicating the presence of oxygen functional groups on the carbon surface. Additionally, there are small quantities of silica, calcium, magnesium, and phosphorus from the source. Nevertheless, following the occurrence of the adsorption procedure (Fig.2,d), there was a decrease in the cations present in rice husk.
Also, the appearance of Hg peaks in the EDX was found, confirming that Hg fills the pore structure. This outcome suggests that an ion exchange mechanism might have taken place [36].
Nitrogen adsorption isotherms utilizing Quantachrome NOVA 2200E and the BET formalism were employed to determine the isotherm shape, specific surface area, and pore volume of the adsorbent. The outcome of the nitrogen adsorption isotherm test displayed a Type IV pattern as classified by IUPAC and H3 hysteresis (Fig.3,a). This suggests a mesoporous substance with a continuous facile pore connection. Additionally, it has a limited multilayer structure that matches the complete filling of the capillaries [42-45]. The BET-specific surface area of the adsorbent was 173.782m2/g, and the BJH pore distribution method showed a pore size diameter of about 1.714nm and a pore volume of about 0.307cm3/g (Fig.3,b). These results outperformed previous studies [37, 46]. Our findings demonstrate the outstanding quality of the adsorbent.
Adsorption study
Several factors were identified:
- Effect of contact time. To design effective batch adsorption experiments, it is crucial to assess the impact of contact time required to reach equilibrium. Therefore, the effect of contact time on the adsorption of Hg was studied at various adsorbent dosages within 30-180min. The results indicated that, at room temperature, the mercury concentrations in water decreased within the first 30min (Fig.4,a). The fast initial rates of adsorption are due to the presence of a significant number of binding sites for adsorption at the beginning, followed by saturation and equilibrium [47]. In addition, the presence of major functional groups such as oxygenated aromatic rings in the rice husk structure confirmed by FTIR spectra images (see Fig.1) allows for Hg-π conjugation and stacking interactions with Hg ions [48]. As shown by SEM images (see Fig.2), the presence of cellulose and lignin can also play a role in the removal of heavy metal mercury [37]. The optimal contact time for Hg removal was found to be around two hours for all rice husk dosages, as the percentage removal did not significantly increase beyond this duration. This information is depicted in Fig.4,a.
- Effect of adsorbent dosage. Typically, adsorbents have a limited number of active sites which means that their dosage must be optimized. To treat a 100 ml aqueous solution with an initial concentration of 200µg/l of mercury within 120min under ambient conditions, various rice husk dosages were evaluated. Figure4,b shows that the percentage of Hg removal increased with increasing adsorbent dosage, reaching 78.8% at a dosage of 0.2g. This is because the abundance of active sites on the surface of the adsorbent increases with dosage, allowing it to bind more mercury [32, 37, 47, 48]. However, increasing the adsorbent dosage also decreased the amount of metal ions adsorbed due to the reduced concentration of adsorbate in the solution. Thus, the driving force for the adsorption process was also reduced. As a result, not all available adsorption sites can be occupied (unsaturated), leading to a decrease in adsorption capacity [49, 50].
- Effect of Hg initial concentrations. In Fig.4,c,d, the impact of the initial concentrations of the adsorbate (Hg) on the efficiency of the adsorption process using 0.05g of rice husk is presented. The study investigated the impact of different levels of Hg concentration on adsorption properties using a mercury solution as a model for wastewater. The initial concentrations of the mercury solution were set at 5, 10, and 20mg/l. This concentration is taken based on the actual concentration of mercury in the contaminated wastewater (river) in Indonesia. Based on the data presented in Fig.4,c,d, it is evident that as the initial concentration of mercury increases, both the adsorption capacity and removal of mercury also increase. When the mercury concentration is higher (20 mg/l), the maximum removal efficiency is approximately 93.1%, with an adsorption capacity of around 37.3mg/g.
In comparison, for lower mercury concentrations of 10 and 5mg/l, the removal efficiencies are approximately 78 and 52% respectively, with adsorption capacities of approximately 28.6 and 5.2mg/g after 120min of contact time. This is because a high initial concentration provides the necessary driving force to overcome adsorbate mass transfer processes between the aqueous and solid phases [47, 51, 52].
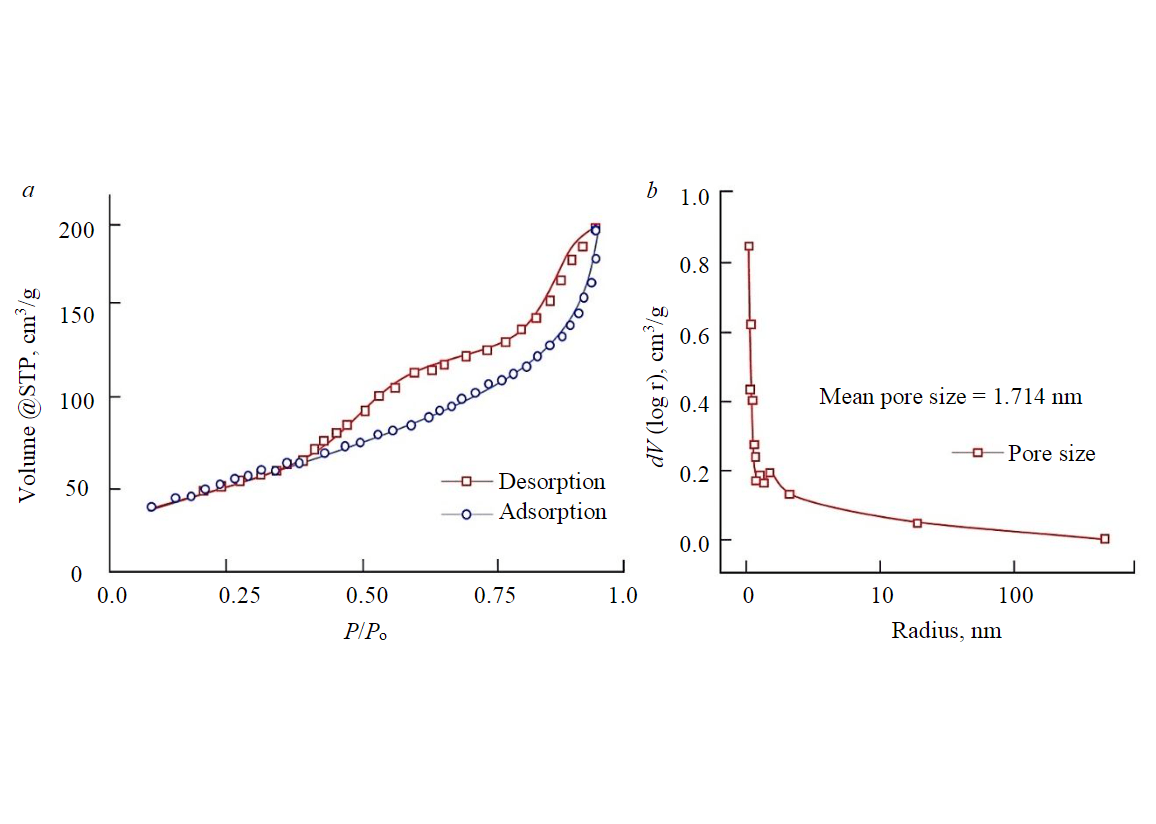
Fig.3. The characteristic Type IV (IUPAC classification) N2 adsorption isotherm of rice husk adsorbent (a); pore distribution of rice husk adsorbent (b)
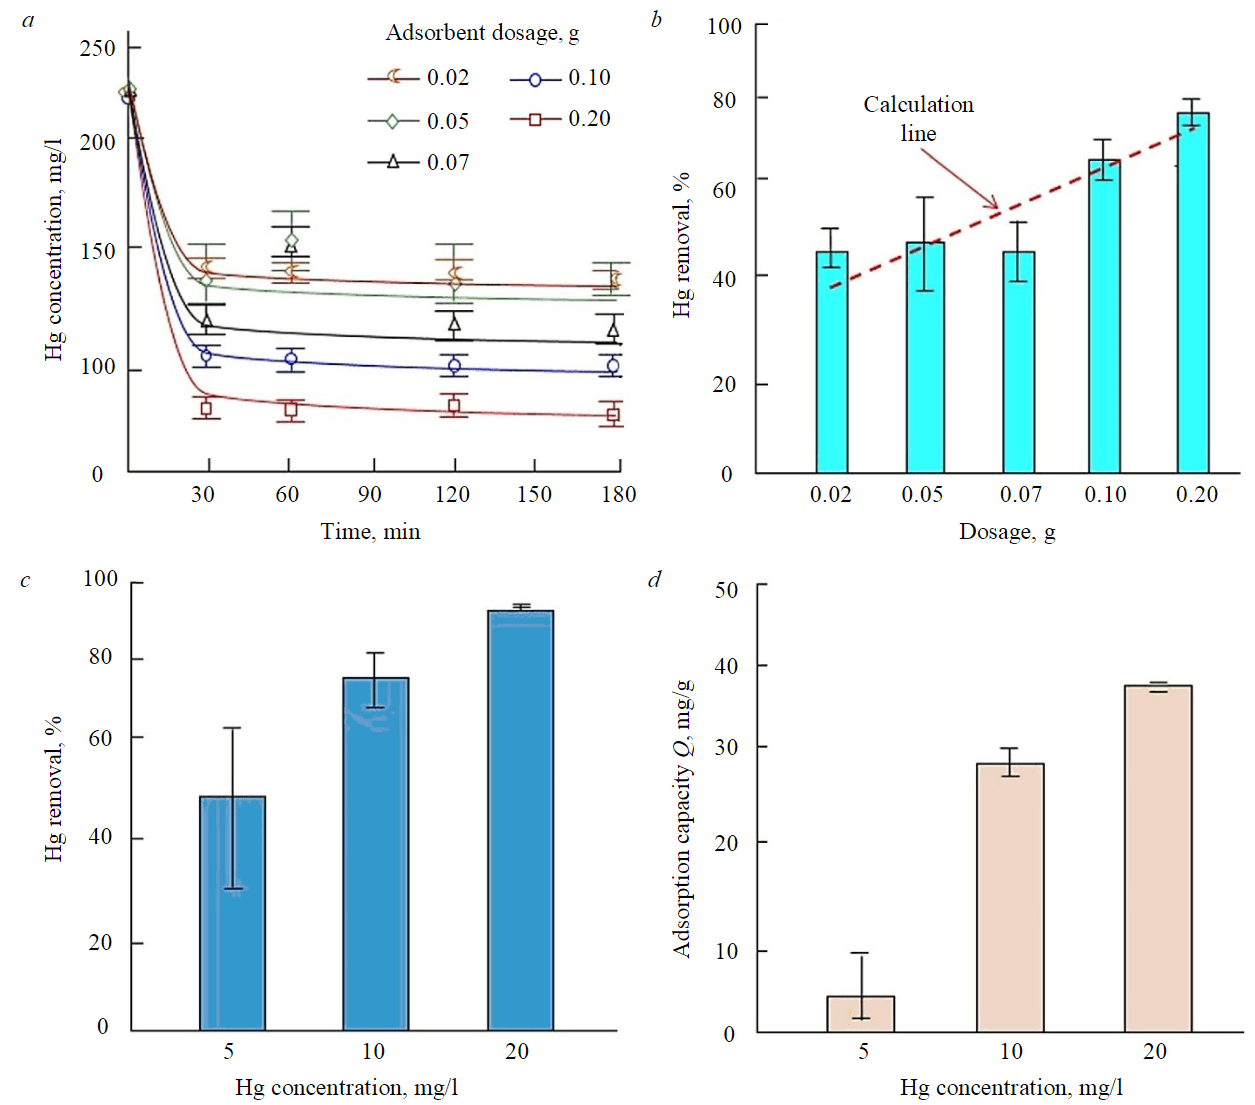
Fig.4. The concentrations of Hg in water as a function of time (a); the adsorption performance of rice husk at various adsorbent dosages (b); effect of initial mercury concentration on removal (c) and adsorbent capacity (d)
Adsorption kinetics
To understand the rate and mechanism of Hg(II) removal from an aqueous solution, knowledge of its kinetic parameters is required, hence a kinetics study was conducted. By graphing kinetic equations (1) and (2) against experimental data, linear connections were formed. Thus, kinetic parameters were determined and provided in Table 2. The effectiveness of the kinetic models was evaluated by the coefficient of determination values R2. The calculated kinetic constants demonstrated that the pseudo-second-order kinetic model had the highest correlation coefficient R2 and provided the best fit. Additionally, the results showed that the Hg-uptake obtained through pseudo-first-order kinetic was significantly lower than the experimental value (Qe(cal) ⊥ Qe(exp)). In contrast, the calculated Hg-uptake in pseudo-second-order kinetic was much closer to the experimental value. This finding was consistent with previous research conducted [31, 32]. These results confirm that the best-fit kinetic model is the pseudo-second-order kinetic model and that Hg adsorption on rice husk is most likely through the chemisorption mechanism [8,53].
Table 2
Kinetic parameters for the mercury adsorption over rice husk
|
Kinetic information |
Parameter |
Value |
|
Experimental data |
Qe(exp),mg/g |
90.63 |
|
Lagergren-first-order model |
Qe(cal), mg/g |
37.07 |
|
k1,min–1 |
0.0244 |
|
|
R2 |
0.57238 |
|
|
Pseudo-second-order model |
Qe(cal), mg/g |
92.65 |
|
k2, g/mg·min |
0.0016 |
|
|
R2 |
0.98859 |
Adsorption Isotherms
To study the adsorption mechanism, a brief overview of ten adsorption isotherms and the computation for obtaining curves from data fitting results are shown in Table 3. In prior work [54], the calculation of the isotherm adsorption is given in detail.
Table 3
A summary of ten adsorption isotherm models
|
Isotherm model |
Theoretical consideration |
Plot (x-axis vs y-axis) |
Parameter |
|
Langmuir |
The model assumes monolayer adsorption, in which adsorbates are adsorbed to a finite number of identical and equivalent definite localized sites with no lateral interaction, where kL represents the Langmuir constant; Qe represents the number of molecules adsorbed at equilibrium, mg/g; and Qmax represents the adsorption capacity, mg/g. The adsorption factor where RL describes unfavorable adsorption (RL > 1), linear adsorption (influenced by the number and concentration of adsorbed molecules) (RL = 1), too strong adsorption or irreversible adsorption (RL = 0), and favorable adsorption or absent of desorption (0 < RL < 1) |
|
|
|
Freundlich |
The model represents multilayer adsorption on heterogeneous surfaces produced by variances in adsorption heat, where kF is the Freundlich constant used to determine the adsorption capacity and Ce is the adsorbate concentration at equilibrium, mg/l; n is the degree of nonlinearity and the adsorption strength, following chemisorption n < 1 or physisorption n > 1; linear adsorption (a concentration-independent partition between two phases n = 1; normal adsorption n–1 < 1; cooperative adsorption n–1 > 1; favorable adsorption or no desorption 1 < n–1 < 0; and adsorption on a heterogeneous surface 0 < n–1 < 1; the n closer to zero indicates increasing heterogeneous of adsorbent surface |
|
|
|
Temkin |
The model covers interactions between adsorbent and adsorbate if the heat of adsorption of molecules reduces linearly in each adsorbed layer and excludes high and low concentration values, where AT is the Temkin model's equilibrium constant. BT is the Temkin constant, which determines whether adsorption is physical (BT < 8 kJ) or chemical (BT> 8 kJ) |
|
|
|
Dubinin – Radushkevich |
The model is based on the adsorption of gases by porous adsorbents and the pore-filling mechanism where Qs is the saturation capacity, mg/g; βis the Dubinin – Radushkevich constant correlating to the average free adsorption energy; ε is the Polanyi potential associated with equilibrium conditions, in which the value correlates to adsorption energy E relates to the physical (E < 8 kJ) or chemical (E > 8 kJ) adsorption |
|
|
|
Flory – Huggins |
The model is based on the adsorption of gases by porous adsorbents and the pore-filling mechanism where θ = (Ce/C0) is the degree of monolayer coverage; kFH are the equilibrium constant for the Flory – Huggins model, which correlates to the Gibbs free energy DG° can describe the spontaneous and temperature-dependent nature of the adsorption when it is negative |
|
|
|
Fowler – Guggenheim |
The model is based on the adsorption of gases by porous adsorbents and the pore-filling mechanism where W is the interaction energy between the adsorbed molecules, kJ/mol; informing processes under exothermic (W > 0), endothermic (W < 0), or no interaction between adsorbed molecules (W = 0) |
|
|
|
Hill – de Boer |
The model is based on the adsorption of gases by porous adsorbents and the pore-filling mechanism where k1 (l/mg) and k2 (kJ/mol) are the contact energy constants for the adsorbed molecules; k2 informing exothermic with intermolecular adsorption (k2 > 0); endothermic with repulsion (k2 < 0); or no interaction between adsorbates (k2 = 0) |
|
|
|
Jovanovic |
The model evaluates adsorption on a heterogeneous surface where a multilayer forms during the adsorption where Qe is the amount of adsorbate in the adsorbent at equilibrium, mg/g; Qmax is the maximum absorption of the adsorbate; kJ is the Jovanovic constant. At a high concentration of adsorbate, the preceding equation becomes the Langmuir isotherm |
|
|
|
Harkin – Jura |
The model evaluates adsorption on a heterogeneous surface where a multilayer forms during the adsorption where Qe is the amount of adsorbate in the adsorbent at equilibrium, mg/g; Qmax is the maximum absorption of the adsorbate; kJ is the Jovanovic constant. At a high concentration of adsorbate, the preceding equation becomes the Langmuir isotherm |
|
|
|
Halsey |
The model evaluates the multilayer adsorption system far from the surface. Similarly, to the Freundlich model, the Halsey model applies to multilayer adsorption and heterogeneous surfaces with non-uniformly distributed adsorption heat where kH and n are Halsey's constants |
|
|
Note: slope – slope factor; intercept – linear part of approximation equation.
A summary of ten adsorption isotherm models
The analysis of adsorption isotherms is crucial for determining how the adsorbent surface interacts with adsorbate molecules. The interaction between the metal ion and the adsorbent material, as well as the adsorption capacity of the material, can be determined using isothermal models. The ten isotherm adsorption models were used to match experimental mercury adsorption onto rice husk. The rice husk parameters derived from the ten studied models are presented in Table 4. The experimental values are reconstructed based on the charting of several parameters (using plot equations in Table 3). Then, linear correlation coefficients R2 are employed to demonstrate the compatibility of correlation curves between experimental data and linearized isotherm models.
Table 4
Isotherm parameters for the adsorption of Hg (II) on rice husk
|
Isotherm models |
Parameter |
Value |
|
Langmuir |
Qmax |
68.140 |
|
RL |
1.1 |
|
|
kL |
–0.0016 |
|
|
R2 |
0.934 |
|
|
Freundlich |
Ln kF |
5.308 |
|
kF |
0.788 |
|
|
1/nF |
–0.238 |
|
|
nF |
–4.200 |
|
|
R2 |
0.984 |
|
|
Temkin |
B |
–19.954 |
|
BT |
–1.229 |
|
|
AT |
2.02E-56 |
|
|
R2 |
0.989 |
|
|
Dubinin – Radushkevich |
β |
0.276 |
|
E |
1.345 |
|
|
R2 |
0.892 |
|
|
Flory – Huggins |
nFH |
–4.131 |
|
log kFH |
–10.702 |
|
|
kFH |
1.98575E-11 |
|
|
ΔG° |
–604.486 |
|
|
θ |
0.815 |
|
|
R2 |
0.984 |
|
|
Fowler – Guggenheim |
W |
–11.622 |
|
−ln kFG |
11.590 |
|
|
kFG |
9.2573E-06 |
|
|
a(slope) |
–0.772 |
|
|
θ |
0.815 |
|
|
R2 |
0.992 |
|
|
Hill – de Boer |
k1 |
1.47763E-13 |
|
−ln k1 |
29.543 |
|
|
k2 |
–1187.105 |
|
|
a(slope) |
–39.427 |
|
|
θ |
0.815 |
|
|
R2 |
0.969 |
|
|
Jovanovic |
k1 |
–0.006 |
|
ln Qmax |
4.676 |
|
|
Qmax |
107.299 |
|
|
R2 |
0.999 |
|
|
Harkin – Jura |
AH |
6369.008 |
|
BH/AH |
–0.00011 |
|
|
R2 |
0.970 |
|
|
Halsey |
1/nH |
–0.238 |
|
nH |
–4.200 |
|
|
ln kH |
5.308 |
|
|
kH |
201.925 |
|
|
R2 |
0.9836 |
The Langmuir factor RL defines whether the adsorption is favourable. In this instance, values fall in the range RL>1, indicating that the adsorption process is unfavourable, with maximum adsorption capacities Qm of 68.140 mg/g. In addition, the degree of adsorbate-adsorbent interaction kL indicates a weak contact between the adsorbate molecule and the adsorbent surface due to its small value (kL=–0.0016) [54]. Meanwhile, the correlation coefficient value for Langmuir is R2=0.934, indicating that the adsorption process employing the present adsorbent can produce a monolayer structure. Nevertheless, the negative value of kL shows that the data do not fit Langmuir.
The fitting performance of Freundlich is shown in Table 4. The slope derived via data fitting in the form of a gradient is n–1, while the intercept is lnkF. Analysis of the n value of the rice husk adsorbent revealed a negative value with correlations of n<1 and n–1<1, indicating that adsorption happens chemically via a typical process. In addition, the high value of R20.984 implies that the adsorption profile of rice husk in the adsorption process has a multilayer structure. The adsorption capacities denoted by kF have a value of 0.788 mg/g.
Temkin's approach was founded on the fact that adsorption decreases the heat of adsorption of all molecules in a linear way [55]. The determined values of its parameters (BT and AT) are given in Table 4. The BT and AT have small values (2.02∙10–56 and –1.229, respectively), which means less affinity between the adsorbent and adsorbate molecules due to their physical interactions. The correlation coefficient of Temkin (R2=0.989) suggests that there is multilayer adsorption with a homogenous distribution between the adsorbate and the surface of the adsorbent. However, because the parameter value is small, this model cannot be used.
Dubinin – Radushkevich's R2=0.892 value is the lowest in this study. This value indicates the existence of micropore size in adsorbent surfaces with multilayer structures. The examination of the E value in this model was <8 KJ/mol proving that adsorption is a physical process [55, 56].
The thermodynamic feasibility and spontaneity of an adsorption process can be predicted using the Flory – Huggins isotherm, which describes the degree of surface covering properties of the adsorbate on the adsorbent [54, 57]. The estimated nFH in this study (Table 4) suggests that the adsorbate occupies more than one active adsorbent zone generating a multilayer structure [54], this is supported by the R2 value as well R2=0.984, indicating that no molecule was bonded to any adsorption site on the rice husk adsorbent [57]. As a result, the Flory – Huggins model cannot predict the adsorption of Hg(II) onto rice husk due to small value parameters and is therefore disregarded. The negative ΔG value demonstrates that the adsorption of Hg(II) onto rice husk is thermodynamically spontaneous and validates the process's viability.
The Fowler – Guggenheim isotherm model takes into consideration the lateral interaction of adsorbate adsorption onto adsorbent [54, 58]. The R2=0.992 value of this model shows a good fit. On the contrary, the parameters (W and kFG) show relatively small values. A negative value of W indicates that the interaction occurs repulsively between the adsorbed molecules. Meanwhile, a very small kFG value indicates the weak interaction between the adsorbate and adsorbent due to the Van der Waals bond. Hence, this model is not suitable.
The Hill – deBoer model describes the mobile adsorption and lateral interaction of molecules that have been adsorbed [59]. Using equation(3), Hill – de Boer model adsorption parameters were determined. As seen in Table 4, the regression coefficient R2 had a value of 0.969 informing of the multilayer structure in the adsorption process. Meanwhile, a negative k2 value represents repulsion. When there is repulsion among the adsorbed species, the apparent affinity decreases with loading [59]. A modest value of k1 indicates poor adsorbent-adsorbate interaction because the active site is ineffective in carrying out the adsorption process. Consequently, this model is inappropriate.
The adsorption parameters of the Harkin – Jura model were obtained using equation(2). The R2 value of 0.970 is the result of a multilayer adsorption process on the surface of an adsorbent with heterogeneous pore distribution.
The coefficient correlation value of Halsey exhibits a good adsorption system (R2=0.984), indicating the nature of the adsorbent is heterogeneous with a multilayer structure. These results are in line with the Harkin – Jura model.
The Jovanovic isotherm model has few mechanical contacts between desorbing and adsorbing molecules [54, 58, 59]. The Jovanovic parameters exhibit the most satisfactory value (Table 4), with the correlation coefficient R2 (0.999) being near unity. In addition, this model has a high maximum capacity (107.299mg/g). This indicates that the experiment consists of adsorption with a moving and localized monolayer and no lateral contact.
The R2 value analysis reveals that the rice husk adsorption system is compatible with various models, excluding Dubinin – Radushkevich. The Langmuir, Freundlich, Temkin, Flory – Huggins, Hill – de Boer, Harkin –Jura, Fowler – Guggenheim, and Halsey models all showed a good fit, but the Jovanovic model provided the best results. This suggests that the adsorption process forms a monolayer structure without any lateral interactions between the adsorbate and adsorbent. Additionally, the rice husk adsorbent is believed to have a multilayer adsorption process due to its heterogeneous pore distribution, which leads to pore filling. Thus, the bond between the adsorbate and adsorbent is characterized by weak chemical and physical interaction (Fig.5). The screening and arrangement are based on an understanding of the coefficient of correlation R2. In descending order: Jovanovic, Fowler – Guggenheim, Temkin, Flory – Huggins, Freundlich, Halsey, Harkin – Jura, Hill – de Boer, Langmuir, Dubinin – Radushkevich. Although the model is in good agreement with the experimental results, analyses based on Table 4, physicochemical characterization, and kinetic adsorption show that the adsorption profile follows physical and chemical adsorption with multilayer adsorption. In addition, the adsorption process occurs endothermically and spontaneously by forming a multilayer surface with a pore-filling system and mutually repulsive intermolecular interactions.
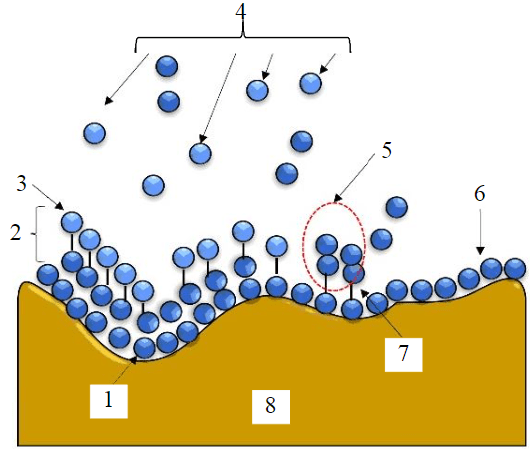
Fig.5. Rice husk adsorbent system prediction model
1 – week physical interaction; 2 – multilayer; 3 – physical adsorption; 4 – Free adsorbate; 5 – the interaction between free molecules and adsorbed molecules; 6 – monolayer; 7 – weak chemical interaction; 8 – adsorbent surface
Proposed adsorption mechanism
Concerning the characterization findings and in conjunction with the reported adsorption results, we propose the following adsorption mechanism. While morphology does indeed factor into the adsorption process, the presence of functional groups on the surface of rice husk is equally significant. There exists a noticeable relationship between Hg2+ and the oxygenated functional groups due to their interaction with available pairs of electrons on oxygen and the presence of aromatic structures (π-type bonds) in the materials. This results in them having polar characteristics with partially negative charges and a strong tendency to attract positively charged mercury ions. Thus, the rice husk adsorbent materials predominantly undergo Hg2+ adsorption through three processes: electrostatic interaction between the negatively charged density at the surface of rice husk and Hg2+ metal cation; formation of (–COO)2Hg and (–O)2Hg complexes due to the interaction between Hg2+ and conjugate bases of carboxylic and phenolic groups (–COO– and –O–), and interactions between Hg2+ and π (or ion exchange), Hg–Cπ electrons from the graphene structure (C=C) and C=O present in the materials. These findings agree with previous studies reported [31, 32, 36, 60]. However, the complexation reaction between –OH groups and Hg2+ is the most dominant [36]. The mechanism that happens during the adsorption process is complexation.
In addition, this study is preliminary for pilot and large scale process. Some issues must be more detailed analyzed, including the analysis in the formation of Hg into the pore structure, including the final pore structure. Further information relating to surface area (using BET and XRD) and molecule interaction (using FTIR) must be also done and compared to current literature [61-63].
Conclusions
The study successfully removed Hg(II) from realistic environmental concentration levels using rice husk in batch mode. The results showed that the ability to adsorb mercury increased with longer contact time, higher adsorbent dosage, and initial concentration.
The adsorption kinetics followed a pseudo-second-order model, and the Jovanovic model accurately described the adsorption isotherm with a maximum adsorption capacity of 107.299 mg Hg/g rice husk, suggesting a combination of physical and chemical interactions. The study also found that adsorbent materials with low surface area and high oxygenated functional groups are effective in removing Hg(II) because functional groups on the material's surface attract Hg(II) through various interactions. The rice husk material was found to be highly effective in removing Hg(II) from aqueous solutions. In conclusion, this study demonstrates the effectiveness of using rice husk for removing Hg(II) from water.
This study, we summarize the additional advantages of the use of rice husk as follows:
- rice husk is largely available, especially in rice-producing countries; since it is a by-product of rice production, the cost of rice husk is free;
- rice husk is categorized as one of the agricultural wastes, making the use of rice husk as an adsorbent material to solve the current issues in disposal and waste management;
- utilization of rice husk for wastewater treatment needs a simple procedure, requiring less processing steps;
- rice husk has an excellent pore structure, making it have a good adsorption capacity; further development and treatment of this rice husk can increase its selectivity;
- this method is also possible for being applied in the adsorption of heavy metal ions;
- the utilization of rice husk for adsorbing heavy metal can achieve significant results in realizing sustainable development goals (SDGs).
References
- Meutia A.A., Lumowa R., Sakakibara M. Indonesian Artisanal and Small-Scale Gold Mining – A Narrative Literature Review // International Journal of Environmental Research and Public Health. 2022. Vol. 19. Iss. 7. № 3955. DOI: 10.3390/ijerph19073955
- Teknologi Pengolahan Emas Pada Pertambangan Emas Skala Kecil di Indonesia. Buku 4 / Ed. by B.D.Krisnayanti, A.S.Probiyantono. Jakarta: UNDP Indonesia, 2020. 17 p. URL: https://goldismia.org/sites/default/files/2020-12/View% 20Buku%204%20%281%29.pdf (дата обращения 25.10.2023).
- Manzila A.N., Moyo T., Petersen J. A Study on the Applicability of Agitated Cyanide Leaching and Thiosulphate Leaching for Gold Extraction in Artisanal and Small-Scale Gold Mining // Minerals. 2022. Vol. 12. Iss. 10. № 1291. DOI: 10.3390/min12101291
- Green C.S., Lewis P.J., Wozniak J.R. et al. A comparison of factors affecting the small-scale distribution of mercury from artisanal small-scale gold mining in a Zimbabwean stream system // The Science of The Total Environment. 2019. Vol. 647. P. 400-410. DOI: 10.1016/j.scitotenv.2018.07.418
- Bashir A., Malik L.A., Ahad S. et al. Removal of heavy metal ions from aqueous system by ion-exchange and biosorption methods // Environmental Chemistry Letters. 2019. Vol. 17. Iss. 2. P. 729-754. DOI: 10.1007/s10311-018-00828-y
- Karwowska B., Sperczyńska E. Organic Matter and Heavy Metal Ions Removal from Surface Water in Processes of Oxidation with Ozone, UV Irradiation, Coagulation and Adsorption // Water. 2022. Vol. 14. Iss. 22. № 3763. DOI: 10.3390/w14223763
- Hua Kang, Xu Xueliu, Luo Zhiping et al. Effective Removal of Mercury Ions in Aqueous Solutions: A Review // Current Nanoscience. 2020. Vol. 16. Iss. 3. P. 363-375. DOI: 10.2174/1573413715666190112110659
- Ying Li, Yangxian Liu, Wei Yang et al. Adsorption of elemental mercury in flue gas using biomass porous carbons modified by microwave/hydrogen peroxide // Fuel. 2021. Vol. 291. № 120152. DOI: 10.1016/j.fuel.2021.120152
- Saleh T.A., Tuzen M., Sarı A. Polyamide magnetic palygorskite for the simultaneous removal of Hg(II) and methyl mercury; with factorial design analysis // Journal of Environmental Management. 2018. Vol. 211. № 323-333. DOI: 10.1016/j.jenvman.2018.01.050
- Xiaodong Yang, Yongshan Wan, Yulin Zheng et al. Surface functional groups of carbon-based adsorbents and their roles in the removal of heavy metals from aqueous solutions: A critical review // Chemical Engineering Journal. 2019. Vol. 366. P. 608-621. DOI: 10.1016/j.cej.2019.02.119
- Sanka P.M. Application of rice and corn husk biochar for removal of heavy metal ions from industrial wastewater: Dissertation. NM-AIST. Aruska, Tanzania, 2020. 51 p. URL: https://dspace.nm-aist.ac.tz/handle/20.500.12479/968 (дата обращения 25.10.2023).
- Kwikima M.M., Chebude Y., Meshesha B.T. Kinetics, adsorption isotherms, thermodynamics, and desorption studies of cadmium removal from aqueous solutions using bamboo sawdust/rice husk biochar // Biomass Conversion and Biorefinery. 2023. Vol. 13. Iss. 11. P. 9367-9379. DOI: 10.1007/s13399-022-03472-3
- Lala M.A., Ntamu T.E., Adesina O.A. et al. Adsorption of hexavalent chromium from aqueous solution using cationic modified rice husk: Parametric optimization via Taguchi design approach // Scientific African. 2023. Vol. 20. № e01633. DOI: 10.1016/j.sciaf.2023.e01633
- Peng Zhao, Zhanbin Huang, Ping Wang, An Wang. Comparative study on high-efficiency Pb(II) removal from aqueous solutions using coal and rice husk based humic acids // Journal of Molecular Liquids. 2023. Vol. 369. № 120875. DOI: 10.1016/j.molliq.2022.120875
- Putri S.E., Hasri, Side S. et al. Synthesis of Metasilicate Gel from Rice Husk and Its Application as Medium of Growth Single Crystal Calcium Tartrate Tetrahydrate (CaC4H4O6.4H2O) // Joint Conference on Green Engineering Technology & Applied Computing, 4-5 February 2019, Bangkok, Thailand. IOP Conference Series: Materials Science and Engineering, 2019. Vol. 551. № 012112. DOI: 10.1088/1757-899X/551/1/012112
- Raychaudhuri A., Behera M. Ceramic membrane modified with rice husk ash for application in microbial fuel cells // Electrochimica Acta. 2020. Vol. 363. № 137261. DOI: 10.1016/j.electacta.2020.137261
- Ababaii M.A., Gilani N., Pasikhani J.V. Modification of Rice Husk with Ultrasound-Assisted Inorganic Treatment and Its Application for Catalytic Hydrogen Production // BioEnergy Research. 2023. 11 p. DOI: 10.1007/s12155-023-10643-1
- Nandiyanto A.B.D., Ragadhita R., Girsang G.C.S. et al. Effect of palm fronds and rice husk composition ratio on the mechanical properties of composite-based brake pad // Moroccan Journal of Chemistry. 2022. Vol. 10. № 4. P. 663-677. DOI: 10.48317/IMIST.PRSM/morjchem-v10i4.34291
- Shukla N., Sahoo D., Remya N. Biochar from microwave pyrolysis of rice husk for tertiary wastewater treatment and soil nourishment // Journal of Cleaner Production. 2019. Vol. 235. P. 1073-1079. DOI: 10.1016/j.jclepro.2019.07.042
- Yisong Wang, He Jia, Peng Chen et al. Synthesis of La and Ce modified X zeolite from rice husk ash for carbon dioxide capture // Journal of Materials Research and Technology. 2020. Vol. 9. Iss. 3. P. 4368-4378. DOI: 10.1016/j.jmrt.2020.02.061
- Lazzari L.K., Zimmermann M.V.G., Perondi D. et al. Production of Carbon Foams from Rice Husk // Materials Research. 2019. Vol. 22. Suppl. 1. № e20190427. DOI: 10.1590/1980-5373-MR-2019-0427
- Daulay A., Andriayani, Marpongahtun, Gea S. Synthesis and application of silicon nanoparticles prepared from rice husk for lithium-ion batteries // Case Studies in Chemical and Environmental Engineering. 2022. Vol. 6. № 100256. DOI: 10.1016/j.cscee.2022.100256
- Hiroyuki Muramatsu, Yoong Ahm Kim, Kap-Seung Yang et al. Rice Husk-Derived Graphene with Nano-Sized Domains and Clean Edges // Small. 2014. Vol. 10. Iss. 14. P. 2766-2770. DOI: 10.1002/smll.201400017
- Adam F., Appaturi J.N., Thankappan R., Nawi M.A.M. Silica–tin nanotubes prepared from rice husk ash by sol–gel method: Characterization and its photocatalytic activity // Applied Surface Science. 2010. Vol. 257. Iss. 3. P. 811-816. DOI: 10.1016/j.apsusc.2010.07.070
- Khan K., Ullah M.F., Shahzada K. et al. Effective use of micro-silica extracted from rice husk ash for the production of high-performance and sustainable cement mortar // Construction and Building Materials. 2020. Vol. 258. № 119589. DOI: 10.1016/j.conbuildmat.2020.119589
- Rajanna S.K., Kumar D., Vinjamur M., Mukhopadhyay M. Silica Aerogel Microparticles from Rice Husk Ash for Drug Delivery // Industrial & Engineering Chemistry Research. 2015. Vol. 54. Iss. 3. P. 949-956. DOI: 10.1021/ie503867p
- Olugbemide A.D., Likozar B. Assessment of Liquid and Solid Digestates from Anaerobic Digestion of Rice Husk as Potential Biofertilizer and Nutrient Source for Microalgae Cultivation // Processes. 2022. Vol. 10. Iss. 5. № 1007. DOI: 10.3390/pr10051007
- Tien-Duc Pham, Thi-Mai-Anh Le, Thi-My-Quynh Pham et al. Synthesis and Characterization of Novel Hybridized CeO2@SiO2 Nanoparticles Based on Rice Husk and Their Application in Antibiotic Removal // Langmuir. 2021. Vol. 37. Iss. 9. P. 2963-2973. DOI: 10.1021/acs.langmuir.0c03632
- Khu Le Van, Thuy Luong Thi Thu. Preparation of Pore-Size Controllable Activated Carbon from Rice Husk Using Dual Activating Agent and Its Application in Supercapacitor // Journal of Chemistry. 2019. Vol. 2019. № 4329609. DOI: 10.1155/2019/4329609
- Kamari S., Ghorbani F. Extraction of highly pure silica from rice husk as an agricultural by-product and its application in the production of magnetic mesoporous silica MCM–41 // Biomass Conversion and Biorefinery. 2021. Vol. 11. Iss. 6. P. 3001-3009. DOI: 10.1007/s13399-020-00637-w
- Giraldo S., Robles I., Ramirez A. et al. Mercury removal from wastewater using agroindustrial waste adsorbents // SN Applied Sciences. 2020. Vol. 2. Iss. 6. № 1029. DOI: 10.1007/s42452-020-2736-x
- Al-Yaari M., Saleh T.A. Mercury Removal from Water Using a Novel Composite of Polyacrylate-Modified Carbon // ACS omega. 2022. Vol. 7. Iss. 17. P. 14820-14831. DOI: 10.1021/acsomega.2c00274
- Nandiyanto A.B.D., Oktiani R., Ragadhita R. How to read and interpret FTIR spectroscope of organic material // Indonesian Journal of Science and Technology. 2019. Vol. 4. № 1. P. 97-118. DOI: 10.17509/ijost.v4i1.15806
- Tariq M., Durrani A.I., Farooq U., Tariq M. Efficacy of spent black tea for the removal of nitrobenzene from aqueous media // Journal of Environmental Management. 2018. Vol. 223. P. 771-778. DOI: 10.1016/j.jenvman.2018.06.080
- Rengga W.D.P., Sediawan W.B., Imani N.A.C. et al. Adsorption Studies of Rice Husk-Based Silica/Carbon Composite // EKSAKTA: Journal of Sciences and Data Analysis. 2020. Vol. 1. Iss. 2. P. 98-104. DOI: 10.20885/EKSAKTA.vol1.iss2.art1
- Xiaoli Guo, Menghong Li, Aijv Liu et al. Adsorption Mechanisms and Characteristics of Hg2+ Removal by Different Fractions of Biochar // Water. 2020. Vol. 12. Iss. 8. № 2105. DOI: 10.3390/w12082105
- Tokay B., Akpınar I. A comparative study of heavy metals removal using agricultural waste biosorbents // Bioresource Technology Reports. 2021. Vol. 15. № 100719. DOI: 10.1016/j.biteb.2021.100719
- Gutierrez I.R. Evaluación de los cambios en los parámetros fisicoquímicos del suelo procedente de San Joaquín, Querétaro; después del tratamiento electrocinético para la remoción de mercurio: Tesis doctoral. Mexico: Centro de Investigación y Desarrollo Tecnológico en Electroquímica, 2015. URL: https://www.lareferencia.info/vufind/Record/MX_e7e02b542beacd21972161cd720c5b76 (дата обращения 25.10.2023).
- Songnan Li. Combustion synthesis of porous MgO and its adsorption properties // International Journal of Industrial Chemistry. 2019. Vol. 10. Iss. 1. P. 89-96. DOI: 10.1007/s40090-019-0174-7
- Jabar J.M., Odusote Y.A., Alabi K.A., Ahmed I.B. Kinetics and mechanisms of congo-red dye removal from aqueous solution using activated Moringa oleifera seed coat as adsorbent // Applied Water Science. 2020. Vol. 10. Iss. 6. № 136. DOI: 10.1007/s13201-020-01221-3
- Boulaiche W., Hamdi B., Trari M. Removal of heavy metals by chitin: equilibrium, kinetic and thermodynamic studies // Applied Water Science. 2019. Vol. 9. Iss. 2. № 39. DOI: 10.1007/s13201-019-0926-8
- Metz P.C. Total Scattering Analysis of Disordered Nanosheet Materials: A Thesis Submitted To The Faculty Of Alfred University In Partial Fulfillment Of The Requirements For The Degree Of Doctor Of Philosophy In Ceramic Engineering. New York: Alfred University, 2017. 157 p. URL: https://s3-eu-west-1.amazonaws.com/pfigshare-u-files/8231207/42017_Metz_Thesis_Final.pdf (дата обращения 25.10.2023).
- Yurdakal S., Garlisi C., Özcan L. et al. Chapter 4 – (Photo)catalyst Characterization Techniques: Adsorption Isotherms and BET, SEM, FTIR, UV–Vis, Photoluminescence, and Electrochemical Characterizations // Heterogeneous Photocatalysis. Elsevier, 2019. P. 87-152. DOI: 10.1016/B978-0-444-64015-4.00004-3
- Thommes M., Kaneko K., Neimark A.V. et al. Physisorption of gases, with special reference to the evaluation of surface area and pore size distribution (IUPAC Technical Report) // Pure Applied Chemistry. 2015. Vol. 87. № 9-10. P. 1051-1069. DOI: 10.15.15/pac-2014-1117
- Kumar K.V., Gadipelli S., Wood B. et al. Characterization of the adsorption site energies and heterogeneous surfaces of porous materials // Journal of Materials Chemistry A. 2019. Vol. 7. Iss. 17. P. 10104-10137. DOI: 10.1039/C9TA00287A
- Kolar P., Jin H. Baseline characterization data for raw rice husk // Data in brief. 2019. Vol. 25. № 104219. DOI: 10.1016/j.dib.2019.104219
- Ahmaruzzaman M., Gupta V.K. Rice Husk and Its Ash as Low-Cost Adsorbents in Water and Wastewater Treatment // Industrial & Engineering Chemistry Research. 2011. Vol. 50. Iss. 24. P. 13589-13613. DOI: 10.1021/ie201477c
- Al-Yaari M., Saleh T.A., Saber O. Removal of mercury from polluted water by a novel composite of polymer carbon nanofiber: kinetic, isotherm, and thermodynamic studies // RSC Advances. 2021. Vol. 11. Iss. 1. P. 380-389. DOI: 10.1039/D0RA08882J
- Zili Tang, Hui Wu, Qingbo Wen, Liming Hu. Effect of Adsorbent Dosage to Adsorbate Concentration Ratio on the Adsorption of Cd(II) on Coal Gangue // Proceedings of the 8th International Congress on Environmental Geotechnics, 28 October – 1 November 2018, Hangzhou, China. Springer, 2019. Vol. 1. P. 428-435. DOI: 10.1007/978-981-13-2221-1_45
- Akpomie K.G., Eluke L.O., Ajiwe V.I.E., Alisa C.O. Attenuation Kinetics and Desorption Performance of artocarpus altilis Seed Husk for Co (II), Pb (II) and Zn (II) Ions // Iranian Journal of Chemistry and Chemical Engineering. 2018. Vol. 37. Iss. 3 (89). P. 171-186. DOI: 10.30492/IJCCE.2018.30205
- Syafiuddin A., Fulazzaky M.A. Decolorization kinetics and mass transfer mechanisms of Remazol Brilliant Blue R dye mediated by different fungi // Biotechnology Reports. 2021. Vol. 29. № e00573. DOI: 10.1016/j.btre.2020.e00573
- Jain N., Dwivedi M.K., Waskle A. Adsorption of Methylene Blue Dye from Industrial Effluents Using Coal Fly Ash // International Journal of Advanced Engineering Research and Science. 2016. Vol. 3. Iss. 4. P. 9-16.
- Dada A.O., Adekola F.A., Odebunmi E.O. et al. Two–three parameters isotherm modeling, kinetics with statistical validity, desorption and thermodynamic studies of adsorption of C(II) ions onto zerovalent iron nanoparticles // Scientific Reports. 2021. Vol. 11. № 1. № 16454. DOI: 10.1038/s41598-021-95090-8
- Ragadhita R., Nandiyanto A.B.D. How to Calculate Adsorption Isotherms of Particles Using Two-Parameter Monolayer Adsorption Models and Equations // Indonesian Journal of Science and Technology. 2021. Vol. 6. № 1. P. 205-234. DOI: 10.17509/ijost.v6i1.32354
- Alabbad E.A. Effect of Direct yellow 50 removal from an aqueous solution using nano bentonite; adsorption isotherm, kinetic analysis and thermodynamic behaviour // Arabian Journal of Chemistry. 2023. Vol. 16. Iss. 2. № 104517. DOI: 10.1016/j.arabjc.2022.104517
- Nandiyanto A.B.D. Isotherm Adsorption of Carbon Microparticles Prepared from Pumpkin (Cucurbita maxima) Seeds Using Two-Parameter Monolayer Adsorption Models and Equations // Moroccan Journal of Chemistry. 2020. Vol. 8. № 3. P. 745-761. DOI: 10.48317/IMIST.PRSM/morjchem-v8i3.21636
- Shikuku V.O., Mishra T. Adsorption isotherm modeling for methylene blue removal onto magnetic kaolinite clay: a comparison of two-parameter isotherms // Applied Water Science. 2021. Vol. 11. Iss. 6. № 103. DOI: 10.1007/s13201-021-01440-2
- Dada A.O., Ojedira J.O., Okunola A.A. et al. Modeling of Biosorption of Pb(II) and Zn(II) Ions onto PAMRH: Langmuir, Freundlich, Temkin, Dubinin – Raduskevich, Jovanovic, Flory – Huggins, Fowler – Guggenheim and Kiselev Comparative Isotherm Studies // International Journal of Mechanical Engineering and Technology. 2019. Vol. 10. Iss. 2. P. 1048-1058.
- Yousef N.S., Farouq R., Hazzaa R. Adsorption kinetics and isotherms for the removal of nickel ions from aqueous solutions by an ion-exchange resin: application of two and three parameter isotherm models // Desalination and Water Treatment. 2016. Vol. 57. Iss. 46. P. 21925-21938.
- Yao Huang, Siyu Xia, Jingjing Lyu, Jingchun Tang. Highly efficient removal of aqueous Hg2+ and CH3Hg+ by selective modification of biochar with 3-mercaptopropyltrimethoxysilane // Chemical Engineering Journal. 2019. Vol. 360. P. 1646-1655. DOI: 10.1016/j.cej.2018.10.231
- Irwansyah F.S., Amal A.I., Diyanthi E.W. et al. How to Read and Determine the Specific Surface area of Inorganic Materials Using the Brunauer – Emmett – Teller (BET) Method // ASEAN Journal of Science and Engineering. 10 p. URL: https://ejournal.upi.edu/index.php/AJSE/article/view/60748 (Online First) (дата обращения 25.10.2023).
- Sukamto S., Rahmat A. Evaluation of FTIR, Macro and Micronutrients of Compost from Black Soldier Fly Residual: in Context of Its Use as Fertilizer // ASEAN Journal of Science and Engineering. 2023. Vol. 3. № 1. P. 21-30. DOI: 10.17509/ajse.v3i1.42798
- Fatimah S., Ragadhita R., Husaeni D.F.A, Nandiyanto A.B.D. How to Calculate Crystallite Size From X-Ray Diffraction (XRD) Using Scherrer Method // ASEAN Journal of Science and Engineering. 2022. Vol. 2. № 1. P. 65-76. DOI: 10.17509/ajse.v2i1.37647