Analyzing friction bolts load bearing capacity in varying rock masses: an experimental study in Anti Atlas Imiter silver mining region, Morocco
- 1 — Ph.D. профессор Mohammed V University ▪ Orcid
- 2 — Ph.D. Professor Mohammed V University ▪ Orcid
- 3 — Ph.D. Professor Mohammed V University ▪ Orcid
- 4 — Ph.D. Professor Mohammed V University ▪ Orcid
- 5 — Ph.D. Professor Mohammed V University ▪ Orcid
Abstract
This study analyzes how key factors impact friction rock bolt capacity using standard pull-out tests, focusing on 39 mm diameter, 180 cm long split-tube bolts. We investigate bolt performance dependence on rock mass rating (RMR), time after installation, schistosity orientation, surface roughness, and installation quality. The aim is optimizing bolt design and implementation for enhanced underground stability and safety. Results show RMR strongly exponentially correlates with pull-out resistance; higher quality rock masses increase capacity. Anchorage capacity significantly rises over time, especially for RMR above 70. Increasing angle between bolt axis and rock foliation from 0 to 90° boosts pull-out response. Reducing borehole diameter below bolt diameter grows bolt-ground friction. Empirical models estimate load capacity based on RMR, time, orientation, diameter, roughness and installation quality. These reliably predict bolt performance from site conditions, significantly improving on basic RMR methods. Experiments provide practical friction bolt behavior insights for typical rock masses. The data-driven analysis ensures models are applicable to actual underground scenarios. This enables tailored optimization of bolting configurations and supports. Methodologies presented should improve safety, efficiency and cost-effectiveness of reinforced mining and tunneling. Overall, this study fundamentally furthers friction bolt performance understanding, enabling superior underground support design.
None
Introduction
Pull-out testing commonly determines anchored bolt strength by applying appropriate tensile force. A hydraulic jack imparts force onto the bolt head relying on the encompassing rock mass, while a dial gauge records bolt elongation to plot load-displacement response [1].
The focus of this study is on the investigation of split tubular friction bolts with a diameter of 39 mm, a length of 180 cm and steel grade is Supraform S420MC/EN10149, which are widely employed in the study area due to their availability and efficiency in underground activities. The maximum capacity of these bolts is determined by the friction of the steel with the rock wall [2].
The principal objective herein examines multiple factors influencing friction of bolts within schistose rockmasses. Utilizing varied Rock mass rating (RMR) specimens, numerous pull-out tests investigated this relationship. Experiments exhibit a considerable correlation between RMR and pull-out resistance, necessitating inclusion of this index in bolt design protocols [3].
We also investigated the influence of time on the load-bearing capacity of the bolts after a prolonged period in place. Depending on the quality of the rock mass, our studies showed varying improvements, with load-bearing increases of 31 % for lower quality masses (RMR < 40 %), 21 % for medium quality masses (RMR from 50 to 70 %), and 25 % for high-quality masses (RMR > > 70 %) [4].
Additionally, schistosity-oriented anisotropy effects on bolt capacity were investigated. Outcomes display escalating anisotropy angles, specifically perpendicular orientations to schistosity foliations, improve load-bearing performance. Leveraging RMR classifications, time post-installation and anisotropy configurations, mathematical models predict bolt capacity. Such quantifications potentiate enhanced underground support selections over conventional empirical approaches.
Methodology
Friction bolts are hollow and thin metal profiles brought into intimate contact with the rock along their entire length, allowing for friction-based anchoring, their effectiveness is immediate. The split set (Fig.1, a) is a friction anchorage bolt for rocks that is inserted within seconds by simple percussion into a hole slightly smaller in diameter than the tube. The straightness of the hole is not important. The bolt conforms to the irregularities of the terrain, provides significant friction through radial pressure along its entire length (Fig.1, b), and ensures immediate anchoring.
Pull-out testing is a typical method for evaluating the resistance of anchored split set bolts, with the goal of reaching the limits of strength, whether slippage or failure [5]. Using a jack during this test allows you to apply tensile force to the bolt head while relying on the surrounding rock wall for support (Fig.1, c). Measuring the elongation of the bolt using a comparator enables for the plotting of the bolt's “load-displacement” behavior curve. Under normal installation settings, the maximum capacity of split-tube friction bolts is rarely achieved. In fact, as long as the drill hole is not large, the interface friction between the steel and rock wall serves as the principal load-bearing mechanism for these bolts [6].
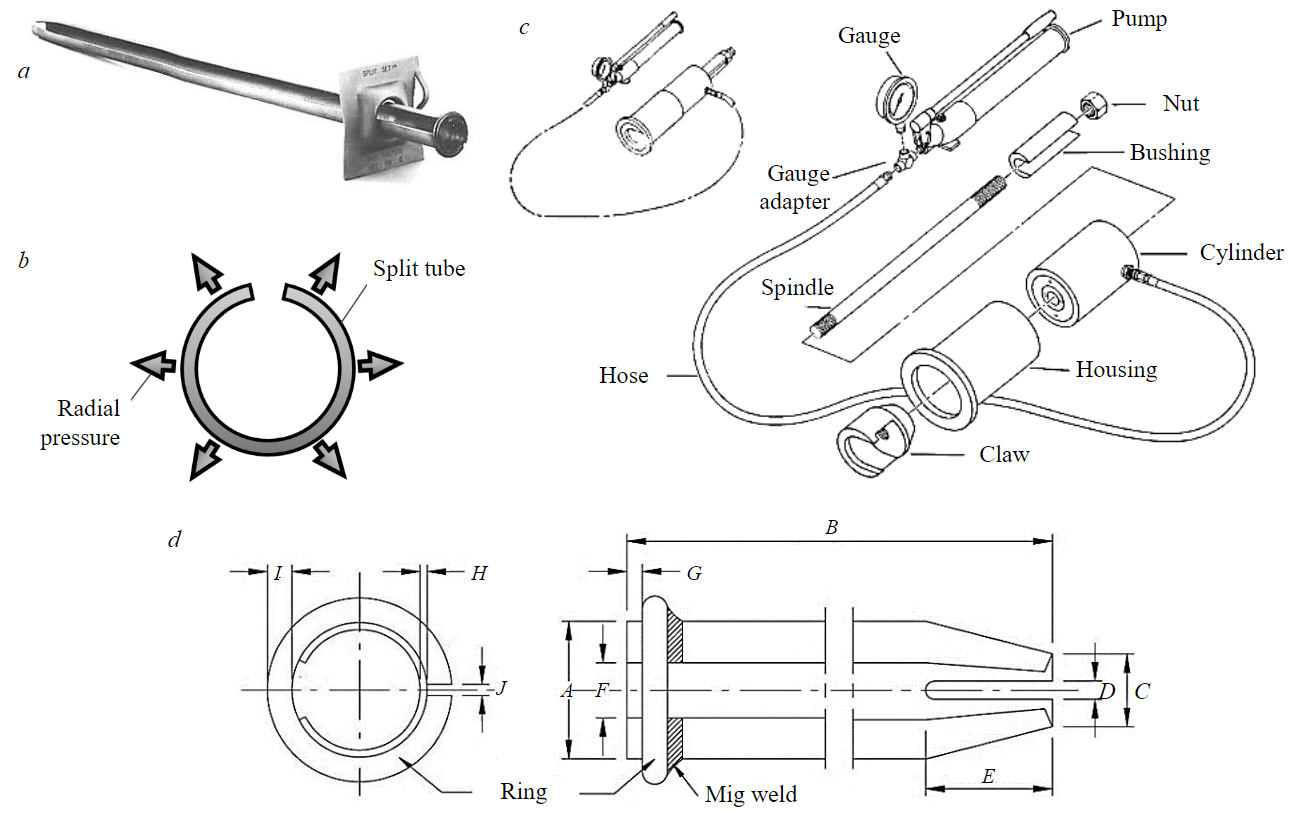
Fig.1. Friction bolt (split set) (a); radial pressure of the friction bolt (b); device for sealed bolt pull-out tests (c); split set cross and longitudinal sections (d)
The maximum load is divided by the remaining length of the bolt (180 cm) in the hole to calculate the unit anchorage capacity. This is a routine test, and the average weight carried by the bolt is calculated as follows:
where F – tensile force, N; D – hole diameter, m; L – bolt length, m; φ – rock-steel friction angle, degree.
The use of 39 mm split-tube friction bolts for this study is justified by their extensive use and availability in the research area, as well as their effectiveness, practicability, and adaptation to the unique conditions of underground labor [7]. The goal of this study is to examine the effect of various factors on the friction created by these bolts in a specific rock mass, which is characterized by siltstone rock mass with considerable schistosity.
The selection of the test site and rock type for the study aimed to provide significant and representative outcomes by considering various factors. In order to examine the impact of rock mass quality on bolt bearing capacity, diverse rock materials with distinct geomechanical features were chosen. This ensured a thorough investigation of the connection between the RMR index and pull-out resistance. A variety of rock types with differing strengths and discontinuities were picked to represent a broad array of rock mass qualities. Furthermore, homogenous and typical rock blocks from the chosen rock mass were cautiously selected for the experiments. These samples possessed uniform characteristics within their respective rock mass categories, which reduced potential variations in test findings and established a reliable dataset for evaluating the association between RMR index and pull-out resistance.
During the experimentation phase, a steel tripod played a crucial role in securing the pull-out jack. By providing steady and robust support, the tripod efficiently fastened the pull-out jack, preventing any movement or tilting during the application of axial forces. As a result, precise and consistent measurements of pull-out resistance could be obtained, enhancing the overall accuracy and reliability of the experimental procedures (Fig.2).
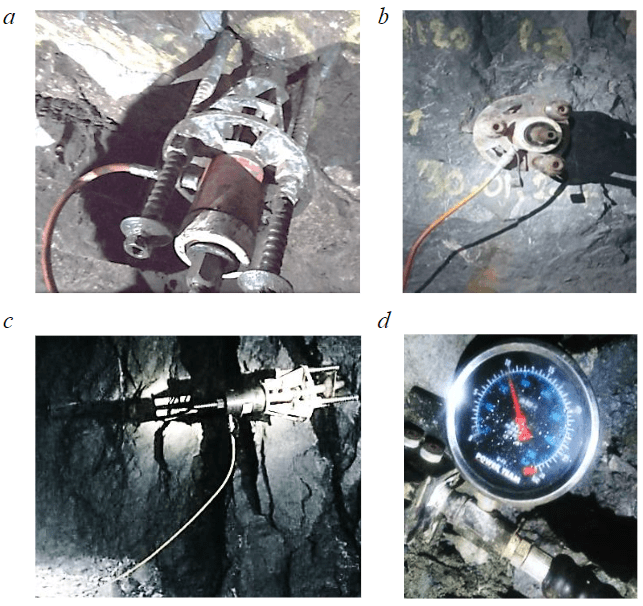
Fig.2. Preparation for testing: anchoring of the tripod to the rock face (a); installation of the jack (b, c); initiation of the pull-out test (d)
The steel tripod's importance stems from its ability to minimize extraneous influences that could influence test results. The tripod helps prevent potential sources of mistake or measurement inaccuracy or danger that could occur from the risk of high pressure exerted or unexpected leakage occurrence or instability by providing a steady platform for the pull-out jack. This allowed for more precise determination of pull-out resistance, allowing for a more accurate measurement of the relationship between RMR index and bolt bearing capacity.
Discussion of the results
Effect of rock mass quality on the bearing capacity of friction bolts
The relationship between the RMR index and pull-out resistance reveals important information about the impact of rock mass quality on bolt bearing capacity. The RMR index is a popular classification system for determining the geomechanical properties of rock masses. Understanding the relationship between RMR and pull-out resistance is crucial for designing and installing effective bolt support systems [8-11].
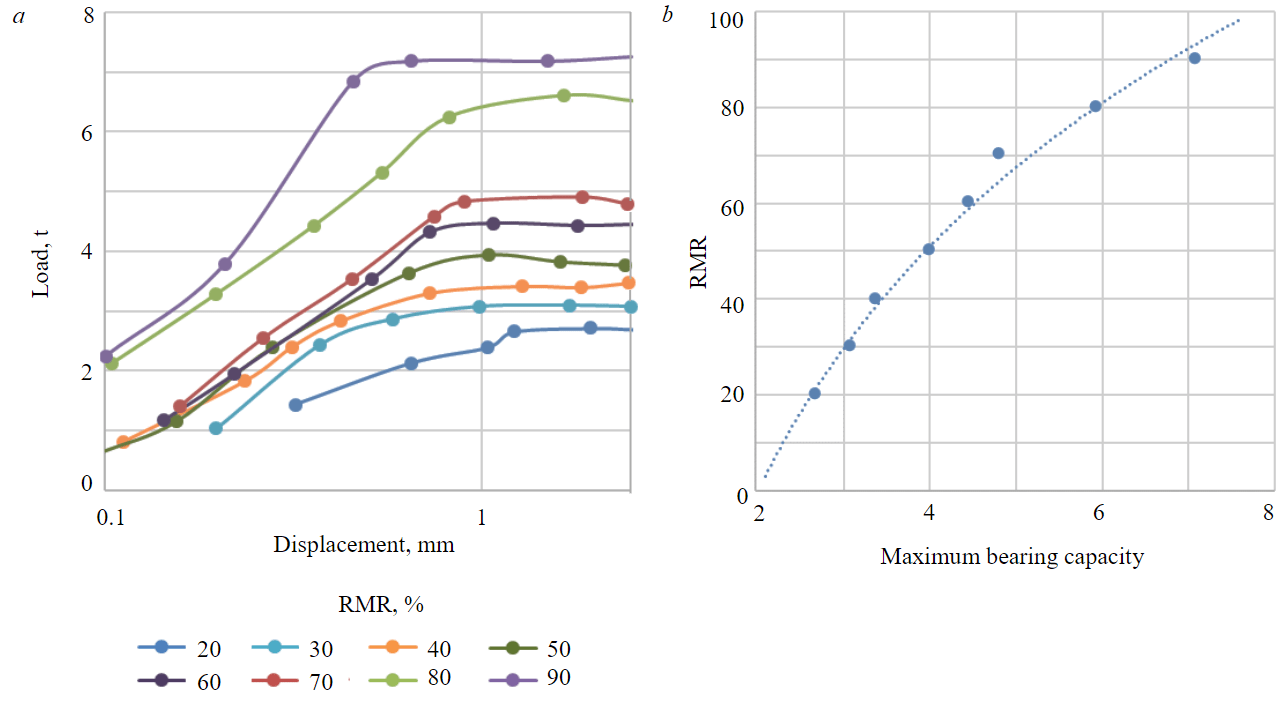
Fig.3. Experimental pull-out values according to RMR classes (a); plot of experimental anchorage values according to RMR classes (b)
The Rock mass rating used in our study is a numerical categorization method used in geotechnical engineering and rock mechanics to evaluate and define a rock mass's qualities and stability. It considers a variety of parameters, including rock quality, joint spacing and conditions, groundwater, and other geological properties, to produce a quantitative assessment of the rock mass's appropriateness for excavation, or mining projects. RMR readings typically vary from 0 to 100, with higher values suggesting higher quality and stability of the rock mass [12-14].
The current study used a comprehensive analysis to evaluate the relationship between the RMR index and pull-out resistance. Bolts were inserted in rock masses with varied RMR values in a series of tests. The bolts' pull-out resistance was measured and compared to the RMR index of the rock masses. A total of eight pull-out tests were performed to assess pull-out resistance using the RMR index. To replicate various conditions for the pull-out of 39 mm split-tube friction bolts, test holes of 34 mm diameter were drilled in rock masses with differing RMR characteristics.
The pull-out test results were visually plotted against the ultimate load (Fig.3, a). A linear regression trendline was fitted to the data for each rock mass quality to examine the correlations between pull-out resistance and the RMR index.
Variations in the RMR index have shown a significant relationship with bolt pull-out resistance (Fig.3, b). It is possible to plot a load-bearing curve based on the RMR by using the ultimate failure points for different rock mass characteristics. Based on the RMR index of the rock mass, this curve allows for the investigation and prediction of bolt load-bearing capacity.
The results demonstrated a strong relationship between RMR index and pull-out resistance. Increased RMR values were associated with increased pull-out resistance, implying that rock masses with better geomechanical characteristics had larger bolt bearing capacity. Rock masses with lower RMR values, on the other hand, displayed lesser pull-out resistance, indicating poor bolt performance. These test findings are also utilized to develop an expression for bolt spacing based on the anticipated load-bearing capacity in relation to RMR, Barton's support pressure and the Choquet and Charlette formula [15, 16].
The following expression describes the relationship between bolt load-bearing capability and the RMR index:
In the next step, we will use the Q-system, developed by N.Barton, this index is a widely used rock mass classification system in geotechnical engineering. It provides a quantitative assessment of the quality and behavior of rock masses also evaluates various geological and structural factors, such as rock strength, joint spacing and orientation, as well as groundwater conditions, to assign a numerical value called the Q-value. The Q-value serves as an indicator of rock mass quality, with higher values representing more favorable conditions for excavation and tunnel stability. Geotechnical engineers utilize the Q-system to make informed decisions regarding support pressure [17].
The support pressure according to N.Barton:
where Jr – rugosity parameter from Q-system.
The minimum bolts spacing developed by P.Choquet is given by the following expression:
And from our previous work in 2018 [18] on RMR-Q system correlation developed from the same mining zone
By introducing the proposed load-bearing expression and derived RMR-Q system correlation, the proposed bolt spacing taking into account the RMR index becomes:
Using the previous expression, engineers and geologists can make informed judgments on bolt design, installation, and spacing by using these equations and correlations, resulting in better safety and long-term stability in rock mass engineering projects.
Time effect on anchorage capacity in dry rock mass
When evaluating the long-term stability of underground works, it is critical to consider the temporal influence on bolt load-bearing capability. It refers to the phenomena in which the load-bearing capacity of rock bolts can alter over time due to factors such as rock oxidation, deformation, bolt relaxation. Understanding the time impact is critical for assuring the effectiveness and durability of rock bolting systems fixed in wet or altered rock mass [19-22].
This analysis focuses on pullout tests done on rock bolts installed in dry non altered rock mass conditions. The goal is to characterize the time-dependent rock bolt load-bearing capacity in these dry holes. By testing bolts installed for varying periods, the temporal gain in anchorage performance can be quantified. This enables development of a relationship for growth in bolt capacity over time, known as the time-dependent strength enhancement factor. Analysis of pull-out results over a range of elapsed installation times allows calibration of this enhancement factor for the specific dry rock mass and bolt type used. Quantifying the time-related bolt capacity increase in dry conditions provides insight into one of the key factors improving anchor performance.
In 2016, a total of 21 bolts were put in three different types of underground rock masses, with RMR indices of 40, 60, and 80 %, respectively. To mitigate the effect of anisotropy on load-bearing capacity, the bolts were positioned perpendicular to the rock mass schistosity angle in this section of our investigation. The identical installation technique was used in 2017 and 2018 to measure the time effect on bolt load-bearing capacity after a long amount of time in position.
After 18 months, no significant improvement in load-bearing capacity was seen, according to the graphical analysis. (Fig.4, a). This stymied progress can be due to the low level of confinement given by a rock mass with an RMR of less than 40 %. Specifically, the load-bearing capacity value grew by 31 % from 3.2 to 4.2 t at the conclusion of the 18th month. The following equation is provided for an RMR class of 40 % or lower:
where t – duration, months.
Within a range of intermediate class where RMR is considered between 70 to 50 %, a gradual improvement in the load-bearing ability of friction bolts is noticed. After three years, the load-bearing capacity value improved from 4.2 to 5.1 t, representing a 21 % improvement (Fig.4, b). This good tendency can be attributed to a consistent amount of confinement that is maintained following bolt placement in a moderately quality rock mass. In this sense, the following is a proposed formulation to model this relationship:
Starting in the 18th month of the trial, a considerable improvement in load-bearing ability was noted for RMR quality classes greater than 70 %. The load-bearing capacity value rose significantly, rising from 5.3 to 6.67 t at the end of the 36-month observation period, representing a 25 % improvement (Fig.4, c). This significant increase is due to enhanced finement stresses in a high-quality rock mass. Increased confinement stresses under these favorable conditions led in a better distribution of the applied load, improving the system's total load-bearing capability [23]. To model this relationship in this case, we recommend using a polynomial expression:
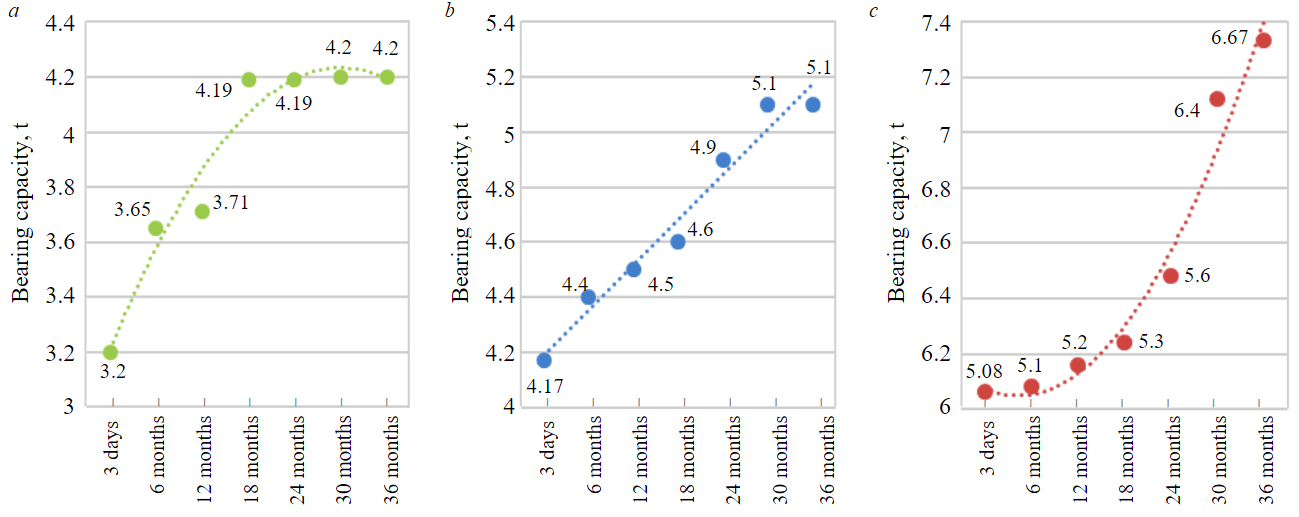
Fig.4. Evolution of pull-out values for RMR class = 40 % (a); RMR class = 60 % (b); RMR class = 80 % (c)
The results of these experiments revealed important information on the time influence on bolt load-bearing capacity. It was discovered that the load – bearing capacity of the bolts decreased over time. This reduction could be attributable to processes such as rock deformation, bolt relaxation, and creep inside the rock mass. The extent of the decrease varied based on the rock type, bolt type, and installation settings.
Estimation of load-bearing capacity accounting for RMR and time
The evolution of anchor capacity over time is critical for reliability assessments in field applications. The load-bearing capacity degrades over time after installation due to corrosion, loosening at the bolt-rock interfaces, and rock mass deterioration; To quantify this time effect, the measured increase in friction bolt pull-out resistance over 36 months was categorized by RMR, using 21 pull-out tests (Table 1).
Table 1
Increase in bearing capacity of friction bolts over time for different RMR classes
|
RMR, % |
3 days |
6 months |
12 months |
18 months |
24 months |
30 months |
36 months |
|
40 |
0 |
14 |
2 |
13 |
0 |
0 |
0 |
|
60 |
29 |
38 |
23 |
24 |
17 |
22 |
21 |
|
80 |
57 |
59 |
42 |
43 |
34 |
53 |
59 |
Interpolative analysis of these pull-out datasets enabled development of a 3D response surface representing bearing capacity as a joint function of RMR and elapsed time since installation (Fig.5, a). This visualization elucidates the interdependence of rock mass quality and long-term confinement pressure effects on anchor capacity.
Regression analysis was utilized to derive a closed-form empirical relationship defining the time-dependent bearing capacity (Fig.5, b). To estimate the load-bearing capacity taking into account the RMR parameters and the number of months since installation, an empirical formula can be written as follows:
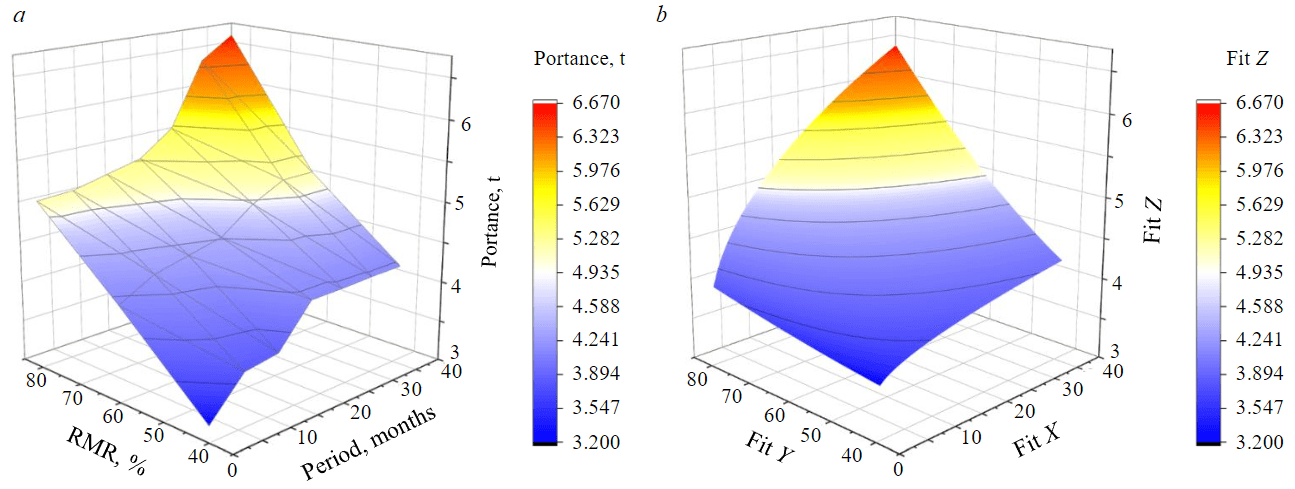
Fig.5. 3D surface interpolation from pullout measurement points (a); 3D surface plotting of fitted model (b)
This time-dependent adjustment coefficient will have the following form
The regression-based equation provides a means to predict time-dependent capacity evolution based on the initial in-situ conditions. Further testing for model validation and refinement of the regression coefficients is recommended across a wider range of RMRs and curing periods.
Effect of anisotropy on bolt load-bearing capacity
The effect of foliation-induced anisotropy on friction bolt load-bearing capacity has piqued the curiosity of researchers in rock mechanics and geotechnical engineering. Understanding the link between anisotropy and bolt performance is critical for assuring rock mass support system stability and safety [24-27].
Foliation in rock masses can significantly affect their overall strength and mechanical behavior. Foliation is a geological structure that is distinguished by the existence of separate parallel layers within a rock. This alignment can result in planes of weakness along which rocks are more prone to fracture or deforming when stressed. As a result, rock masses with well-developed foliation frequently exhibit anisotropic behavior, which means their strength qualities can vary significantly depending on the orientation of loading [28, 29].
In our case, the pullout process began with a parallel orientation to the schistosity and progressed to a perpendicular orientation. The goal of this testing program was to emphasize the effect of schistosity on friction bolt load-bearing capacity (Fig.6, a). Over a 3-day period, a series of 21 pull-out tests were performed on 18 previously installed bolts in three rock mass quality (RMR 40, 60 and 80 %) to investigate the effect of schistosity-induced anisotropy on the load-bearing capacity of friction bolts. The anisotropy angle was varied between six different values with a 15° increment in these tests, the results show a strong relationship between anisotropy angle and load-bearing capacity of friction bolts in each RMR class. An increase in anisotropy angle is associated with an increase in bolt load-bearing capability (Fig.6, b).
A 3D surface plot representing bearing capacity as a function of RMR and anisotropy angle a was generated through interpolation between the available field pull-out measurement data points (Fig.6, c). This enabled visualization of the combined effects of these two key parameters on anchor capacity. The capacity response surface exhibits an exponential relationship with respect to both RMR and anisotropy angle (Fig.6, d). Regression analysis was utilized to derive a closed-form empirical equation defining the bearing capacity as:
The proposed exponential model provides a functional relationship able to capture the combined effect of bolt length and rock mass quality on empirically measured pull-out capacities across the tested parameter range. With an optimized coefficient of determination of R² = 0.94, this exponential formulation enables reliable estimation of anchor bearing capacity as a function of both bolt length and in-situ rock mass rating. Additionally, an anisotropy adjustment factor is proposed to quantify the influence of foliation angle θ on the capacity prediction:
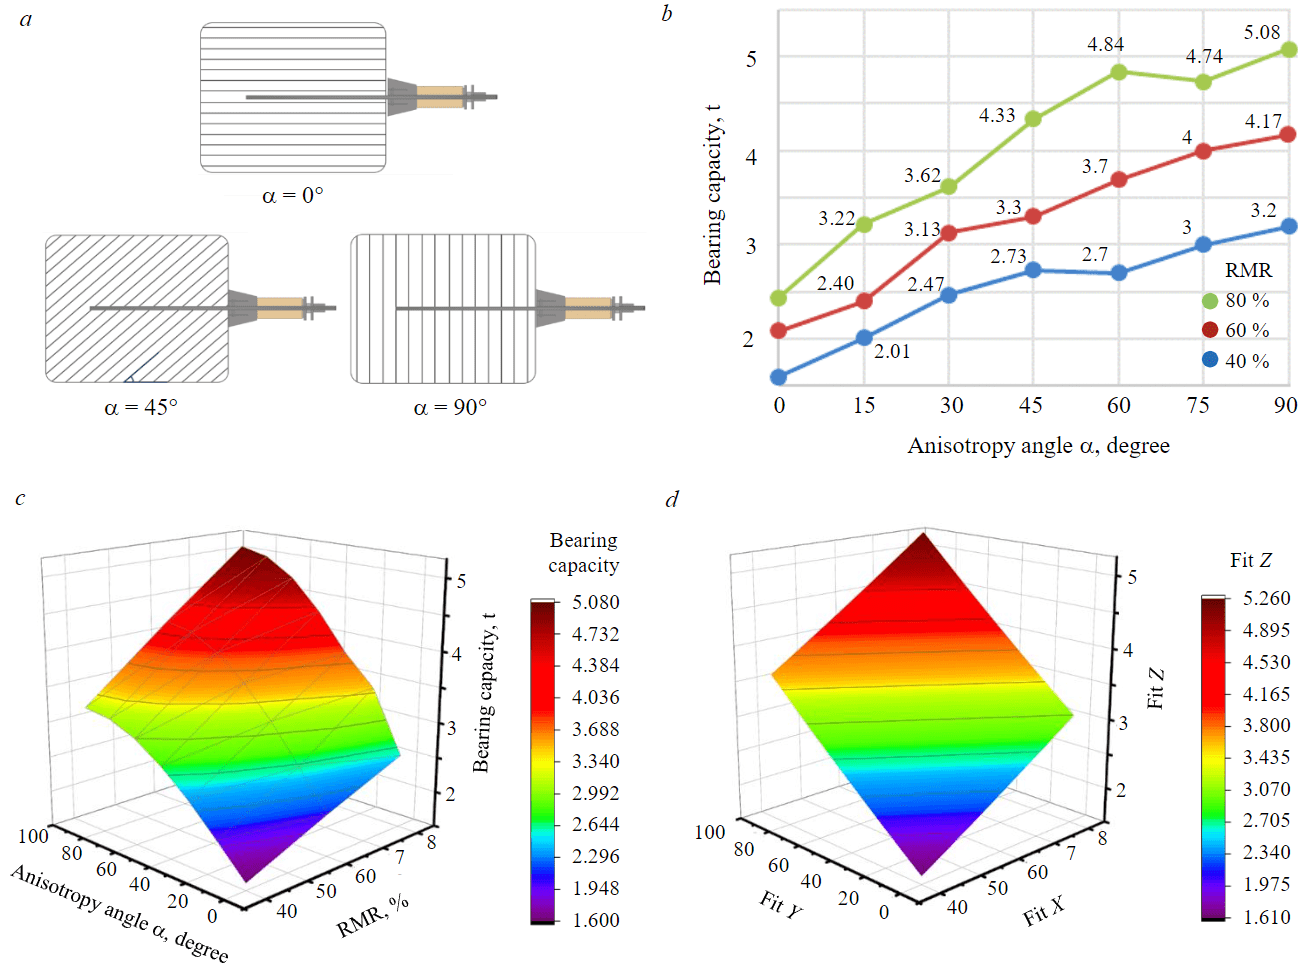
Fig.6. Schematic cross-section of pullout test with varying schistosity angle (a); variation of load-bearing capacity according to anisotropy angle a (b); 3D surface interpolation from pull-out measurement points (c); 3D surface plotting of fitted exponential model (d)
This adjustment factor ranges from 0.5 to 1, representing maximum and minimum anisotropy respectively. Incorporating the quantitative effect of schistosity inclination θ enables the bolt capacity prediction to account for the specific orientation of individual anchors with respect to the prevalent foliation planes. This is expected to improve accuracy and reliability of capacity estimates across varied rock mass conditions. Further validation through field testing of inclined bolts in foliated rock is recommended.
Anchoring Surface Roughness and irregularity
We propose employing a second adjustment factor to change the load-bearing capability of anchor bolts in order to account for the roughness of the inside surface of the anchor holes. This component varies based on the rock's state and the existence of cracks or discontinuities inside the drilled holes. Field observations can be used to assess it [30, 31].
We propose employing a qualitative approach based on observation and evaluation of the roughness to derive this adjustment factor AF2 based on the roughness of the anchoring surface:
where n is a coefficient of roughness of the anchoring surface, typically ranging from 0 to 1; m is a coefficient of irregularity of the anchoring surface, typically ranging from 0 to 1.
Here is a proposed Table 2 of values for m and n based on a qualitative description of the roughness of the anchoring surface.
Table 2
Roughness Level and Irregularity Coefficients
|
Description |
Coefficients |
|
|
n |
m |
|
|
Extremely rough and irregular |
0.1 |
0.5 |
|
Very rough and irregular |
0.2 |
0.1 |
|
Rough and relatively regular |
0.3 |
0.2 |
|
Moderately rough and regular |
0.5 |
0.3 |
|
Slightly rough and regular |
0.8 |
0.6 |
|
Very smooth and regular |
0.9 |
0.9 |
The suggested empirical method provides a practical methodology for assessing the roughness of the anchoring surface and its impact on load-bearing capability. Engineers can easily include this adjustment factor AF2 into their calculations by employing roughness n and irregularity m coefficients, which can be assessed by observation and qualitative descriptions.
Installation Quality Criteria Coefficient
We can evaluate the impact of installation quality on bolt load-bearing capacity by utilizing a third adjustment factor AF3. A greater AF3 indicates a high-quality installation, which results in improved adhesion between the bolt and the rock mass, enhancing load-bearing capacity [32]. The coefficient constitutes a cumulative score determined by the adherence to prescribed guidelines, serving as the proposed installation quality criterion. Derived through experiential learning, collaboration, and consultations among all mining teams responsible for installing anchor bolts, AF3 emerges as a qualitative metric intended to impose penalties upon bearing values instead of amplification. Conversely, when all prerequisites for anchor bolt placement are perfectly fulfilled, leading to impeccable application, the coefficient assumes a unitary value (i.e., 1). To determine this adjustment factor based on the quality of anchor bolt installation, we present a qualitative technique based on a field evaluation of many installation-related parameters. Here's a general formula for calculating AF3
where installation quality criteria coefficient Ri: adherence to installation recommendations R1 0.2; use of appropriate anchoring R2 0.2; adequate quality control R3 0.1; installer training and competence R4 0.1; regular maintenance and monitoring R6 0.1; favorable environmental conditions R7 0.1; absence of observed defects or anomalies R8 0.2.
Influence of borehole diameter
To guarantee secure bolt attachment [33] advise that the drill holes be somewhat smaller than the split set diameter. The bolt design allows for bit size flexibility. Bond strength varies depending on bit size and rock type. Pull-out strength reduces as bit size increases. When determining bit size and pull-out strength, consider the rock type and quality [34-36].
A series of 15 pull-out tests were performed perpendicular to the schistosity to negate the effect of anisotropy to study the influence of borehole diameter on the load-bearing capacity of friction bolts relative to the diameter of bolts introduced into the rock mass. In this analysis, the installed rock bolts have a constant diameter of 39 mm. To investigate the influence of borehole diameter, test cases were examined with borehole diameters ranging from 34 to 38 mm. Quantifying the impact of the diameter difference between the installed bolt and drilled hole provides insight into the load transfer mechanism (Table 3). A general empirical relationship can be deduced by defining a percentage ratio based on the diameter difference:
where Dhole is the borehole diameter; Dbold is the bolt diameter.
Table 3
Difference ratio between borehole diameter and rock bolt diameter
|
Parameter |
Index |
||||
|
Borehole diameter, mm |
34 |
35 |
36 |
37 |
38 |
|
Rock bolt diameter, mm |
39 |
39 |
39 |
39 |
39 |
|
Diameter difference ratio DDR, % |
14.71 |
11.43 |
8.33 |
5.41 |
2.63 |
This normalized ratio enables comparison across varying diameters and can be related to changes in load capacity (Fig.7, a). Evaluating this ratio for different borehole diameters while keeping the bolt diameter constant allows characterization of the diameter difference effect and derivation of a bolt-borehole interaction model (Fig.7, b).
Borehole diameter significantly impacts rock bolt performance across rock masses of varying quality. This enables analysis of the role borehole diameter plays in governing bolt pull-out resistance for different rock mass ratings. To quantitatively characterize this relationship, a regression model can be developed correlating borehole diameter to resultant bolt load-bearing capacity (Fig.7, c):
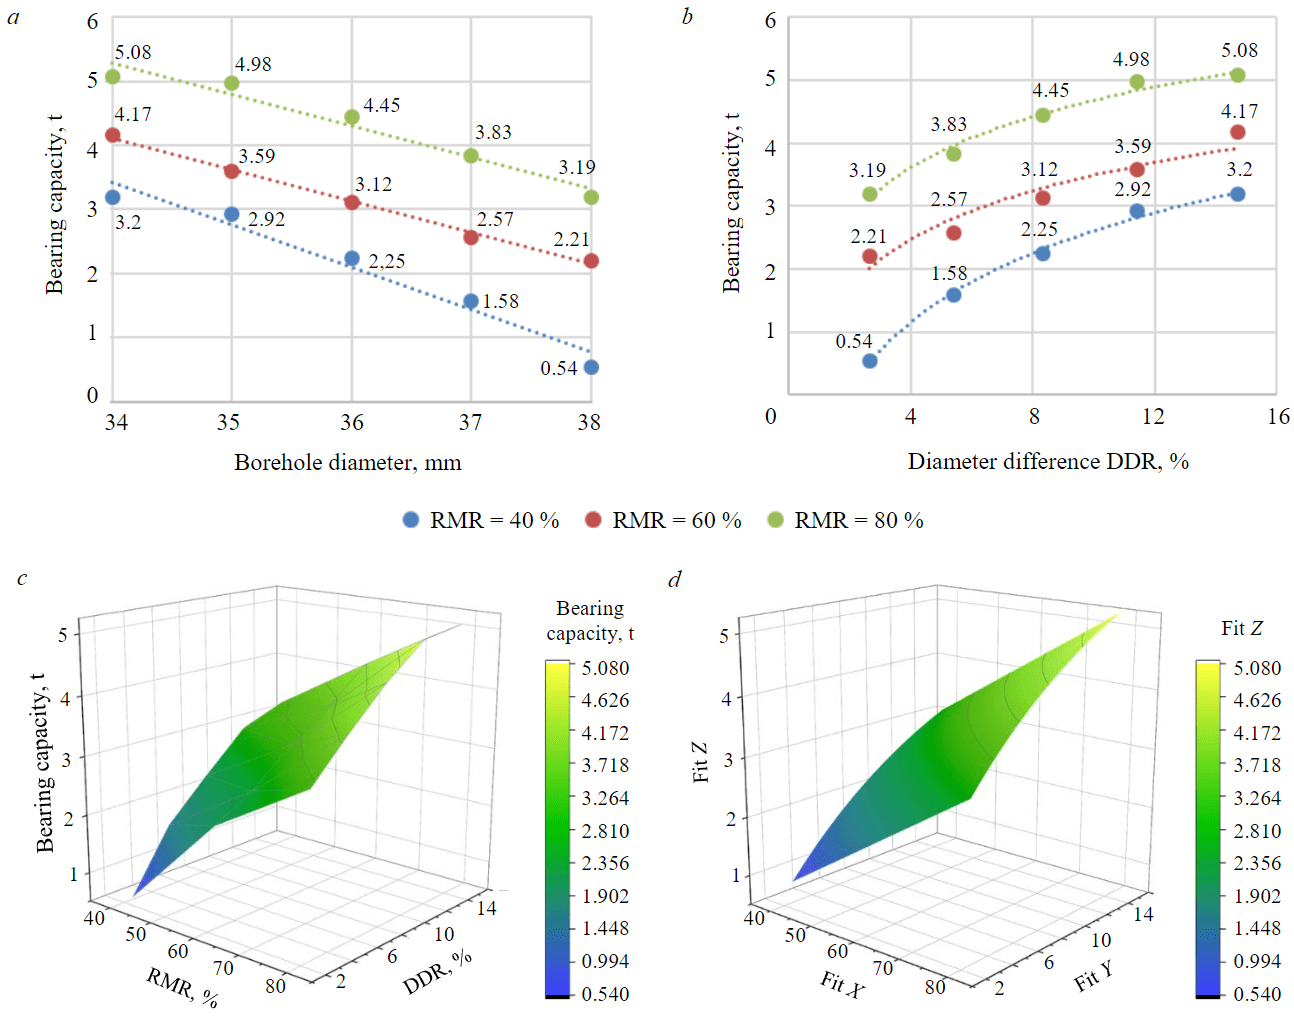
Fig.7. Variation of load-bearing capacity according to borehole diameter (a); variation of load-bearing capacity according to normalized ratio (b); 3D surface interpolation from pull-out measurement points (c); 3D surface plotting of fitted model (d)
The adjustment factor indicating the effect of borehole diameter on bolt load-bearing capacity is given as follows
Development of this empirical model facilitates evaluation of the sensitivity of bolt capacity to borehole size based on rock mass classification (Fig.7, d). Fitting load test data for different borehole diameters and rock mass ratings allows quantification of the borehole diameter effect for a given rock class.
Conclusion
This study provides an in-depth investigation into the key parameters governing the load-bearing capacity of friction rock bolts in underground excavations. Through an extensive experimental program analyzing the effects of rock mass rating, time, anisotropy, borehole diameter, surface roughness, and installation quality, empirical relationships have been developed to estimate bolt capacity.
Adjustment factors are proposed to quantify the relative effects of each variable on anchor capacity predictions. The following expression results from combining the previous parameters given to improve the assessment of friction bolt load-bearing capacity:
This experimental study derived several key insights into friction bolt behavior:
- RMR correlates exponentially (R2 = 0.98) with pull-out capacity, with a 73.7 % increase per 10 RMR points;
- time-dependent capacity enhancement ranged from 31 (low RMR) to 25 % (high RMR) over 3 years. Polynomial models (R2 = 0.96-0.97) characterize this temporal strengthening;
- increasing schistosity angle from 0 to 90° improved capacity by up to 59 %, captured via an exponential model (R2 = 0.94);
- reducing borehole diameter below bolt diameter exponentially increased frictional resistance, with a 14.7 % smaller hole diameter producing 98 % greater capacity;
- proposed adjustment factors quantify installation quality (0.5-1), surface roughness (0.9-1) and time effects (1-1.6) on capacity.
The suggested equation applies exclusively to frictional split-set bolts (6) measuring 39 mm in diameter and spanning 180 cm in length. For comprehensive generalization of equation to encompass all categories of frictional bolts, further extensive empirical investigations must be undertaken involving systematic variations in geometric dimensions (such as diameters and lengths). Quantification of the impacts of these modifications will enable derivation of a universal formula, potentially forming the subject matter of future studies.
The multivariate regression models enable reliable bolt capacity estimates (R2 = 0.92-0.98) based on specific site conditions. This represents a major advance over conventional empirical design methods. Field validation across more geologies, bolt types and excavation dimensions would further improve model accuracy. Overall, the quantitative insights deliver an important basis for optimizing underground support via friction bolt reinforcement.
References
- Gaudreau D. About the likely performance of ground support systems submitted to dynamic loading. Ground Support 2019: Proceedings of the Ninth International Symposium on Ground Support in Mining and Underground Construction, 23-25 October 2019, Sudbury, Canada. Perth: Australian Centre for Geomechanics, 2019, p. 213-230. DOI: 10.36487/ACG_rep/1925_13_Gaudreau
- Khaleghparast S., Aziz N., Remennikov A., Anzanpour S. An experimental study on shear behaviour of fully grouted rock bolt under static and dynamic loading conditions. Tunnelling and Underground Space Technology. 2023. Vol. 132. N 104915. DOI: 10.1016/j.tust.2022.104915
- Barnard C., Kallu R.R., Warren S., Thareja R. Inflatable rock bolt bond strength versus rock mass rating (RMR): A comparative analysis of pull-out testing data from underground mines in Nevada. International Journal of Mining Science and Technology. 2016. Vol. 26. Iss. 1, p. 19-22. DOI: 10.1016/j.ijmst.2015.11.004
- Dorion J.F. Corroded rock support issues: implementation of an investigation and rehabilitation program. Ground Support 2019: Proceedings of the Ninth International Symposium on Ground Support in Mining and Underground Construction, 23-25 October 2019, Sudbury, Canada. Perth: Australian Centre for Geomechanics, 2019, p. 401-414. DOI: 10.36487/ACG_rep/1925_27_Dorion
- Thenevin I., Blanco-Martín L., Hadj-Hassen F. et al. Laboratory pull-out tests on fully grouted rock bolts and cable bolts: Results and lessons learned. Journal of Rock Mechanics and Geotechnical Engineering. 2017. Vol. 9. Iss. 5, p. 843-855. DOI: 10.1016/j.jrmge.2017.04.005
- Tistel J., Grimstad G., Eiksund G. Testing and modeling of cyclically loaded rock anchors. Journal of Rock Mechanics and Geotechnical Engineering. 2017. Vol. 9. Iss. 6, p. 1010-1030. DOI: 10.1016/j.jrmge.2017.07.005
- Lama B., Momayez M. Review of Non-Destructive Methods for Rock Bolts Condition Evaluation. Mining. 2023. Vol. 3. Iss. 1, p. 106-120. DOI: 10.3390/mining3010007
- Aydan Ö., Ulusay R., Tokashiki N. A New Rock Mass Quality Rating System: Rock Mass Quality Rating (RMQR) and Its Application to the Estimation of Geomechanical Characteristics of Rock Masses. Rock Mechanics and Rock Engineering. 2014. Vol. 47. Iss. 4, p. 1255-1276. DOI: 10.1007/s00603-013-0462-z
- Komurlu E., Demir S. Length Effect on Load Bearing Capacities of Friction Rock Bolts. Periodica Polytechnica Civil Engineering. 2019. Vol. 63. N 3, p. 718-725. DOI: 10.3311/PPci.14081
- Showkati A., Salari-rad H., Aghchai M.H. Predicting long-term stability of tunnels considering rock mass weathering and deterioration of primary support. Tunnelling and Underground Space Technology. 2021. Vol. 107. N 103670. DOI: 10.1016/J.TUST.2020.103670
- Singh M., Viladkar M.N., Shekhawat P.S. et al. Bearing capacity of strip footings on jointed rock mass. Arabian Journal of Geosciences. 2022. Vol. 15. Iss. 19. N 1579. DOI: 10.1007/s12517-022-10841-9
- Maazallahi V., Majdi A. Directional rock mass rating (DRMR) for anisotropic rock mass characterization. Bulletin of Engineering Geology and the Environment. 2021. Vol. 80. Iss. 6, p. 4471-4499. DOI: 10.1007/s10064-021-02143-3
- Dimitrov I.M. Structural geological methods in the geotechnical practice – rock mass rating. Advantages and problems of the rating methods. Review of the Bulgarian Geological Society. 2020. Vol. 81. Part 1, p. 35-54 (in Bulgarian). DOI: 10.52215/rev.bgs.2020.81.1.3
- Peng Wang, Yuan Guo, Guangzhen Cui et al. Cumulative damage and bearing capacity attenuation law of anchorage structure interface under cyclic loading and unloading. Geomechanics and Geophysics for Geo-Energy and Geo-Resources. 2023. Vol. 9. Iss. 1. N 70. DOI: 10.1007/s40948-023-00612-5
- Eugie Kabwe, Yiming Wang. Review on Rockburst Theory and Types of Rock Support in Rockburst Prone Mines. Open Journal of Safety Science and Technology. 2015. Vol. 5. N 4, p. 104-121. DOI: 10.4236/ojsst.2015.54013
- Li C.C. Principles of rockbolting design. Journal of Rock Mechanics and Geotechnical Engineering. 2017. Vol. 9. Iss. 3, p. 396-414. DOI: 10.1016/j.jrmge.2017.04.002
- Lianyang Zhang. Chapter 5 – Rock Masses. Engineering Properties of Rocks. Butterworth-Heinemann, 2017, p. 137-171. DOI: 10.1016/B978-0-12-802833-9.00005-5
- Soufi A., Bahi L., Ouadif L., Kissai J.E. Correlation between Rock mass rating, Q-system and Rock mass index based on field data. 2nd International Congress on Materials & Structural Stability, 22-25 November 2017, Rabat, Morocco. MATEC Web of Conferences, 2018. Vol. 149. N 02030. DOI: 10.1051/matecconf/201814902030
- Ding Wang, Manchao He, Zhigang Tao. Deformation-softening behaviors of high-strength and high-toughness steels used for rock bolts. Journal of Rock Mechanics and Geotechnical Engineering. 2022. Vol. 14. Iss. 6, p. 1872-1884. DOI: 10.1016/j.jrmge.2021.12.026
- Bo Wang, Xinxin Guo, Hui Jin et al. Experimental study on degradation behaviors of rock bolt under the coupled effect of stress and corrosion. Construction and Building Materials. 2019. Vol. 214, p. 37-48. DOI: 10.1016/j.conbuildmat.2019.03.335
- Yunpeng Hu, Mingming Zheng, Wenkai Feng et al. Interface bond degradation and damage characteristics of full-length grouted rock bolt in tunnels with high temperature. Journal of Rock Mechanics and Geotechnical Engineering. 2023. Vol. 15. Iss. 10, p. 2639-2657. DOI: 10.1016/j.jrmge.2023.04.018
- Shui-Hua Jiang, Dian-Qing Li, Li-Min Zhang, Chuang-Bing Zhou. Time-dependent system reliability of anchored rock slopes considering rock bolt corrosion effect. Engineering Geology. 2014. Vol. 175, p. 1-8. DOI: 10.1016/j.enggeo.2014.03.011
- Skipochka S., Krukovskyi O., Serhiienko V., Krasovskyi I. Physical modeling of the rock bolt interaction with the rock massif. Ukrainian School of Mining Engineering – 2019, 3-7 September 2019, Berdiansk, Ukraine. E3S Web of Conferences, 2019. Vol. 123. N 01002. DOI: 10.1051/e3sconf/201912301002
- Soufi A., Bahi L., Ouadif L. Adjusted anisotropic strength model for meta-siltstones and prediction of UCS from indirect tensile tests. International Journal of Civil Engineering and Technology. 2018. Vol. 9. Iss. 7, p. 598-611.
- Meng-Chia Weng, Jin-Hong Li, Cheng-Han Lin, Chu-Tsen Liao. Measuring Foliation Tensile Strength of Metamorphic Rock by Using Pull-Off Test. Geotechnical Testing Journal. 2018. Vol. 41. Iss. 1, p. 132-140. DOI: 10.1520/GTJ20170078
- Zhigao Liu, Shoubao Zhang, Weixiang Meng, Zhiliu Wang. Prediction of bolt supporting the controlling influence angle based on a synthetic weight factor. PloS One. 2022. Vol. 17. N 10. N e0276536. DOI: 10.1371/journal.pone.0276536
- Solodov N.V., Vodyakhin N.V. Evaluation of the Load-Bearing Capacity of the Combined Bolt-Welded Joint. Innovations and Technologies in Construction. Selected Papers of BUILDINTECH BIT 2021, 9-10 March 2021, Belgorod, Russia. Cham: Springer, 2021. Vol. 151, p. 174-180. DOI: 10.1007/978-3-030-72910-3_25
- Vangla P., Wala B.A., Gayathri V.L., Frost J.D. Snakeskin-inspired patterns for frictional anisotropic behaviour of split set rock bolts. Géotechnique Letters. 2022. Vol. 12. Iss. 2, p. 95-100. DOI: 10.1680/jgele.21.00076
- Xufeng Liu, Xia-Ting Feng, Yangyi Zhou, Mostafa Sharifzadeh. Influences of foliation orientation and lateral stress difference on the deformation and fracturing of a thin-layered rock around underground excavations: insight from multi-axial loading tests. Bulletin of Engineering Geology and the Environment. 2022. Vol. 81. Iss. 5. N 171. DOI: 10.1007/s10064-022-02648-5
- Antonova A., Eik M., Puttonen J. Importance of the surface roughness of a steel fibre pulled out from cement paste by slowly increasing load cycles. Cement and Concrete Composites. 2022. Vol. 134. N 104799. DOI: 10.1016/j.cemconcomp.2022.104799
- Spyridis P., Dreier J., Mellios N. et al. Multilateral Assessment of Anchorage Bond Characteristics in Steel Fibre Reinforced Concrete. Polymers. 2022. Vol. 14. Iss. 7. N 1411. DOI: 10.3390/polym14071411
- Viljoen B.N., Murphy B.A. Ground support installation quality controls and possible pitfalls: a case study from a critical fall of ground contract rehabilitation project. Ground Support 2019: Proceedings of the Ninth International Symposium on Ground Support in Mining and Underground Construction, 23-25 October 2019, Sudbury, Canada. Perth: Australian Centre for Geomechanics, 2019, p. 581-592. DOI: 10.36487/ACG_rep/1925_42_Viljoen
- Nicholson L., Hadjigeorgiou J. Interpreting the results of in situ pull tests on Friction Rock Stabilizers (FRS). Mining Technology. 2018. Vol. 127. Iss. 1, p. 12-25. DOI: 10.1080/14749009.2017.1296669
- Kim H., Rehman H., Ali W. et al. Classification of Factors Affecting the Performance of Fully Grouted Rock Bolts with Empirical Classification Systems. Applied Sciences. 2019. Vol. 9. Iss. 22. N 4781. DOI: 10.3390/app9224781
- Jianhang Chen, Xin Dai, Junwen Zhang. Analytical Studying the Confining Medium Diameter Impact on Load-Carrying Capacity of Rock Bolts. Mathematical Problems in Engineering. 2021. Vol. 2021. N 6680886. DOI: 10.1155/2021/6680886
- Yanchun Yin, Hongjie Zhou, Yubao Zhang et al. Anchorage weakening effect of coal roadway sidewall with different destressing borehole diameters. Energy Science & Engineering. 2023. Vol. 11. Iss. 3, p. 1325-1335. DOI: 10.1002/ese3.1394