Predictive assessment of ore dilution in mining thin steeply dipping deposits by a system of sublevel drifts
- 1 — Ph.D. Head of Department Abylkas Saginov Karaganda Technical University ▪ Orcid ▪ Scopus ▪ ResearcherID
- 2 — Ph.D. Associate Professor Abylkas Saginov Karaganda Technical University ▪ Orcid
- 3 — Ph.D. Senior Lecturer Abylkas Saginov Karaganda Technical University ▪ Orcid ▪ Scopus ▪ ResearcherID
Abstract
The purpose of research is the study of stress-strain state of marginal rock mass around the stope and predictive assessment of ore dilution with regard for changes in ore body thickness in mining thin ore deposits on the example of the Zholymbet mine. Study of the specific features of the stress-strain state development was accomplished applying the methodology based on numerical research methods taking into account the geological strength index (GSI) which allows considering the structural features of rocks, fracturing, lithology, water content and other strength indicators, due to which there is a correct transition from the rock sample strength to the rock mass strength. The results of numerical analysis of the stress-strain state of the marginal part of the rock mass using the finite element method after the Hoek – Brown strength criterion made it possible to assess the geomechanical state in the marginal mass provided there are changes in ore body thickness and to predict the volume of ore dilution. It was ascertained that when mining thin ore deposits, the predicted value of ore dilution is influenced by the ore body thickness and the GSI. The dependence of changes in ore dilution values on the GSI was recorded taking into account changes in ore body thickness from 1 to 3 m. Analysis of the research results showed that the predicted dimensions of rock failure zone around the stopes are quite large, due to which the indicators of the estimated ore dilution are not attained. There is a need to reduce the seismic impact of the blasting force on the marginal rock mass and update the blasting chart.
The research was funded by the Science Committee of the Ministry of Science and Higher Education of the Republic of Kazakhstan (grant AP13268891).
Introduction
In the world practice, mining of thin ore deposits is increasingly accomplished by a system of sublevel drifts [1-3]. The main advantage of such mining system is its high productivity, and among the main disadvantages are high losses and ore dilution. A high level of ore dilution leads to a growing cost of ore transportation and processing, and the cost of the mineral increases accordingly [4-6]. Research in the course of this work is aimed at establishing the dependence of ore dilution index on rating assessment values of the rock mass.
Various sets of measures and recommendations are used to significantly reduce ore dilution. They are associated with choice of the mining system in accordance with geological structure of the deposit and its stripping method, improvement of mining technology, changing the main parameters of mining systems, introducing additional elements to the technology used, separate mining of part of reserves, etc. There is a large number of methods for determining and accounting for ore dilution. Over the past decades, researchers such as S.Korigov [7], H.D.Jang [8], I.Masoumi [9], E.Villaescusa [10], A.Papaioanou [11], M.Marinin [12], S.N.Fomin [13], V.M.Lizunkin [14], I.N.Savich [15], S.M.Tkach [16], S.A.Batugin [17], I.V.Sokolov [18], A.M.Pavlov [19], M.Mohseni [20], E.Topal [21], M.A.Hefni [22, 23], D.P.Cordova [24], T.R.Câmara [25], and others, made a great contribution to the development and improvement of the methodology for calculating ore dilution.
The problem of ore dilution in mining of thin deposits is urgent. A specific feature of the technology for mining thin deposits by a system of sublevel drifts is the above-plan ore dilution due to entrapment of adjacent host rock strata. For example, in the course of stoping at the Zholymbet mine, over-plan ore dilution occurs – the actual indicators reach 70-75 % whereas the approved design values dot not exceed 38 %. Based on the mining and geological occurrence conditions of ore deposits and capabilities of the mine, a system for mining sublevel drifts was adopted.
The purpose of the study is predictive assessment of primary ore dilution based on the study of structural features of the rock mass taking into account changes in ore body thickness during mining of thin ore deposits at the Zholymbet mine.
At the Zholymbet deposit, two gold-bearing areas are geographically separated from each other: Central and Southern. The Central area has the largest reserves, is most productive and offers a high potential. Two morphological types of ore bodies were identified: gold-bearing quartz veins and stockwork zones. The length of veins along the strike is 100-150 m, downdip to 100-150 m, thickness of veins ranges from 0.5 to 3.0 m, dip angle usually steep varying from 45 to 80°. Hardness factor f after M.M.Protodyakonov for quartz veins is 12-15, for stockwork ores – 10-15, and host rocks – 10-16. As for drillability, the rocks belong to category XVI. Volumetric weight of ores and rocks is on average 2.7 t/m3.
Methods
Ore dilution level is determined by the morphological structure of ore deposits, the applied mining system, ore breaking parameters, structural and strength properties of the rock mass, the impact of blasting force on host rocks, the use of artificial support of mined-out area, natural stress field of rock mass, geometric characteristics of the vein, thickness and dip of the ore body [26].
The above indicators are classified [8] according to characteristics of drilling and blasting operations; design factors of the stoping face; mining and geological factors; human factors (mistakes of miners during drilling and blasting operations, incorrect prediction of the ore body outlines by mine surveyors, etc.).
In world practice, there are several methods for determining ore dilution. Two of them, according to research by R.C.Pakalnis [27], are most common:
- Ore dilution = Tons of rock mined × 100 / Tons of ore mined.
- Ore dilution = Tons of rock mined × 100 / (Tons of ore mined + Tons of rock mined).
The term “rock” refers to external dilution or unscheduled diluting rock mined, and the term “ore” refers to the material estimated for mining, i.e. drilled and blasted. L.M.Clark and R.C.Pakalnis proceeding from the volume of overbreak and dimensions of the working face, determined the Equivalent Linear Overbreak Slough (ELOS), which is an indirect quantitative indicator of ore dilution [24, 28]. ELOS and ore dilution indicators are determined as follows:
where Voverbr – is the volume of caved rock mass, m3; Sstope – surface area of the stope, m2;
rd – ore dilution, %; m – thickness of ore body, m.
J.G.Henning and H.S.Mitri [24] developed a method similar to ELOS for determining ore dilution based on a 3D numerical model, where the dilution boundary is represented by an isoline of the minimum principal stress equal to zero (σ3 = 0 MPa). The term “ore dilution density” (DD) was used. It is determined by the ratio of the unscheduled volume of dilution to the stope area,
where Vunscg.r – is the unscheduled volume of dilution, m3.
An important factor to consider in managing ore dilution is an adequate design of mine operation as regards rock mass stability. Host rock caving from the roof and sides of workings associated with poor stability conditions of the mass are not only a threat to the overall safety of miners, but also contribute to an increasing volume of ore dilution. To reduce dilution, a series of studies of the structural and strength properties of rocks, stress-strain state of the mass, seismic impact of drilling and blasting, etc. are required.
Among the traditional tools for assessing and managing the rock mass condition is the empirical stability diagram drawn by K.E.Mathews [29], which proved to be useful for an early assessment of the stability of an open stope area. Graphical stability method by K.E.Mathews is based on the calculation and mapping of two values:
- stability index N characterizing the ability of the rock mass to remain unaltered under the given stress state, structural pattern of disturbances in the mass and orientation of the stoping area;
- hydraulic radius which accounts for the geometric interdependence of outcrop dimensions,
where Pstope – is the detection perimeter, m.
Stability indicator is calculated from the formula
where RQD – is rock quality [30]; Jn – number of fracture systems; Jr – fracture surface roughness; Ja – alteration (adhesion) of fractures; A – ratio of strength to stress state of rocks; B – fracture orientation; C – dip (inclination) angle of the outcrop.
Over time, for making the stability diagram by K.E.Mathews more reliable, it was updated with major alterations and modified by researchers such as Y.Potvin [31], S.D.Nickson [32], C.Mawdesley, R.Trueman, W.Whiten [33], A.Papaioanou [11]. Thanks to these modifications, it became possible to determine the volume of ore dilution using stability diagrams. The papers by A.Papaioanou and F.Suorineni [11] deserve special attention, since the generalized schedule which they developed for determining ore dilution on the basis of the rock mass stability is applicable to all ore deposits regardless of the ore body thickness.
A.Delentas [34] gave predictive assessments of the marginal mass failure and ore dilution using numerical simulation. Software for numerical simulation allows predicting the stress-strain state of the rock mass outside the stope, which could potentially collapse. In the conditions where ore and rock have the same specific gravity, ore dilution factor is calculated from the equation
where Koverbr – is failure factor; Kr – dilution factor; Soverbr.z – area of collapse zone, m2.
An underground mining method was adopted at the Zholymbet deposit with levels of 60 m and the use of inclined ramps. Quartz veins are mined by a system of sublevel drifts. With such a system, the vein is divided along the strike and downdip into blocks with the following parameters: length of block along the strike of the vein is 120 m, height of block along the strike through the entire height of the level downdip the ore body with breaking-down into sublevels is 15 m. Mining is carried out from the flank to the centre of the vein up-dip in descending order. Schematic diagram of the mining system is shown in Fig.1.
Stoping of ore in the block on sublevels begins with driving drill haulage drifts of cut raises with cutting of slots on them. Ore mass is broken onto a cut-out raise driven earlier (compensation space). Stope advancing step in the upper sublevels in relation to the lower ones is 20-30 m. The scheme and parameters of ore breaking are shown in Fig.2. Main indicators of longhole ore stoping are: type of explosive used – granulite AS-8; initiation method – by DShE (detonating cord); specific consumption of explosive – 1.75 kg/m3; hole diameter – 130 mm; burden of hole – 1.6 m; distance between the ends of holes is 1.75 m.
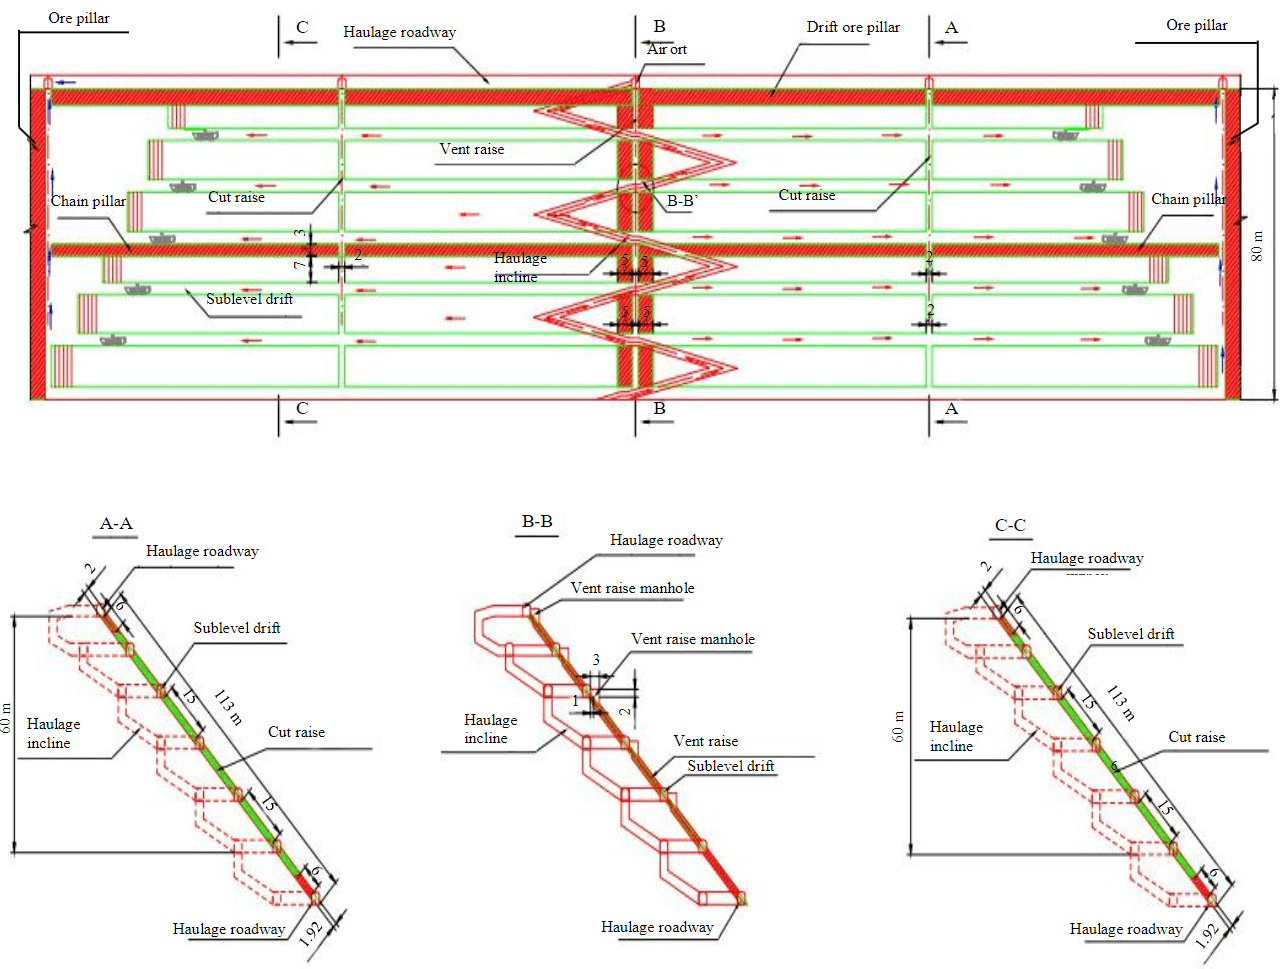
Fig.1. Schematic diagram of mining system

Fig.2. Scheme of borehole ore breaking
1 – actual mine workings 800 m; 2 – projected drill rings; 3 – ore contour; 1-5 – well numbers in a row
When breaking thin ore bodies, numerical simulation of the stress-strain state of the rock mass was performed for a predictive assessment of ore dilution. Key source data are tensile strength of rock samples for uniaxial compression (σcompr), ore body thickness (m) and the Geological Strength Index (GSI) of rocks [35, 36], which makes it possible to take into account rock fracturing, water content, lithology and other strength indicators, due to which the transition from rock sample strength to the strength of the rock mass occurs. The Hoek – Brown criterion [37] was chosen as the failure criterion. Numerical simulation to determine possible zones of rock failure was performed using the finite element method [38]. As a result of simulation, areas of possible failure zones around the stope are determined. Areas of marginal mass zones that are expected to cave are calculated using AutoCAD software. This software allows a quantitative measurement of areas of possible caving zones. Further, ore dilution is calculated from formula (6).
Calculation of predicted values of ore dilution using this procedure is accomplished based on ground survey which includes field studies to determine the GSI and numerical simulation of geomechanical processes occurring in marginal mass. This procedure is most applicable to the conditions of the investigated body, since at the Zholymbet mine ore and rock have on average the same specific gravity. Reliability of numerical simulation results mainly depends on the accuracy of the input data. Preparation of source data for numerical analysis was accomplished using “RSData” software which allows determining the strength parameters of the rock mass based on the Hoek – Brown [37] and Mohr – Coulomb [39] failure criteria.
GSI is a vital component of the source data. The GSI parameter is the result of research by E.Hoek and E.T.Brown on the structural features and properties of rocks. The classification is constantly updated depending on the needs of designing practice. In one of the latest studies, E.Hoek and E.T.Brown proposed to determine the GSI index as follows [40]:
where JCond89 – is the parameter of rating classification of rock fracturing determined in accordance with the methodology of the International Society of Rock Mechanics (ISRM) [41];
JA4 – indicator of the quality of contact along fractures: JA41 – roughness, JA42 – length, JA43 – opening, JA44 – filling, JA45 – weathering of fracture walls.
When assessing the geomechanical state of the rock mass, data from the Geological Survey of the Zholymbet mine were used [42]. According to characteristics of the core from these boreholes, rocks were divided into three domains:
- weathered rocks to a depth of 30-40 m, RQD = 12-34 (rock category “weak”);
- slightly weathered silty sandstones, silicified with a massive texture, RQD = 50-72 (rock category “medium”);
- gabbro diorites greenish-grey, dense, massive, RQD = 72-78 (rock category “strong”) [42].
At the Zholymbet mine, thin ore veins occur at a depth of 800 m. Thus, for determining the GSI indices, RQD values are taken from 50 to 80. As a result of research at the Zholymbet mine during fracture surveying, rating indicators that make up the indicator of the quality of contact along fractures according to the ISRM method [41] were determined. Point values are given in Table 1, where JCond89 = JA4 = JA41 + JA42 + JA43 + JA44 + JA45 = = 5 + 2 + 1 + 2 + 5 = 15.
Table 1
Rating assessments of geological characteristics of fracturing for conditions of the Zholymbet deposit
|
Parameter |
Value intervals |
||||
|
Roughness |
Very rough |
Rough |
Slightly rough |
Smooth surfaces |
Slip marks |
|
JA41 |
6 |
5 |
3 |
1 |
0 |
|
Length |
< 1 m |
1-3 m |
3-10 m |
10-20 m |
> 20 m |
|
JA42 |
6 |
4 |
2 |
1 |
0 |
|
Opening |
none |
< 0.1 mm |
0.1-1.0 mm |
1-5 mm |
> 5 mm |
|
JA43 |
6 |
5 |
4 |
1 |
0 |
|
Filler |
None |
Solid filler < 5 mm |
Solid filler > 5 mm |
Soft filler < 5 mm |
Soft filler > 5 mm |
|
JA44 |
6 |
4 |
2 |
2 |
0 |
|
Weathered walls |
None |
Slightly weathered |
Moderately weathered |
Strongly weathered |
Crushed |
|
JA45 |
6 |
5 |
3 |
1 |
0 |
After a series of ground surveys, geological strength indices were determined from formula (7) for different RQD values, and data for simulation were prepared (Table 2).
Table 2
Source data for numerical simulation
|
Rock type |
RQD |
GSI |
Rock strength σci, MPa |
Volumetric weight of rock |
Rock mass disturbance by blasting D |
Parameter of undisturbed rock mi |
Young’s modulus |
|
Silty sandstones |
50 |
48 |
82 |
2.65 |
0.8 |
17 |
2,800 |
|
Silty sandstones |
55 |
50 |
82 |
2.65 |
0.8 |
17 |
2,800 |
|
Silty sandstones |
60 |
53 |
82 |
2.65 |
0.8 |
17 |
2,800 |
|
Silty sandstones |
65 |
55 |
82 |
2.65 |
0.8 |
17 |
2,800 |
|
Gabbro diorites |
70 |
58 |
103 |
2.76 |
0.8 |
25 |
3,000 |
|
Gabbro diorites |
75 |
60 |
103 |
2.76 |
0.8 |
25 |
3,000 |
|
Gabbro diorites |
80 |
63 |
103 |
2.76 |
0.8 |
25 |
3,000 |
For numerical analysis of the stress-strain state of marginal mass and predictive assessment of ore dilution, 21 models were implemented taking into account changes in the GSI (48, 50, 53, 55, 58, 60, 63) and ore body thickness from 1 to 3 m. Numerical analysis of the stress-strain state of the mass was accomplished in accordance with actual mining level and the following stope parameters: mining depth 800 m; stope height 45 m; sublevel height 15 m; width 1-3 m; ore body occurrence angle 75°. The main predictive indicator for assessing the stability and analysing the stress-strain state of the rock mass around the stope is the Strength Factor – ratio of possible rock strength to induced stress at the considered point.
Discussion of results
It is not possible to evaluate the results of numerical simulation of 21 versions of models, so it is advisable to analyse the stress-strain state of the mass around the stope and give a predictive assessment of ore dilution for the minimum and maximum GSI values. Further, the results of numerical simulation will be presented at the GSI = 48 and 63 for ore body thickness from 1 to 3 m.
When mining thin deposits at the Zholymbet mine, the lag of the underlying sublevel from the overlying one reaches 20-30 m. Breaking of the overlying sublevel is accomplished by blasting the blasthole rings and loading the broken rock mass using self-propelled equipment. The stoping space remains open, i.e. there is no backfilling. Consequently, in numerical simulation and predictive assessment of ore dilution of the underlying (unmined) sublevel, the influence of the stoping space of the overlying mined sublevel is taken into account (Fig.3).
Analysis of the distribution pattern of isolines based on the strength factor showed that at the GSI = 48 (siltstones) there is a uniform distribution of the safety factor along the contour of the stope, minor deformations along the roof are recorded as well as a redistribution of load on the sides of the stope, caving under its own weight is predicted due to structural weakening of the mass, weak adhesion of rocks to each other caused by blasting, and further rock mass caving is possible. Area of a possible caving zone varies depending on ore body thickness – from 85.2 m2 at m = 1 m to 77.8 m2 at m = 3 m, correspondingly.
At the GSI = 63 (gabbro diorites), uneven distributions of safety margin isolines are recorded, and the contours differ from the previous version; possible zones of rock mass failure are predicted in the sides of stopes. Areas of possible caving zones vary depending on ore body thickness – from 29.1 m2 at m = 1 m to 25.1 m2 at m = 3 m, respectively. Compared to the previous case, areas of possible caving zones are reduced three-fold. Thus, at the GSI = 63, there is an increase in the safety factor and a decrease in the volume and area of possible caving around the stope. This is due to changes in strength properties and structural features of the rock mass.
The experience of mining thin deposits at the Zholymbet and Akbakai mines shows that the dimensions of possible failure zones around the stope are not strongly affected by the thickness of ore bodies [43]. Presumably, the size of the failure zone depends on parameters of drilling and blasting operations and seismic blasting force on marginal rock mass.
As a result of simulation, areas of possible failure zones around the stope were determined for all model versions (Fig.4). Using data of numerical simulation on the area of a possible caving zone around the stope the predicted values of ore dilution were determined from formula (6) for each model under study taking into account changes in the GSI (48, 50, 53, 55, 58, 60, 63) and ore body thickness from 1 to 3 m (Table 3).
Fig.5 shows the summary and comparative diagrams of changes in the predicted values of ore dilution depending on the GSI when mining thin ore veins. According to predictive calculations, when stoping 1 m thick quartz veins, the predicted ore dilution indicators average 78-84 %, while the actual dilution indicators when mining ore bodies of the same thickness reach 65-70 %.
Table 3
Predicted values of ore dilution in thin deposits at the Zholymbet mine
|
GSI |
Ore body thickness, m |
|||||
|
1 |
2 |
3 |
||||
|
Area of possible caving zone, m2 |
Dilution, % |
Area of possible caving zone, m2 |
Dilution, % |
Area of possible caving zone, m2 |
Dilution, % |
|
|
63 |
29.1 |
70.6 |
29.3 |
51.7 |
25.1 |
40.1 |
|
60 |
36.2 |
74.3 |
33.9 |
55.2 |
30.2 |
44.3 |
|
58 |
46.2 |
78.1 |
41.6 |
58.6 |
39.4 |
48.4 |
|
55 |
59.7 |
82.3 |
54.4 |
65.4 |
51.7 |
56.5 |
|
53 |
70.8 |
84.5 |
66.5 |
70.1 |
63.7 |
60.2 |
|
50 |
80.1 |
86.8 |
76.1 |
73.5 |
72.7 |
65.8 |
|
48 |
85.2 |
87.5 |
81.6 |
74.9 |
77.8 |
67.3 |
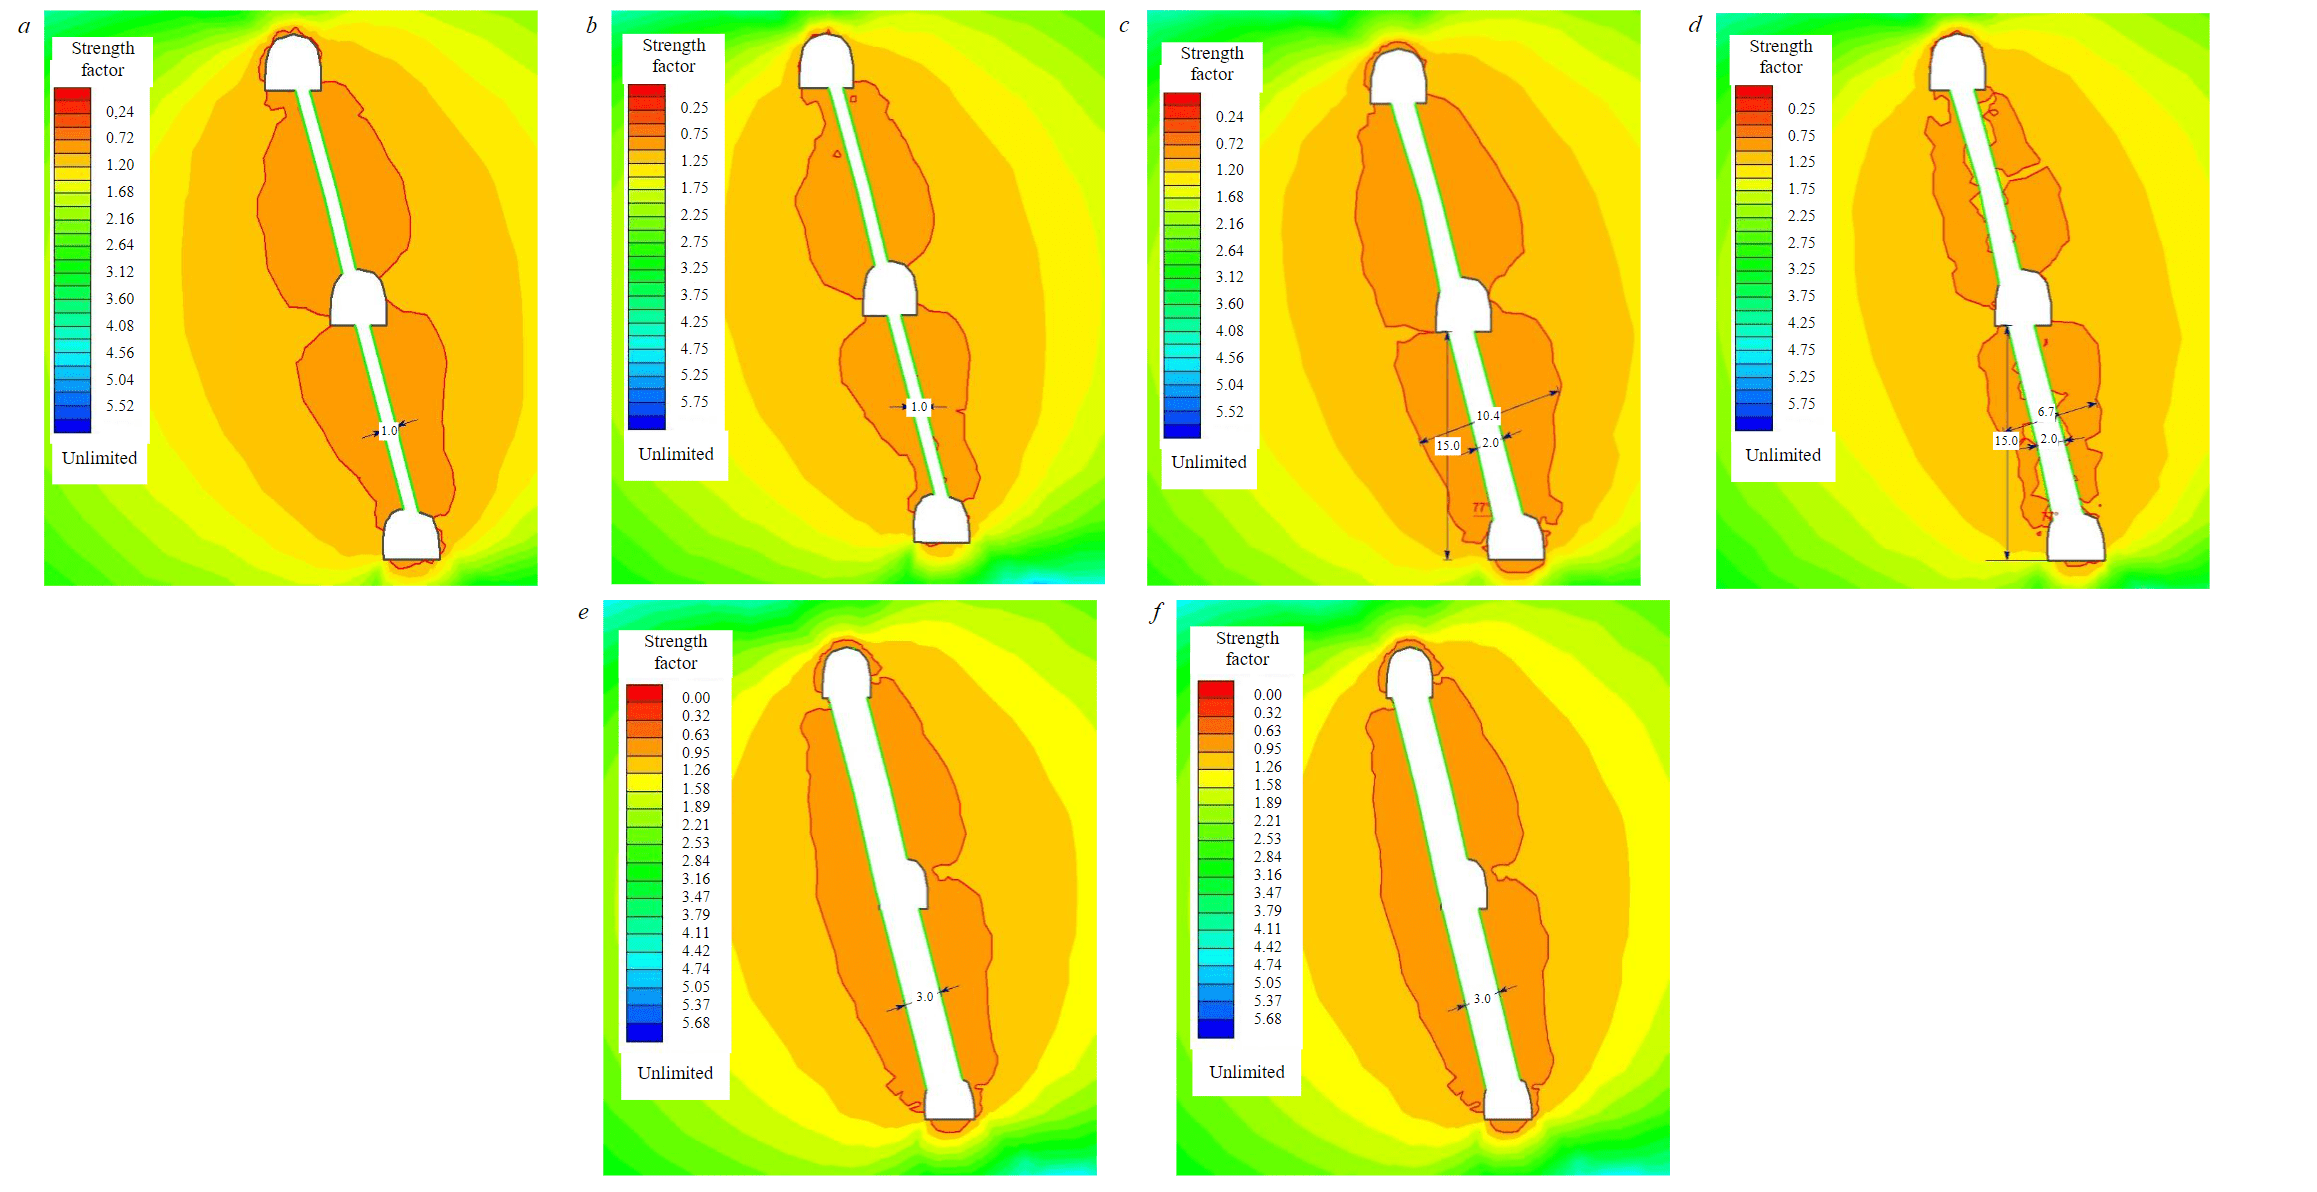
Fig.3. Areas of possible failure zones at GSI = 48 (a, c, e) and GSI = 63 (b, d, f): a, b – ore body thickness 1 m; c, d – 2 m; e, f – 3 m

Fig.4. Diagram of changes in thickness of a possible caving zone depending on GSI
1 – thickness 1 m; 2 – 2 m; 3 – 3 m
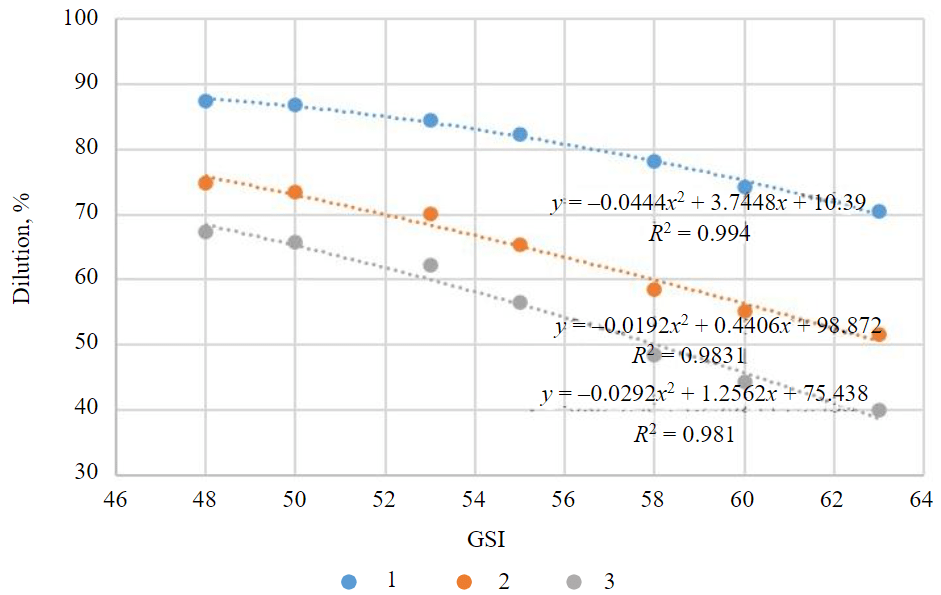
Fig.5. Diagram of changes in predicted ore dilution values depending on GSI
1 – thickness 1 m; 2 – 2 m; 3 – 3 m
Results of the study show that the predicted values of ore dilution are influenced by ore body thickness and the geological strength index, which takes into account the geological features of the rock mass, its structure and fracturing. The dependence of ore dilution index on the GSI index was recorded at different thicknesses of the ore body.
It should be noted that in numerical analysis, the seismic influence of blasting force on marginal rock mass was not taken into account in detail. However, when performing numerical simulation, the indicator of rock disturbance by blasting D was applied; its value corresponded to blasting of good quality. In future, it is planned to determine the pattern of changes in the indicator of rock mass disturbance by blasting depending on the category of rock stability. This will allow adjusting the geomechanical model in numerical analysis, assessing the geomechanical state more correctly and predicting ore dilution when mining thin ore bodies.
Conclusion
General review of the methods for determining and accounting for ore dilution showed that in foreign practice, the calculation of ore dilution is based on the studies of the stress-strain state of the rock mass and a predictive assessment of the marginal mass caving using rating classifications of rocks and numerical simulation methods. A comparison of the predicted values of ore dilution with actual indicators confirms a good convergence of the research results, which was about 83 %.
Based on results of the accomplished numerical analysis, it can be assumed that in mining thin deposits, the predicted ore dilution values are influenced by the ore body thickness and the GSI. Analysis of the research results showed that with a decreasing GSI index, there is a decrease in the safety margin and an increase in the area of possible caving around the stope. Accordingly, the volume of ore dilution increases due to entrapment of adjacent host rock strata. Further direction of research is to improve the methodology for determining the parameters of drilling and blasting operations taking into account the GSI rating for the conditions of mining thin ore bodies by systems with caving of ore and host rocks.
References
- Chilala G.C., de Assuncao J., Harris R., Stephenson R.M. Initial effects of improved drill and blast practices on stope stability at Acacia’s Bulyanhulu Mine. Underground Design Methods 2015: Proceedings of the International Seminar on Design Methods in Underground Mining, 17-19 November 2015, Perth, Australia. Australian Centre for Geomechanics, 2015, p. 241-254. DOI: 10.36487/ACG_rep/1511_12_Chilala
- Purwanto, Shimada H., Sasaoka T. et al. Influence of Stope Design on Stability of Hanging Wall Decline in Cibaliung Underground Gold Mine. International Journal of Geosciences. 2013. Vol. 4. N 10A, p. 1-8. DOI: 10.4236/ijg.2013.410A001
- Cai S., Lyu W., Wu D., Yang P. Mining method optimisation of Bayi gold mine based on the value engineering principle. Underground Mining Technology 2017: Proceedings of the First International Conference on Underground Mining Technology, 11-13 October 2017, Sudbury, ON, Canada. Australian Centre for Geomechanics, 2017, p. 511-521. DOI: 10.36487/ACG_rep/1710_41_Cai
- Wu-sheng Huang, Si-jing Cai, Di Wu et al. Stability Assessment of Underground Mined-Out Areas in a Gold Mine Based on Complex System Theory. Geotechnical and Geological Engineering. 2015. Vol. 33. Iss. 5, p. 1295-1305. DOI: 10.1007/s10706-015-9901-9
- Dorval A. Narrow vein mining using sublevel method at Red Lake Gold Mine – Campbell Complex. 36e Session d’étude sur les techniques de sautage, 21-22 November 2013, Québec, QC, Canada. 23 p.
- An Long,Wang Ri-dong,Hou Peng-yuan,Liang Rui-yu. Caving Mining of Steeply Inclined Narrow Veins and Supporting Mechanism of Caved Rock. Journal of Northeastern University (Natural Science). 2019. Vol. 40. Iss. 2, p. 278-283. DOI: 10.12068/j.issn.1005-3026.2019.02.024
- Korigov S., Adoko A.C., Sengani F. Unplanned Dilution Prediction in Open Stope Mining: Developing New Design Charts Using Artificial Neural Network Classifier. Journal of Sustainable Mining. 2022. Vol. 21. Iss. 2, p. 157-168. DOI: 10.46873/2300-3960.1356
- Hyong Doo Jang. Unplanned Dilution and Ore-Loss Optimisation in Underground Mines via Cooperative Neuro-Fuzzy Network: This thesis is presented for the Degree of Doctor of Philosophy of Curtin University. Perth: Western Australia School of Mines, 2014. 170 р.
- Masoumi I., Kamali Gh.R., Asghari O. Assessment of an ore body internal dilution based on multivariate geostatistical simulation using exploratory drill hole data. Journal of Mining and Environment. 2019. Vol. 10. Iss. 1, p. 271-286. DOI: 10.22044/jme.2019.7622.1618
- Villaescusa E. Geotechnical Design for Sublevel Open Stoping. Boca Raton: CRC Press, 2014. 541 p. DOI: 10.1201/b16702
- Papaioanou A., Suorineni F.T. Development of a generalised dilution-based stability graph for open stope design. Transations of the Institutions of Mining and Metallurgy, Section A: Mining Technology. 2016. Vol. 125. Iss. 2, p. 121-128. DOI: 10.1080/14749009.2015.1131940
- Marinin M., Marinina O., Wolniak R. Assessing of Losses and Dilution Impact on the Cost Chain: Case Study of Gold Ore Deposits. Sustainability. 2021. Vol. 13. Iss. 7. N 3830. DOI: 10.3390/su13073830
- Fomin S.I., Kava P.B., Marinin M.A. Open cast geological conditions analysis and the mining units formation in ore losses and dilution determining. Journal of Mining Institute. 2014. Vol. 207, p. 74-77 (in Russian).
- Lizunkin V.M., Lizunkin M.V., Rabolt A.N., Gurov S.G. Pilot test results of technology with widening stopes in mining thin gently dipping and sheetlike ore bodies. Gornyi Zhurnal. 2019. N 1, p. 37-40 (in Russian). DOI: 10.17580/gzh.2019.01.08
- Savich I.N. Widespread in foreign and domestic practice was layered-end way to release sublevel ore. Mining informational and analytical bulletin. 2014. N S1, p. 366-373 (in Russian).
- Tkach S.M., Batugin S.A., Barakaeva I.D. Objective assessment of ore dilution – A promising way of enhancing mineral resource potential. Gornyi Zhurnal. 2016. N 1, р. 37-40. DOI: 10.17580/gzh.2016.01.08
- Batugin S.A., Tkach S.M., Barakaeva I.D. Development of the methodological basis of the definitions and accounting dilution of ore. Mining informational and analytical bulletin. 2012. N 9, p. 312-319 (in Russian).
- Sokolov I.V., Antipin Yu.G., Nikitin I.V. Methodology of choosing the underground geotechnology in combined mining of ore deposits. Ekaterinburg: Ural Federal University named after the first President of Russia B.N.Yeltsin, 2021, р. 340 (in Russian) DOI: 10.25635/b6795-6297-2078-t
- Pavlov A.M., Vasiliev D.S. Improving underground mining technology of steeply dipping thin ore bodies of konevinskoe gold deposit. Proceedings of the Siberian Department of the Section of Earth Sciences RANS. Geology, Exploration and Development of Mineral Deposits. 2017. Vol. 40. N 2, p. 88-94.
- Mohseni M., Ataei M., Khaloo Kakaie R. A new classification system for evaluation and prediction of unplanned dilution in cut-and-fill stoping method. Journal of Mining and Environment. 2018. Vol. 9. Iss. 4, p. 873-892. DOI: 10.22044/jme.2018.6483.1468
- Jang H., Topal E., Kawamura Y. Unplanned dilution and ore loss prediction in longhole stoping mines via multiple regression and artificial neural network analyses. Journal of the Southern African Institute of Mining and Metallurgy. 2015. Vol. 115. N 5, p. 449-456. DOI: 10.17159/2411-9717/2015/v115n5a13
- Abdellah W.R.E., Hefni M.A., Ahmed H.M. Factors Influencing Stope Hanging Wall Stability and Ore Dilution in Narrow-Vein Deposits: Part Ι. Geotechnical and Geological Engineering. 2020. Vol. 38, p. 1451-1470. DOI: 10.1007/s10706-019-01102-w
- Abdellah W.R.E., Hefni M.A., Ahmed H.M. Factors Influencing Stope Hanging Wall Stability and Ore Dilution in Narrow-Vein Deposits: Part II. Geotechnical and Geological Engineering. 2020. Vol. 38, p. 3795-3813. DOI: 10.1007/s10706-020-01259-9
- Cordova D.P., Zingano A.C., Gonçalves Í.G. Unplanned dilution back analysis in an underground mine using numerical models. REM – International Engineering Journal. 2022. Vol. 75. Iss. 4, p. 379-388. DOI: 10.1590/0370-44672021750093
- Câmara T.R., Leal R.S., Peroni R.L. Accounting for operational dilution by incorporating geological uncertainties in short-term mine planning. DYNA. 2020. Vol. 87. N 213, p. 178-183. DOI: 10.15446/dyna.v87n213.83661
- Mussin A., Imashev A., Matayev A. et al. Reduction of ore dilution when mining low-thickness ore bodies by means of artificial maintenance of the mined-out area. Mining of Mineral Deposits. 2023. Vol. 17. Iss. 1, p. 35-42. DOI: 10.33271/mining17.01.035
- Ngoma K., Mutambo V. Factors Influencing Ore Recovery and Unplanned Dilution in Sublevel Open Stopes. Case Study of Shaft No.4 at Konkola Mine, Zambia. Current World Environment. 2020. Vol. 15. Spec. Iss. 1, p. 31-46. DOI: 10.12944/CWE.15.Special-Issue1.03
- Suorineni F.T. Reflections on Empirical Methods in Geomechanics – The Unmentionables and Hidden Risks. AusRock 2014: Third Australian Ground Control in Mining Conference, 5-6 November 2014, Sydney, NSW, Australia. 2014, p. 143-156.
- Eero T. Mining method evaluation and dilution control in Kittilä mine: Master’s Thesis. Aalto University, 2014, р. 67.
- Imashev A., Suimbayeva A., Zhunusbekova G. et al. Research into stress-strain state of the mass under open pit with a change in the open-pit bottom width. Mining of Mineral Deposits. 2022. Vol. 16. Iss. 3, p. 61-66. DOI: 10.33271/mining16.03.061
- Delentas A., Benardos A., Nomikos P. Linking Stability Conditions and Ore Dilution in Open Stope Mining. International Conference on Raw Materials and Circular Economy, 5-9 September 2021, Athens, Greece. Materials Proceedings, 2021. Vol. 5. Iss. 1. N 34. DOI: 10.3390/materproc2021005034
- Vallejos J., Miranda R., Azorin J. et al. Stability graph using major geological structure. Fluid Mechanics Research International Journal. 2018. Vol. 2. Iss. 5, p. 243-246. DOI: 10.15406/fmrij.2018.02.00044
- Mortazavi A., Osserbay B. The Consolidated Mathews Stability Graph for Open Stope Design. Geotechnical and Geological Engineering. 2022. Vol. 40. Iss. 5, p. 2409-2424. DOI: 10.1007/s10706-021-02034-0
- Delentas A., Benardos A., Nomikos P. Analyzing Stability Conditions and Ore Dilution in Open Stope Mining. Minerals. 2021. Vol. 11. Iss. 12. N 1404. DOI: 10.3390/min11121404
- Hoek E., Carter T., Diederichs M. Quantification of the Geological Strength Index Chart. Proceedings of the 47th US Rock Mechanics/Geomechanics Symposium, 23-26 June 2013, San Francisco, CA, USA. New York: Red Hook, 2013, p. 1757-1764.
- Marinos V., Carter T.G. Maintaining geological reality in application of GSI for design of engineering structures in rock. Engineering Geology. 2018. Vol. 239, p. 282-297. DOI: 10.1016/j.enggeo.2018.03.022
- Hoek E., Brown E.T. The Hoek–Brown failure criterion and GSI – 2018 edition. Journal of Rock Mechanics and Geotechnical Engineering. 2019. Vol. 11. Iss. 3, p. 445-463. DOI: 10.1016/j.jrmge.2018.08.001
- Erhunmwun I.D., Ikponmwonsa U.B. Review on finite element method. Journal of Applied Sciences and Environmental Management. 2017. Vol. 21. N 5, p. 999-1002. DOI: 10.4314/jasem.v21i5.30
- Hackston A., Rutter E. The Mohr–Coulomb criterion for intact rock strength and friction – a re-evaluation and consideration of failure under polyaxial stresses. Solid Earth. 2016. Vol. 7. Iss. 2, p. 493-508. DOI: 10.5194/se-7-493-2016
- Imashev A.Z., Suimbayeva A.M., Abdibaitov S.A. et al. Justification of the optimal cross-sectional shape of the mine workings in accordance with the rating classification. Ugol. 2020. N 6, p. 4-9 (in Russian). DOI: 10.18796/0041-5790-2020-6-4-9
- Ulusay R. The ISRM Suggested Methods for Rock Characterization, Testing and Monitoring: 2007-2014. Springer, 2015, р. 293. DOI: 10.1007/978-3-319-07713-0
- Sukhanova A.A., Kambetova G.T. Determination of rock mass rating according to the MRMR geomechanical classification for the conditions of the Zholymbet deposit. Molodoi uchenyi (Young scientist). 2020. N 14 (304), p. 130-133 (in Russian).
- Imashev A.Z., Sudarikov A.E., Musin A.A. et al. Improving the quality of blasting indicators by studying the natural stress field and the impact of the blast force on the rock mass. News of the National Academy of Sciences of the Republic of Kazakhstan. Series of geology and technical sciences. 2021. Vol. 4. N 448, p. 30-35. DOI: 10.32014/2021.2518-170X.78