
Determination of the accuracy of leveling route based on GNSS/leveling and Earth gravitational model data SGG-UGM-2 at some typical regions in Vietnam
- 1 — Ph.D. Dean Hanoi University of Natural Resources and Environment ▪ Orcid
- 2 — Dean Hanoi University of Natural Resources and Environment ▪ Orcid
Abstract
This paper presents the accuracy of leveling routes determined by using GNSS/leveling at three grades and Earth gravitational model data SGG-UGM-2 in four regions of Vietnam by calculating the difference between the measured height anomalies and the model of pairs of points. The calculation is made based on the total points of three grades for four regions (99 in the Northwest, 34 in the Red River Delta, 130 in the Central Highlands, and 96 in the Mekong River Delta) with the leveling routes, connected between pair of points in each region are 189, 92, 294, and 203. The calculated results of the percentage of accuracy of the leveling routes of the four regions have shown that most of the leveling routes are satisfactory (grades I-IV, and technical leveling). The determination of the accuracy of the leveling route is completely applicable to other areas when the points have simultaneous ellipsoid and leveling heights and it also helps managers and surveyors to predict the accuracy of the height points when the above-mentioned leveling routes are connected and to take reasonable measures when implementing the project.
The article was written as part of the project TNMT.2022.562.04 by the Ministry of Natural Resources and Environment (MONRE), Vietnam.
Introduction
A height system is a one-dimensional coordinate system used to determine the metric distance of some points from a reference surface along a well-defined path, termed simply the height of that point [1]. Corresponding to the reference surface will give the type of height: the geoid reference surface will give the orthometric height, and the quasigeoid reference surface will give the normal height (also known as the leveling height). The reference surface is the ellipsoid which will give the ellipsoid height.
Most countries in the world have used the normal height system as the national height system. This height system is concretized by benchmarks (called national height points) buried in the field. The normal heights of benchmarks are determined based on the starting surface which is the average sea level for many years. National height points are control points serving the construction of all kinds of works for the socio-economic development, security, and defense of each country.
To establish topographic maps, cadastral maps, construction of civil and industrial works, traffic works, irrigation, mining, etc., height points are built. These points are connected with the national benchmarks from the leveling routes, and leveling closed loops. Therefore, if we know the accuracy of the leveling routes, we can predict the height accuracy of the connection points with those national height points.
In order to determine the accuracy of the leveling routes to achieve grade, it usually takes the following steps: measure in the field; process measurement data to calculate the mean square error per one km leveling route; compare the mean square error per one km leveling route with the permitted measurement error for leveling grades [2-6].
The accuracy of the leveling route is determined after the process of measuring and processing data, which wastes time and money, especially if the leveling route does not reach the required accuracy. Therefore, the idea of this study is to determine the accuracy of the leveling route without having to take measurements in the field. To carry out this study, the Earth gravitational model and GNSS/leveling data were used.
An Earth gravitational model (EGM) is a set of geopotential coefficients used in a spherical harmonic expansion to create a global potential surface to coincide with the Mean Sea Level (MSL). This model is used as the reference geoid in the WGS. Basically, Earth gravity model data are provided in two formats: as a series of spherical harmonic coefficients determining the model and as a geoid height of the point which have a coordinate. A GNSS point that has an ellipsoid height and leveling height is called a GNSS/leveling point.
GNSS/leveling data and Earth gravitational model play an important role in studies of the geoid, and national height systems and it is the input data source to carry out studies, such as:
The GNSS/leveling data is used to evaluate the accuracy of the global gravity model such as: evaluating and comparing models GOCE, EGM2008 in the Mediterranean area [7], Japan [8]; evaluating models EGM08, EIGEN-6C4, GECO in Iran [9], Turkey [10]; evaluating model EGM2008 [11]; comparing model XGM2019e with XGM2016, EIGEN-6C4, EGM2008 [12]; compare models EGM2008 and EGM96 in Iraq [13]; evaluating model EGM2008, EIGEN-6C4, XGM2019e_2159 in Korea [14]; comparing model EIGEN-6C4 with EGM2008 in Europe, USA, Canada, Brazil, Japan, Czech Republic and Slovakia [15]; evaluating the accuracy of models EGM2008, EIGEN-6C4, GECO, and SGG-UGM-1 in Kenya [16]; evaluating models EGM2008, EIGEN6C4, and GECO in the Aegean region [17]; evaluating models EGM96, EGM84, and EGM2008 in Iraq [18]; comparing models EGM96 and EGM2008 in Iraq [19]; comparing models OUS-91A, EGM96, and EGM2008 in Egypt [20]; evaluating model EGM2008 in Bangladesh [21]. GNSS/leveling data was used to build local geoid models such as in Iraq [19], Turkey [22], Evboriaria, Benin City (Nigeria) [23].
GNSS/leveling data were used to correct the global gravity model and build a local geoid model: the model EGM2008 and GNSS/leveling data to build a local geoid model in Indonesia [24], Nigeria [25], Vietnam [26], Turkey [27], Egypt [28], China [29], the USA [30]; model EIGEN6C4, leveling data, GNSS to build a local geoid model in Uganda [31].
GNSS/leveling data and the global gravity model were used to build the height system in Italy [32], the GNSS/leveling data and the model EGM2008 to build the height system in Palestine [33]; the GNSS/leveling was together with GOCE data to estimate the height reference system in Canada [34].
GNSS/leveling data, global gravity model and other data were used to build local geoid model: GNSS/leveling together with EGM2008 data, digital terrestrial model to determine geoid model in Mexico [35]; GNSS/leveling together with EIGEN-6C4 gravity data to build geoid model in Qatar [36]; GNSS/leveling together with GOCE data to build geoid models in the state of São Paulo (Brazil) [37]; GNSS/leveling together with model data XGM2019e_2159, digital terrestrial model ACE2 GDEM to build geoid model in Egypt [28]; GNSS/leveling together with model data EGM2008, EIGEN-6C4, gravity data, high-resolution topographic data, bathymetric data to build geoid model in Vietnam [38].
GNSS/leveling data and Earth gravitational model are indispensable factors when studying height-related issues in countries. It is an input data source to support evaluating the accuracy of the global gravity model, building the national height system, and the local geoid model.
In this study, based on the GNSS/leveling data and Earth gravitational model, the theoretical basis for determining the accuracy of the leveling routes is presented logically and rigorously. Based on the collected data, the experimental areas are selected as the areas in the territory of Vietnam.
Theoretical basis
The relationship between the ellipsoid height h and the normal height H is presented by the formula
where ζiGNSS/LEVELING – height anomaly of point i.
The height anomaly value can also be determined based on the Earth gravitational model.
To determine the accuracy of the leveling route connecting the national GNSS/leveling points, the value of the height anomaly when determined according to the GNSS/leveling data is compared with the corresponding data taken from the Earth gravitational model.
Suggested ζimodel is the height anomaly of the point i extracted from the Earth gravitational model. The formula for calculating the height anomaly of the point i is written as follows:
Calculate the average value of the deviation of height anomaly according to the following formula
where n – is point numbers.
The deviation of the pair of points i and j (Fig.1) are calculated according to the following formula
Combination of formula (2) and (3), get
Assign formulas
get the equation
The weight of the equation (6) is calculated according to the formula
where D – is the distance between points i and j, km.
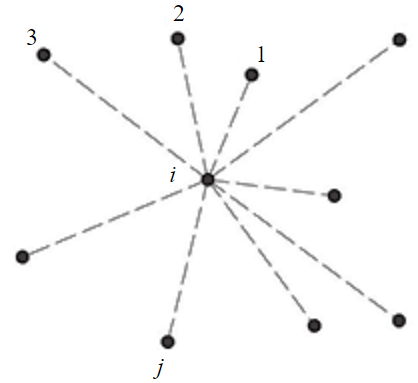
Fig.1. Pairs of points
The mean square error of the height anomaly difference over one kilometer is calculated according to the following formula:
where q – is the number of pairs of points used to perform the calculation.
The national standard on building height networks, the permited error for leveling route, leveling closed loop according to the grade are specified. In Vietnam, for mountainous areas, the permited error for leveling route, leveling closed loop of grades I, II, III, IV is 3√L, 5√L, 12√L, 25√L (L is in mm); respectively; for in the plains, these errors are 2√L, 4√L, 10√L, 20√L, respectively; for technical leveling, the error is 50√L (L is in km).
Vietnam is a country which has mostly low hills and mountains, with plains making up about a quarter of the area. Based on topography and economic development, Vietnam is divided into the following regions:
- Northwest region – terrain with many high mountain ranges;
- Northeast region – low hills;
- Red River Delta – relatively flat terrain, it is the economic center of the northern region of Vietnam;
- North central coast – mixed topography of mountains, hills and plains;
- South central coast – low mountains and plains;
- Highlands region – diverse topography, includes: high mountains, plateaus and large plains;
- Southeast region – midlands and low hills;
- Southwest region or Mekong River Delta – terrain is relatively flat, quite low compared to sea level, often affected by tides.
According to the national standard on building height networks, with different topographical areas, the error of leveling route, leveling closed loop according to their grades is different. Therefore, the areas having a typical topography of Vietnam are selected for research including: Northwest, Red River Delta, Central Highlands, Mekong River Delta. Data sources used in the analysis includeGNSS/Leveling data and Earth gravitational model data.
GNSS/leveling data
The points number of national GNSS/leveling in each experimental area is listed in Table 1. The leveling and geodetic heights of the GNSS/leveling points are detailed in Table 2.
Table 1
GNSS/ leveling points
|
Region |
Number of GNSS/ leveling points |
Total |
||
|
Grade I |
Grade II |
Grade III |
||
|
Northwest |
35 |
16 |
48 |
99 |
|
Red River Delta |
20 |
11 |
3 |
34 |
|
Highlands |
24 |
26 |
80 |
130 |
|
Mekong river Delta |
13 |
52 |
31 |
96 |
Table 2
Data of GNSS/leveling points
|
Points number |
Point index |
B0 |
L0 |
h, m |
H, m |
|
1 |
I(BMT-APD)12 |
12.28926 |
107.59477 |
907.6780 |
907.9755 |
|
2 |
I(BMT-APD)1-2 |
12.65835 |
108.02837 |
431.3888 |
431.2042 |
|
3 |
I(BMT-APD)16 |
12.10935 |
107.65618 |
833.2335 |
832.9730 |
|
4 |
I(BMT-APD)22 |
11.99578 |
107.51564 |
732.3017 |
732.6708 |
|
5 |
I(BMT-APD)25 |
11.93166 |
107.42908 |
575.1619 |
576.0473 |
|
6 |
I(BMT-APD)3 |
12.58108 |
107.84340 |
358.1393 |
358.6506 |
|
7 |
I(BMT-APD)6 |
12.49414 |
107.74019 |
580.5556 |
581.0788 |
|
8 |
I(BMT-NH)11-1 |
12.80411 |
108.54048 |
468.5150 |
466.5640 |
|
9 |
I(BMT-NH)17-1 |
12.73304 |
108.75417 |
423.7629 |
420.9371 |
|
10 |
I(BMT-NH)22 |
12.58583 |
108.85847 |
561.2232 |
557.7819 |
|
351 |
III(TT-GR)4 |
9.95520 |
105.36885 |
–5.6633 |
0.9933 |
|
352 |
III(TT-HN)2 |
10.92092 |
105.42574 |
–4.3237 |
4.1669 |
|
353 |
III(TT-TS)1 |
10.25559 |
105.16435 |
–5.4807 |
2.6149 |
|
354 |
III(TV-LS)9 |
9.71773 |
106.42700 |
–0.1141 |
2.0210 |
|
355 |
III(TY-VD)9 |
9.22404 |
104.81945 |
–6.3808 |
0.4914 |
|
356 |
III(UM-HDB)7 |
10.52037 |
104.70823 |
–8.4336 |
2.0185 |
|
357 |
III(VL-MC)7 |
10.23367 |
106.18661 |
–2.0257 |
1.8265 |
|
358 |
III(VT-PS)5 |
9.37355 |
105.39224 |
–4.1265 |
1.1779 |
|
359 |
III(VT-VC)7 |
9.29983 |
105.93297 |
–1.2964 |
1.4918 |
Earth gravitational model data
The Earth gravitational model SGG-UGM-2 is the latest model published in 2020. The data of this model can be accessed at the website of the International Center for Global Earth Models (ICGEM) (http://icgem.gfz-potsdam.de/tom). Height anomaly data of GNSS/leveling points got from the Earth gravitational model are listed in Table 3.
Table 3
Height anomaly data of GNSS/leveling points got from Earth gravitational model
|
Points number |
Point index |
ΔζSGG-UGM-2 ,m |
Points number |
Point index |
ΔζSGG-UGM-2 ,m |
|
1 |
I(BMT-APD)12 |
–0.6568 |
… |
… |
… |
|
2 |
I(BMT-APD)1-2 |
–0.4138 |
351 |
III(TT-GR)4 |
–6.9711 |
|
3 |
I(BMT-APD)16 |
–0.0710 |
352 |
III(TT-HN)2 |
–9.1764 |
|
4 |
I(BMT-APD)22 |
–0.6639 |
353 |
III(TT-TS)1 |
–8.7063 |
|
5 |
I(BMT-APD)25 |
–1.1798 |
354 |
III(TV-LS)9 |
–2.4782 |
|
6 |
I(BMT-APD)3 |
–1.0340 |
355 |
III(TY-VD)9 |
–7.1055 |
|
7 |
I(BMT-APD)6 |
–1.0081 |
356 |
III(UM-HDB)7 |
–11.1486 |
|
8 |
I(BMT-NH)11-1 |
1.3586 |
357 |
III(VL-MC)7 |
–4.1515 |
|
9 |
I(BMT-NH)17-1 |
2.3220 |
358 |
III(VT-PS)5 |
–5.4536 |
|
10 |
I(BMT-NH)22 |
3.0755 |
359 |
III(VT-VC)7 |
–3.1043 |
Results and discussions
The accuracy of the leveling routes is carried out according to the following steps:
- Calculate the height anomalies from measurement data GNSS/leveling ζiGNSS/LEVELING (formula (2).
- Calculate the deviation of hight anomaly between the measured height anomalies and model Δζi. The mean value of high anomaly Δζaverage is calculated in formula 3.
- Calculate the deviation of height anomalies of the pairs of points (formula Δζij (5).
- Calculate the weight of the leveling route Pij (formula (8).
- Calculate the mean square error of the height anomaly difference per kilometer mkm (formula (9) for each leveling route and for four regions.
- Calculate the permited error for each leveling route mpermied.
- Compare the mean square error of the height anomaly difference per kilometer of each leveling route with the permited error.
The calculated results in steps 1 and 2 are shown in Table 4 and Fig.2.
Table 4
Height anomalies from measurement data GNSS/leveling and their deviation and the model value
|
Points number |
Point index |
ζiGNSS/LEVELING, m |
Δζi, m |
Points number |
Point index |
ζiGNSS/LEVELING,m |
Δζi,m |
|
1 |
I(BMT-APD)12 |
–0.2975 |
0.3593 |
… |
… |
… |
… |
|
2 |
I(BMT-APD)1-2 |
0.1846 |
0.5984 |
351 |
III(TT-GR)4 |
–6.6566 |
0.3145 |
|
3 |
I(BMT-APD)16 |
0.2605 |
0.3315 |
352 |
III(TT-HN)2 |
–8.4906 |
0.6858 |
|
4 |
I(BMT-APD)22 |
–0.3691 |
0.2948 |
353 |
III(TT-TS)1 |
–8.0956 |
0.6107 |
|
5 |
I(BMT-APD)25 |
–0.8854 |
0.2944 |
354 |
III(TV-LS)9 |
–2.1351 |
0.3431 |
|
6 |
I(BMT-APD)3 |
–0.5113 |
0.5227 |
355 |
III(TY-VD)9 |
–6.8722 |
0.2333 |
|
7 |
I(BMT-APD)6 |
–0.5232 |
0.4849 |
356 |
III(UM-HDB)7 |
–10.4521 |
0.6965 |
|
8 |
I(BMT-NH)11-1 |
1.9510 |
0.5924 |
357 |
III(VL-MC)7 |
–3.8522 |
0.2993 |
|
9 |
I(BMT-NH)17-1 |
2.8258 |
0.5038 |
358 |
III(VT-PS)5 |
–5.3044 |
0.1492 |
|
10 |
I(BMT-NH)22 |
3.4413 |
0.3658 |
359 |
III(VT-VC)7 |
–2.7882 |
0.3161 |
Figure 2 shows that the topography of the four regions is generally higher than the model SGG-UGM-2. The average value of the deviation of height anomaly of the GNSS/leveling points between the measurements and model makes in the Northwest 0.4249 m, Red River Delta 0.6369 m, Central Highlands 0.4638 m, and Mekong River Delta 0.3588 m.
The calculated results in steps 3 and 4. From the GNSS/leveling points at the four regions, the leveling routes are formed based on pairs of points with the number of routes in the Northwest region 189, Red River Delta 92, Central Highlands 294, and Mekong River Delta 203. The measured height anomaly values and models of GNSS/leveling routes are shown in Table 5.
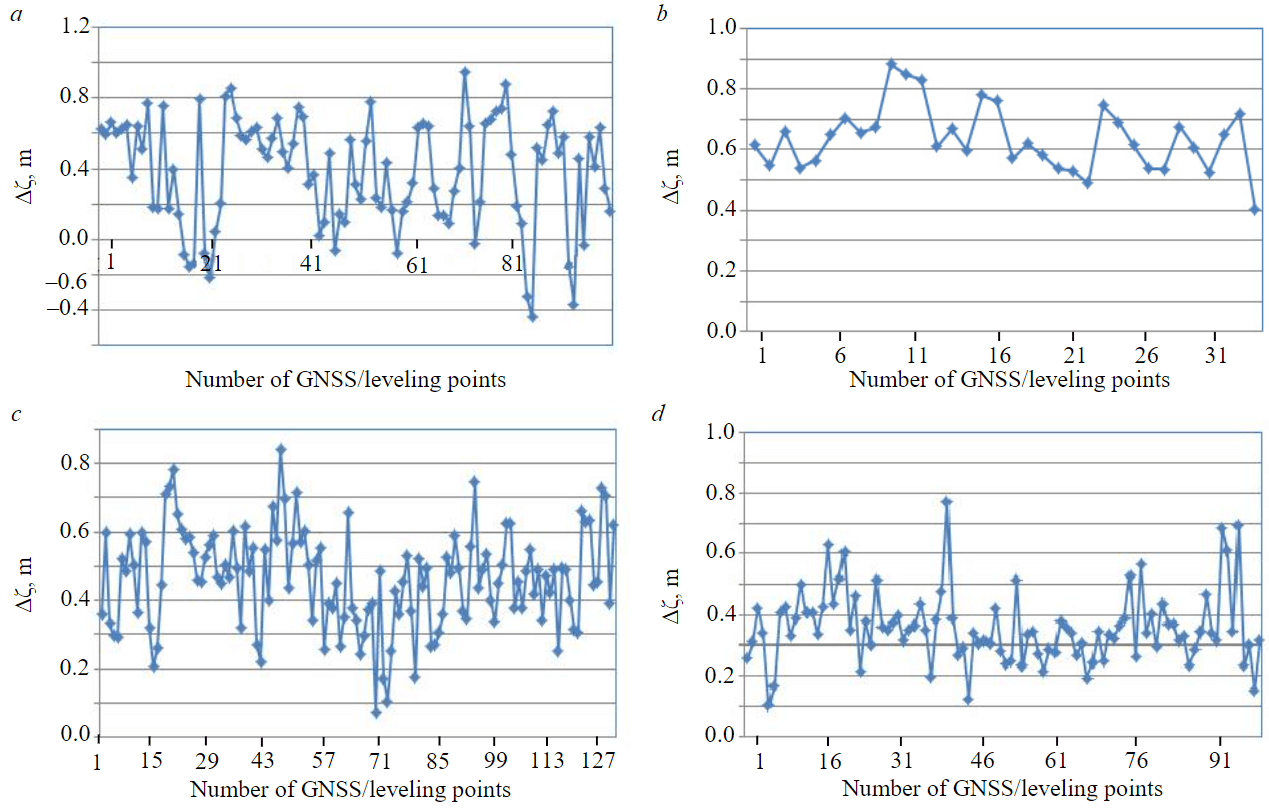
Fig.2. Height anomaly of model SGG-UGM-2 with the height anomaly of the GPS/ leveling: а – Northwest; b – Red River Delta; c – Central Highlands; d – Mekong River Delta
Table 5
The deviation of height anomalies of the national GNSS/leveling of pairs of points
|
Points number |
Start point |
End point |
D, km |
ζiGNSS/LEVELING, m |
ζijmodel,m |
Δζij ,m |
Pij |
|
1 |
I(BMT-APD)12 |
I(BMT-APD)16 |
21.0 |
–0.5580 |
–0.5858 |
0.0278 |
0.048 |
|
2 |
I(BMT-APD)12 |
III(DBS-DL)3 |
23.4 |
0.3530 |
0.1683 |
0.1847 |
0.043 |
|
3 |
I(BMT-APD)12 |
III(QS-DN)2 |
29.8 |
–1.1846 |
–1.2386 |
0.0540 |
0.034 |
|
4 |
I(BMT-APD)12 |
III(BDS-QP)5 |
33.0 |
–0.7274 |
–0.4316 |
–0.2958 |
0.030 |
|
5 |
I(BMT-APD)22 |
I(BMT-APD)25 |
11.8 |
0.5163 |
0.5159 |
0.0004 |
0.085 |
|
6 |
I(BMT-APD)22 |
I(BMT-APD)16 |
19.8 |
–0.6296 |
–0.5930 |
–0.0366 |
0.050 |
|
7 |
I(BMT-APD)25 |
I(BMT-APD)30 |
24.0 |
0.9462 |
0.9868 |
–0.0406 |
0.042 |
|
8 |
I(BMT-APD)25 |
III(BGM-MH)3 |
32.7 |
1.6841 |
1.8078 |
–0.1237 |
0.031 |
|
9 |
I(BMT-APD)3 |
I(BMT-APD)6 |
14.8 |
0.0119 |
–0.0259 |
0.0378 |
0.068 |
|
10 |
I(BMT-APD)3 |
III(BDS-QP)5 |
21.3 |
–0.9412 |
–0.8088 |
–0.1324 |
0.047 |
|
… |
… |
… |
… |
… |
… |
… |
… |
|
767 |
III(TT-HN)2 |
II(HN-AB)7 |
23.7 |
–0.7255 |
–1.0619 |
0.3364 |
0.042 |
|
768 |
III(TT-TS)1 |
II(CD-VC)8 |
32.3 |
–0.1642 |
–0.5622 |
0.3980 |
0.031 |
|
769 |
III(UM-HDB)7 |
III(OD-CN)1 |
26.1 |
–0.7561 |
–0.6581 |
–0.0980 |
0.038 |
|
770 |
III(VL-MC)7 |
II(TL-TV)5-1 |
17.5 |
–0.6959 |
–0.6593 |
–0.0366 |
0.057 |
|
771 |
III(VL-MC)7 |
II(MT-TV)6-1 |
17.6 |
–0.1647 |
–0.1954 |
0.0307 |
0.057 |
|
772 |
III(VL-MC)7 |
III(LH-TH)1 |
21.6 |
0.3888 |
0.4602 |
–0.0714 |
0.046 |
|
773 |
III(VL-MC)7 |
I(VL-HT)273A |
23.1 |
–0.3478 |
–0.3374 |
–0.0104 |
0.043 |
|
774 |
III(VL-MC)7 |
II(TX-TL)25 |
24.9 |
1.1117 |
1.1544 |
–0.0427 |
0.040 |
|
775 |
III(VL-MC)7 |
I(VL-HT)284A |
29.2 |
–1.1320 |
–0.9975 |
–0.1345 |
0.034 |
|
776 |
III(VT-PS)5 |
II(SC-PL)34 |
20.7 |
0.9892 |
0.9625 |
0.0267 |
0.048 |
|
777 |
III(VT-PS)5 |
II(SC-PL)15 |
21.9 |
0.6785 |
0.5949 |
0.0836 |
0.046 |
|
778 |
III(VT-VC)7 |
II(ST-PL)2 |
27.5 |
–0.7561 |
–0.6581 |
–0.0980 |
0.036 |
The calculated results from steps 5 to 7. The mean square error of the height anomaly difference over 1km of the four regions is calculated according to the formula (9):
for Northwest region
for Red River Delta region
for Central Highlands region
for Mekong River Delta region
To determine the accuracy of each leveling route, it is necessary to define two types of errors:
- the mean square error of the height anomaly difference over one km shows the accuracy of the leveling route that is calculated according to the formula (9); in case if it has only one leveling route, q = 1 and P = 1 and the mean square error of the height anomaly difference over 1 km will be calculated according to formula mkm=√[ΔζiΔζj];
- >the permitted error is also caculated for each leveling route based on the topography of the area. If the terrain is plain, the value of L = 1.1D (distance between two points), if the terrain is mountainous, the value of L = 1.3D.
The error value for each leveling routes is shown in Table 6.
Table 6
Error of the leveling routes
|
Points number |
Start point |
End point |
|mkm|, mm |
Absolute value of permitted error, mm |
Achieved grade of leveling route |
||||
|
Grade I |
Grade II |
Grade III |
Grade IV |
Technical leveling |
|||||
|
1 |
I(BMT-APD)12 |
I(BMT-APD)16 |
27.8 |
15.7 |
26.1 |
62.7 |
130.6 |
313.6 |
Grade III |
|
2 |
I(BMT-APD)12 |
III(DBS-DL)3 |
184.7 |
16.5 |
27.6 |
66.2 |
137.9 |
330.9 |
Technical |
|
3 |
I(BMT-APD)12 |
III(QS-DN)2 |
54.0 |
18.7 |
31.1 |
74.7 |
155.6 |
373.3 |
Grade III |
|
4 |
I(BMT-APD)12 |
III(BDS-QP)5 |
295.8 |
19.7 |
32.8 |
78.7 |
163.9 |
393.3 |
Technical |
|
5 |
I(BMT-APD)22 |
I(BMT-APD)25 |
0.4 |
11.8 |
19.6 |
47.0 |
97.9 |
235.0 |
Grade I |
|
6 |
I(BMT-APD)22 |
I(BMT-APD)16 |
36.6 |
15.2 |
25.4 |
60.9 |
126.9 |
304.5 |
Grade III |
|
7 |
I(BMT-APD)25 |
I(BMT-APD)30 |
40.6 |
16.8 |
27.9 |
67.0 |
139.6 |
335.1 |
Grade III |
|
8 |
I(BMT-APD)25 |
III(BGM-MH)3 |
123.7 |
19.6 |
32.6 |
78.3 |
163.0 |
391.3 |
Grade IV |
|
9 |
I(BMT-APD)3 |
I(BMT-APD)6 |
37.8 |
13.2 |
21.9 |
52.6 |
109.6 |
263.1 |
Grade III |
|
10 |
I(BMT-APD)3 |
III(BDS-QP)5 |
132.4 |
15.8 |
26.3 |
63.1 |
131.5 |
315.6 |
Technical |
|
… |
… |
… |
… |
… |
… |
… |
… |
… |
… |
|
767 |
III(TT-HN)2 |
II(HN-AB)7 |
336.4 |
10.2 |
20.4 |
51.1 |
102.1 |
255.4 |
Unsatisfactory |
|
768 |
III(TT-TS)1 |
II(CD-VC)8 |
398.0 |
11.9 |
23.8 |
59.6 |
119.2 |
298.0 |
Unsatisfactory |
|
769 |
III(UM-HDB)7 |
III(OD-CN)1 |
98.0 |
10.7 |
21.4 |
53.6 |
107.2 |
268.1 |
Grade IV |
|
770 |
III(VL-MC)7 |
II(TL-TV)5-1 |
36.6 |
8.8 |
17.6 |
43.9 |
87.8 |
219.5 |
Grade III |
|
771 |
III(VL-MC)7 |
II(MT-TV)6-1 |
30.7 |
8.8 |
17.6 |
44.0 |
87.9 |
219.9 |
Grade III |
|
772 |
III(VL-MC)7 |
III(LH-TH)1 |
71.4 |
9.8 |
19.5 |
48.8 |
97.6 |
243.9 |
Grade IV |
|
773 |
III(VL-MC)7 |
I(VL-HT)273A |
10.4 |
10.1 |
20.2 |
50.4 |
100.9 |
252.1 |
Grade II |
|
774 |
III(VL-MC)7 |
II(TX-TL)25 |
77.8 |
10.5 |
20.9 |
52.4 |
104.7 |
261.8 |
Grade IV |
|
775 |
III(VL-MC)7 |
I(VL-HT)284A |
42.7 |
11.3 |
22.7 |
56.6 |
113.3 |
283.2 |
Grade III |
|
776 |
III(VT-PS)5 |
II(SC-PL)34 |
134.5 |
9.5 |
19.1 |
47.7 |
95.4 |
238.5 |
Technical |
|
777 |
III(VT-PS)5 |
II(SC-PL)15 |
26.7 |
9.8 |
19.6 |
49.1 |
98.2 |
245.4 |
Grade III |
|
778 |
III(VT-VC)7 |
II(ST-PL)2 |
83.6 |
11.0 |
22.0 |
55.0 |
110.0 |
274.9 |
Grade IV |
The sum of leveling routes corresponding to the grades for each region in Table 6 is listed in Table 7. The number of leveling routes of each grade in four regions are calculated as the number of leveling routes of each grade divided by the total number of leveling routes of each respective region.
Table 7
Number of leveling routes achieved grades and percentage of accuracy
|
Region |
Number of leveling routes achieved grades |
Accuracy, % |
|||||||||||
|
Satisfactory |
Unsatisfactory |
||||||||||||
|
Grade Ι |
GradeΙΙ |
Grade ΙΙΙ |
Grade ΙV |
Technical leveling |
Unsatisfactory |
Total |
Grade Ι |
Grade ΙΙ |
Grade ΙΙΙ |
Grade ΙV |
Technical leveling |
||
|
Northwest |
13 |
7 |
25 |
45 |
68 |
31 |
189 |
6.9 |
3.7 |
13.2 |
23.8 |
36.0 |
16.4 |
|
Red River Delta |
9 |
7 |
15 |
28 |
30 |
3 |
92 |
9.8 |
7.6 |
16.3 |
30.4 |
32.6 |
3.3 |
|
Central Highlands |
31 |
15 |
62 |
97 |
85 |
4 |
294 |
10.5 |
5.1 |
21.1 |
33.0 |
28.9 |
1.4 |
|
Mekong River Delta |
16 |
14 |
35 |
51 |
67 |
20 |
203 |
7.9 |
6.9 |
17.2 |
25.1 |
33.0 |
9.9 |
The percentage of accuracy of the leveling routes of the four regions of Vietnam show that most of the leveling routes in the four regions are satisfactory (grades I-IV and Technical leveling). The highest grade that can be obtained for the leveling routes in all four experimental regions is grade I.
Conclusions
The results of determining the accuracy of the leveling routes from GNSS/leveling data and Earth gravity model SGG-UGM-2 at four regions – Northwest, Red River Delta, Central Highlands, Mekong River Delta – by calculating the difference between the measured height ano-malies and the model of pairs of points with the leveling routes, connected between pair of points in each region showed that most of the percentage of accuracy of the leveling routes of the four regions are satisfactory.
The effect of determining the accuracy of leveling routes allows to save time and money, since there is no need to take measurements in the field. The determination of the accuracy of the leveling route is completely applicable to other areas if the points have both geodetic and leveling heights.
From these results, managers and surveyors can predict the accuracy of the elevation points when the above-mentioned leveling routes are connected to take reasonable measures when implementing the project.
References
- Featherstone W.E., Kuhn M. Height systems and vertical datums: A review in the Australian context. Journal of Spatial Sciences. 2006. Vol. 51. Iss. 1, р. 21-41. DOI: 10.1080/14498596.2006.9635062
- El-Ashmawy K.L.A. Accuracy, time cost and terrain independence comparisons of levelling techniques. Geodesy and Cartography. 2014. Vol. 40. Iss. 3, р. 133-141. DOI: 10.3846/20296991.2014.962727
- Karila K., Karjalainen M., Hyyppä J. et al. A Comparison of Precise Leveling and Persistent Scatterer SAR Interferometry for Building Subsidence Rate Measurement. ISPRS International Journal of Geo-Information. 2013. Vol. 2. Iss. 3, р. 797-816. DOI: 10.3390/ijgi2030797
- Kubodera T., Okazawa H., Hosokawa Y. et al. Effects of Surveying Methods between GNSS and Direct Leveling on Elevation Values over Long Distance in Mountainous Area. International Journal of Environmental and Rural Development. 2016. Vol. 7. Iss. 1, р. 62-69. DOI: 10.32115/ijerd.7.1_62
- Perij S., Pokotylo I., Korliatovych T. Investigation of accuracy of methods of trigonometric levelling during the transmission of elevations over water surfaces. Geodesy, Cartography, and Aerial Photography. 2017. Vol. 85, p. 18-26. DOI: 10.23939/istcgcap2017.01.018
- Ding Liang Yang, Jin Gui Zou. Precise levelling in crossing river over 5 km using total station and GNSS. Scientific Reports. 2021. Vol. 11. N 7492. DOI: 10.1038/s41598-021-86929-1
- Carrion D., Vergos G., Albertella A. et al. Assessing the GOCE models accuracy in the Mediterranean area. Newton’s Bulletin. 2015. Vol. 5, p. 63-82.
- Odera P.A., Fukuda Y. Evaluation of GOCE-based global gravity feld models over Japan after the full mission using free-air gravity anomalies and geoid undulations. Earth, Planets and Space. 2017. Vol. 69. N 135. DOI: 10.1186/s40623-017-0716-1
- Foroughi I., Afrasteh Y., Ramouz S., Safari A. Local evaluation of Earth gravitational models, case study: Iran. Geodesy and Cartography. 2017. Vol. 43. Iss. 1, p. 1-13. DOI: 10.3846/20296991.2017.1299839
- Yılmaz M., Turgut B., Güllü M., Yılmaz I. The Evaluation of High-Degree Geopotential Models for Regional Geoid Determination in Turkey. Afyon Kocatepe University Journal of Science and Engineering. 2017. Vol. 17. N 015501, p. 147-153. DOI: 10.5578/fmbd.50706
- Pavlis N.K., Holmes S.A., Kenyon S.C., Factor J.K. The development and evaluation of the Earth Gravitational Model 2008 (EGM2008). Journal of Geophysical Research: Solid Earth. 2012. Vol. 117. N B04406, p. 1-38. DOI: 10.1029/2011JB008916
- Zingerle P., Pail R., Gruber T., Oikonomidou X. The combined global gravity field model XGM2019e. Journal of Geodesy. 2020. Vol. 94. N 66. DOI: 10.1007/s00190-020-01398-0
- Aljanbi A.J.A., Dibs H., Alyasery B.H. Interpolation and Statistical Analysis for Evaluation of Global Earth Gravity Models Based on GPS and Orthometric Heights in the Middle of Iraq. Iraqi Journal of Science. 2020. Vol. 61. N 7, p. 1823-1830. DOI: 10.24996/ijs.2020.61.7.31
- Lee J., Kwon J.H. Precision Evaluation of Recent Global Geopotential Models based on GNSS/Leveling Data on Unified Control Points. Journal of the Korean Society of Surveying, Geodesy, Photogrammetry and Cartography. 2020. Vol. 38. N 2, p. 153-163. DOI: 10.7848/ksgpc.2020.38.2.153
- Kostelecký J., Klokočník J., Bucha B. et al. Evaluation of gravity field model EIGEN-6C4 by means of various functions of gravity potential, and by GNSS/leveling. Geoinformatics FCE CTU. 2015. Vol. 14. N 1, p. 7-28. DOI: 10.14311/gi.14.1.1
- Odera P.A. Evaluation of the recent high-degree combined global gravity-field models for geoid modelling over Kenya. Geodesy and Cartography. 2020. Vol. 46. Iss. 2, p. 48-54. DOI: 10.3846/gac.2020.10453
- Yilmaz M., Turgut B., Gullu M., Yilmaz I. Evaluation of recent global geopotential models by GNSS/levelling data: Internal Aegean region. International Journal of Engineering and Geosciences (IJEG). 2016. Vol. 1. Iss. 1, p. 18-23. DOI: 10.26833/ijeg.285221
- Saray N.S., Ghazal N.K. Evaluation of Global Gravitational Models Based on DGPS/leveling Data over Baghdad University (IRAQ). Journal of Physics: Conference Series. 2021. Vol. 1804. N 012044. DOI: 10.1088/1742-6596/1804/1/012044
- Abdulrahman F.H. Determination of the local geoid model in Duhok Region, University of Duhok Campus as a Case study. Ain Shams Engineering Journal. 2021. Vol. 12. Iss. 2, p. 1293-1304. DOI: 10.1016/j.asej.2020.10.004
- Al-Karargy E.M., Doma M.I., Dawod G.M. Towards an Accurate Definition of the Local Geoid Model in Egypt using GPS/Leveling Data: A Case Study at Rosetta Zone. International Journal of Innovative Science and Modern Engineering (IJISME). 2014. Vol. 2. Iss. 11, p. 10-15.
- Sikder M.A.A., Falin Wu, Ahmed W.A. et al. Assessment of Orthometric Height Derived from Levelling, GNSS and EGM2008 Geoid Model in Bangladesh. 15th IEEE International Conference on Signal Processing (ICSP), 6-9 December 2020, Beijing, China. IEEE, 2020, p. 689-694. DOI: 10.1109/ICSP48669.2020.9321048
- Albayrak M., Özlüdemir M.T., Aref M.M., Halicioglu K. Determination of Istanbul geoid using GNSS/levelling and valley cross levelling data. Geodesy and Geodynamics. 2020. Vol. 11. Iss. 3, p. 163-173. DOI: 10.1016/j.geog.2020.01.003
- Eteje S.O., Ono M.N., Oduyebo O.F. Practical local geoid model determination for mean sea level heights of surveys and stable building projects. IOSR Journal of Environmental Science, Toxicology and Food Technology. 2018. Vol. 12. Iss. 6, p. 30-37. DOI: 10.5281/zenodo.2525661
- Heliani L.S. Evaluation of global geopotential model and its application on local geoid modelling of Java Island, Indonesia. AIP Conference Proceedings. 2016. Vol. 1755. Iss. 1. N 100005. DOI: 10.1063/1.4958534
- Oluyori P.D., Ono M.N., Eteje S.O. Computations of Geoid Undulation from Comparison of GNSS/Levelling with EGM 2008 for Geodetic Applications. International Journal of Scientific and Research Publications. 2018. Vol. 8. Iss. 10, p. 235-241. DOI: 10.29322/IJSRP.8.10.2018
- Thanh Son Tran, Mustafin M.G., Kuzin A.A. Creating a Local Quasigeoid Model for the Territory of Vietnam Using the Global Model EGM2008. Proceedings of the International Symposium “Engineering and Earth Sciences: Applied and Fundamental Research” (ISEES 2019), 10-13 June 2019, Grozny, Russia. Amsterdam: Atlantis Press, 2019. Vol. 1, p. 603-608. DOI: 10.2991/isees-19.2019.119
- Soycan M. Improving EGM2008 by GPS and leveling data at local scale. Boletim de Ciências Geodésicas. 2014. Vol. 20. Iss. 1, p. 3-18. DOI: 10.1590/S1982-21702014000100001
- Al-Karargy E.M., Dawod G.M. Optimum combinations of GGM and GDEM models for precise national geoid modeling. Proceedings of Engineering and Technology Innovation. 2021. Vol. 18, p. 15-24. DOI: 10.46604/peti.2021.6452
- Wei Liang, Roland Pail, Xinyu Xu, Jiancheng Li. A new method of improving global geopotential models regionally using GNSS/levelling data. Geophysical Journal International. 2020. Vol. 221. Iss. 1, p. 542-549. DOI: 10.1093/gji/ggaa047
- Mosayebzadeh M., Ardalan A.A., Karimi R. Regional improvement of global geopotential models using GPS/Leveling data. Studia Geophysica et Geodaetica. 2019. Vol. 63, p. 169-190. DOI: 10.1007/s11200-017-1084-9
- Kyamulesire B., Oluyori P.D., Eteje S.O. Comparative analysis of three plane geometric geoid surfaces for orthometric height modelling in Kampala, Uganda. FUDMA Journal of Sciences (FJS). 2020. Vol. 4. N 3, p. 48-51. DOI: 10.33003/fjs-2020-0403-255
- Barzaghi R., Carrion D., Reguzzoni M., Venuti G. A Feasibility Study on the Unification of the Italian Height Systems Using GNSS-Leveling Data and Global Satellite Gravity Models. IAG 150 Years. International Association of Geodesy Symposia. Cham: Springer, 2015. Vol. 143, p. 281-288. DOI: 10.1007/1345_2015_35
- Younis G. The Integration of GNSS/Leveling Data with Global Geopotential Models to Define the Height Reference System of Palestine. Arabian Journal for Science and Engineering. 2018. Vol. 43. N 7, p. 3639-3645. DOI: 10.1007/s13369-017-2912-5
- Hayden T., Amjadiparvar B., Rangelova E., Sideris M.G. Estimating Canadian vertical datum offsets using GNSS/levelling benchmark information and GOCE global geopotential models. Journal of Geodetic Science. 2012. Vol. 2. Iss. 4, p. 257-269. DOI: 10.2478/v10156-012-0008-4
- Alcantar-Elizondo N., Garcia-Lopez R.V., Torres-Carillo X.G., Vazquez-Becerra G.E. Combining Global Geopotential Models, Digital Elevation Models, and GNSS/Leveling for Precise Local Geoid Determination in Some Mexico Urban Areas: Case Study. ISPRS International Journal of Geo-Information. 2021. Vol. 10. Iss. 12. N 819. DOI: 10.3390/ijgi10120819
- Bos M., Fernandes R., Al-Marri M. et al. The New Gravimetric Geoid Model of Qatar: QG2020. FIG e-Working Week 2021, 21-25 June 2021, Netherlands.
- Guimarães G.D.N., Blitzkow D., Barzaghi R., Matos A.C.O.C. The computation of the geoid model in the state of São Paulo using two methodologies and GOCE models. Boletim de Ciências Geodésicas. 2014. Vol. 20. N 1, p. 183-203. DOI: 10.1590/S1982-21702014000100012
- Vu D.T., Bruinsma S., Bonvalot S. A high-resolution gravimetric quasigeoid model for Vietnam. Earth, Planets and Space. 2019. Vol. 71. N 65. DOI: 10.1186/s40623-019-1045-3